ISSN 2334-2447 (Print) 2334-2455 (Online) Copyright © The Author(s). All Rights Reserved. Published by American Research Institute for Policy Development DOI: 10.15640/jges.v6n2a4 URL: https://doi.org/10.15640/jges.v6n2a4
Effect of Political Processes on Demographic Development of Georgia
M. Putkaradze
1& L. Putkaradze
2Abstract
Demographic development of any country is a complex process related to many changes realized in the society and to political processes among them. The goal of the research is to determine peculiarities of demographic development due to political processes in the independent Georgia. The issue is rather urgent in a view point of the fact that the territorial integrity of the country is destroyed due to political processes and demographic situation has been deteriorated as well. Population decreased from 5,45 million to 3,73 million in the independent Georgia in 1991-2015. As a result of research the main reasons of the reduction of population were the political processes. In addition, natural growth rate dropped down as a result of deterioration of social-economic conditions and emigration became active due to compulsive migration. Improvement of the demographic situation is possible by restoring territorial integrity of the country, political stabilization and implementation of demographic policy. A lot of countries have demographic problems deteriorated as a result of political processes but the studies in this direction are less likely to be conducted. Therefore, studying the problem on the example of Georgia will be both, cognitive and applied at the same time.
Keywords: Politics; population; demography; migration. Introduction
Demographic development of Georgia has been progressed by stable tendency of growth for two centuries. However, the amount of population was decreased by 1,72 million i.e. by 31,6%. in the independent Georgia in 1991-2015. Due to the deteriorated socio-economic positions as a result of the political processes the natural growth rate of population fell down, the gender-age structure was breached and the emigration was increased. Therefore, study of demographic mechanism of the country is one of the most actual issues.
Demographic development research analysis (Bailey and Boyle 2004; Balbo et al.2013; Coleman 2008; Favell 2008; van Nimwegen and van der Erf 2010; Warnes and Williams, 2006) reveals that complex activities are done in direction of regulation natural flow of population and migration processes in the modern Europe. Ways of problem solution in direction of development demographic processes for different country types are also set (Ekberg 1999; Greenwood1997; King 2002; Paul 2011; Raymer et al. 2013; Schou 2006)but the effect of political processes on demographic development is less studied and exactly the mentioned can be considered as a positive side of the present research. The research revealed that, demographic situation of the country has been deteriorated and emigration processes became active due to political actions. Improvement of demographic situation in Georgia is possible by restoration of territorial integrity, political stabilization and implementation of demographic policy. Areas and Methods of the Study
1 Professor, Department of Geography, Batumi Shota Rustaveli State University,Georgia. E-mail: [email protected];
[email protected] Tel: +995593326000
2 student of Geography specialty, Batumi Shota Rustaveli State University, Georgia. E-mail: [email protected]
Demographic development of this or that country is rather complex and multiform issue and determination of its whole mechanism is a hard task in the most cases, especially when the demographic development is effected by political processes.
The history of demographic development of Georgia directly depended on political processes. Georgia used to be one of the strong countries in South-Western Europe in XII-XIII centuries with the population 2,5-3,5 million people. After the collapse of the unified feudal state, both losing of the country territories and decreasing of number of population started. Georgian population was decreased until 765 thousand people in 1765 (Jaoshvili 1996). In XIX century Georgia was under the governance of Russian Empire. Exactly from this period the country had a positive balance of migration. Accordingly, the amount of population was getting higher and higher. In 1918-1921 Georgia gained political independence but in 1921 Soviet governance got stronger and in 1922 Georgia became the part of Russian Empire. From the period of Soviet government until 1921-1991 when Georgian independent state was formed, the country population increased from 2, 41 million to 5, 45 million i.e. it was increased 2,3 times. From 1991, the number of population started to decrease.
The main goal of the research is to study demographic changes which took place in Georgia recently and the cause of these changes were the political processes. The issue is much more problematic since the territorial integrity of the country is destroyed and exactly this fact has a negative effect on the demographic development of the country. The following tasks had to be solved to receive the research goal:
- To be estimated the main issues of demographic development of independent Georgia;
- To be determined factors having effect on dynamic of number of population and their influence on the demographic processes;
- To be analyzed the changes in the structure of the population;
- To be identified the main reasons, scales and directions of migration process;
- To be determined the role of modern political processes in demographic development of the country to be estimated and further tendencies of its development.
Historical, statistical, comparative, also analysis of space and time are the basic methods of the research. Herewith, the peculiarities of research methods of studying demographic development used in some foreign countries of the world were also used during a research (Abel 2010; Booth and Tickle 2008; Raftery et al. 2012); Shang et al .2011).
Independent State Georgia is the object of the research but the number of population of de facto separatist regions, i.e. Abkhazia and Samachablo are not included in the statistic data.
Results &Discussions
Figure 1.Dynamic of number of Georgian population in 1990-2015.
Civil war in 1991-1992 had especially negative influence on demographic development of the country which made active separatist movements in the autonomous republics of Abkhazia and South Ossetia. Due to the above mentioned political processes the number of population decreased from 5, 45 million till 4, 93 million i.e. by 520 thousand-9, 6% (on average 260, 5 thousand in a year) in 1992-1994. 40 thousand people were sacrificed only in Abkhazia conflict, a part remained in the separatist regions of Abkhazia and Samachablo (South Ossetia) and some part (Russians, Ukrainians, Greeks, Jews) was emigrated. The negative balance of migration was 422800 people in the mentioned period. It should be admitted that the dynamic of population in an internal regional viewpoint used to be going in a different way. Namely, Kakheti, Kvemo Kartli and mountainous regions were less affected by the political processes.
Decrease of the population in a viewpoint of gender-age structure was very interesting in 1992-1994. In the mentioned period, the number of men reduced from 2, 58 million to 2, 33 million, i.e. by 250 thousand and women from 2, 87 million to 2, 60 million i.e. by 270 thousand. If analyzing the share of men and women, their number reduced almost equally by 9, 03% and 9, 05%.
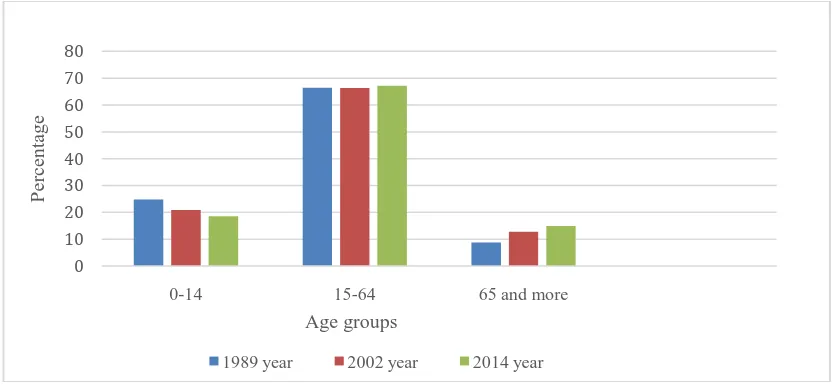
Generally it is well known that the rate of reduction of men in political processes is higher than-women’s (Kvasnicka and Bethmann 2013). On the example of Georgia, equal reduction of men and women clearly shows that the war sacrificed every group of society and in the emigration processes the whole families were involved (Bailey and Boyle 2004; Conway and Rork 2016); Kulu and González-Ferrer 2014). As for the age structures population in the age group of 0-14 was decreased by 14,1%, in the age group of 15-64 was decreased by 9,4% and in the age group of 65 and more by 0,1%. Relatively high rate of reduction in the age group of 0-14 was caused by falling of natural growth. The reason of decrease of the age group 15-64 was death of the contingent in the conflict and emigration. As for the minimum rate of decrease of the population in the age group 64 and above was the fact that the people were less affected by the mentioned political events.
In 1995-2002, reduction of population from 5, 06 million to 4, 60 million by 460 thousand, i.e. by 9, 1% is commonly noticeable but in comparison with the past period the average annual reduction was 65, 7 thousand i.e. 4 times less. Reduction of the population in the mentioned period was caused by worsened social-economic condition because of political processes and as a result natural growth was decreased. Depopulation was noted in the history of demographic development of Georgia in that period. Studies show that changes in the natural movement coefficients of the population are associated with many factors (Adsera 2004); Ajzen and Klobas 2013;Huttunen and Kellokumpu 2015; Lübke 2015;Matthew et al. 2015; Meladze and Loladze 2017;Sobotka et al. 2011), but the above factors had decisive influence on the reproducibility of the population of Georgia.
5.4
5.1
4.7 4.5
4.4
3.7
0 1 2 3 4 5 6
1990
1995
2000
2005
2010
2015
year
million
peop
―Rose Revolution‖ took place in November 2003 in Georgia and as a result important social-economical projects were realized with the political change. This improved demographic processes in the country. In 2003-2008, the number of population was increased from 4, 34 million to 4, 38 million, i.e. by 40 thousand people. The increase of population was caused by rise of rate of natural growth and by immigration processes as well. Depopulation was noticed in 2000 and it was -0,02 Per mille growing gradually and reached 3, 4 per mile (see fig. 2). Herewith, gender-age structure developed in a healthy way. Namely, the rate of men was reduced from 47,4% till 47, 2% in 1989-2002 and it was increased until 47,4% in 2003-2009. Tendencies of rise of the young contingent were also noticeable.
Figure 2.Natural flow of Georgian population in 1990-2015.
The war of August 2008 had some negative influence on demographic development of the country. In 2008-2015, the number of population was decreased from 4,38 million till 3,73 million i.e. by 650 thousand. At about 850 people died in the war some of them appeared on the territories of Abkhazia and South Ossetia and others emigrated.
Due to the poor demographic and socio-economic situation in the country as a result of political processes, changes have been made in the gender-age structure of the population. In particular, the share of young people is reduced and the population aging, or the "grey" danger is increased (see fig. 3).
Figure 3.Age Structure of Georgian Population in1989-2014
Political processes also have a substantial impact on the national structure of the country's population. Georgia is a multinational country with a geographical location, historical past and ethnic tolerance, but in recent years the share of Georgians and the trends of decreasing other ethnic minorities have increased (see fig. 4).
8.5
3.6
-0.2
0.8
3.4
2.8
-1 0 1 2 3 4 5 6 7 8 9
1990
1995
2000
2005
2010
2015
year
more
than
1000 pe
ople
0 10 20 30 40 50 60 70 80
0-14 15-64 65 and more
P
er
ce
n
tag
e
Age groups
It should also be noted that concentration of non-Georgian population is noticed in separate regions, especially in Kvemo Kartli (Azerbaijanis) and Javakheti (Armenians). Besides, the number of Georgians is growing in Tsalka municipality. For instance, in 1989, Georgians constituted only 3.6% of the population, when this figure increased to 46.7% in 2014.
Figure 4.National Composition of Georgian population in1989-2014
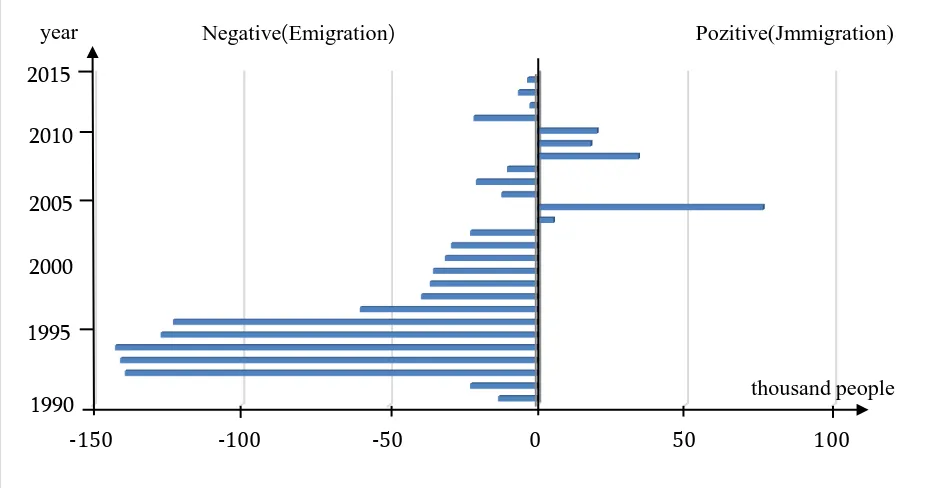
Migration processes played a vital role in the demographic development of Georgia (Tsuladze et al. 2008; Putkaradze 2008; Salukvadze and Meladze 2014) caused mainly by the above mentioned political situations. The direction and intensity of population migration processes (emigration, immigration) used to be different in different time periods (see fig. 5).
During the research period the country was left by 1044400 people (i.e. 64,5% of the average emigration, 673100 among them in 1992-1996), 154300 people were immigrated, i.e. negative rate of the migration was 890100 people and average intensity indicator per 1000 people used to be 191 ones. Intensity reduction of external migration processes is noticed in the recent years and immigration is typical only for some of them which are the result of ongoing political and social-economical processes in the country.
Figure 5.The migration balance of Georgian population in 1990-2015 0
10 20 30 40 50 60 70 80 90 100
Georgian Azerbaijanian Armenian Russian others
P
er
ce
n
tag
e
1989 year 2002 year 2014 year
-150 -100 -50 0 50 100
thousand people year
1990 2000 2005 2010 2015
1995
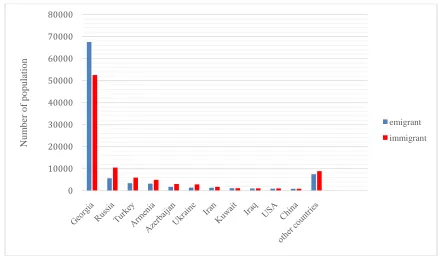
If we analyze the distribution of emigrants and immigrants according to nationality, in 1990-2015 the number of emigrants from Russians, Ukrainians, Greeks, Jews and other nationalities was large, and the largest portion of immigrants belonged to Georgians. The distribution of emigrants and immigrants according to citizenship almost coincides with the historical homeland of the above mentioned ethnicities, i.e, repatriation has occurred. In recent years, the distribution of emigrants and immigrants according to citizenship is mainly related to international economic relations of the country (see fig. 6).
Figure 6.Distribution of emigrants and immigrants according to citizenship in 2015
In the 1990s, a large part of the country's vulnerable population went into searching for jobs in the European and North American countries as a result of difficult political processes and difficult socio-economic conditions. In general, labor migration is one of the main topics for the Eastern Europe region ( Favel 2008; King 2002; Schou 2006; Verwiebe et al. 2014;Warnes and Williams 2006), but in recent years, trends of labor emigration reduction in Georgia are observed.
Internal migration processes were different because of the political processes in Georgia. Due to the difficult political and difficult socio-economic conditions created during the transition period, some of the population of the city moved into rural areas, and the number of people willing to the villages was reduced to a minimum. As a result of improving political stabilization and socio-economic conditions in recent years, the rural population is intensively moving to cities, especially in big cities - in Tbilisi and Batumi.
As a result of violation of Georgia's territorial integrity, internally displaced persons (IDPs), or IDPs, have appeared in the country with the number of 273,4 thousand. IDPs live in almost all regions of the country, but most of them - 38,8%, are in Tbilisi, 31,9% in Samegrelo and 9,6% - in Imereti.
Conclusions
Thus, political processes in Georgia have had a decisive impact on the demographic development of the country. The number of population has decreased, the level of natural growth has fallen, the gender-age structure of the population has been violated, the emigration processes have been strengthened and IDPs have been appeared. The positive trends in Georgia's demographic development in recent years are the result of the country's political stabilization, social-economic growth and demographic policies.
0 10000 20000 30000 40000 50000 60000 70000 80000
Nu
m
b
er
o
f
p
o
p
u
latio
n
emigrant
References
Abel,G.J.(2010) Estimation of international migration flow in Europe. Journal of the Roual statistical Society, Series A, 173(4), 797-825.
Adsera, A. (2004). Changing fertility rates in developed countries.The impact of labour market institutions. Journal of Population Economics, 17(1), 17–43.
Ajzen, I., &Klobas, J. (2013). Fertility intentions: An approach based on the theory of planned behaviour. Demographic Research, 29, 203–232.
Bailey, A., & Boyle, P. (2004).Untying and retying family migration in the new Europe. Journal of Ethnic and Migration Studies, 30(2), 229–241.
Balbo, N., Billari, F. C., & Mills, M. (2013). Fertility in advanced societies: A review of research. European Journal of Population, 29(1), 1–38.
Booth,H.,&Tickle,L.(2008). Mortality modeling and forecasting: A rewiew of metods. Annals of Actuarial Scienc, 1(2), 3-43.
Coleman, D. (2008). The demographic effects of international migration in Europe. Oxford Review of Economic Policy, 24(3), 453–477.
Conway,K., Rork, J.(2016). How Has Elderly Migration Changed in the Twenty-First Century? What the Data Can—and Cannot—Tell Us. Journal Demography. 53(4),1011-1025.
Ekberg, J. (1999). Immigration and the public sector. Income effects for the native population in Sweden. Journal of Population Economics, 12(3), 411-430.
Favell, A. (2008). The new face of East–West migration in Europe. Journal of Ethnic and Migration Studies, 34(5), 701–716.
Greenwood, M. (1997). Internal migration in developed countries‖. In M. R. Rozenzweig& O. Stark (Eds.), Handbook of population and family economics New York: Elsevier. 647–720.
Huttunen, K., &Kellokumpu, J. (2015).The effect of job displacement on couples’ fertility decisions. Journal of Labor Economics, 34,403–442.
Jaoshvili, V., (1996). Population of Georgia. Tbilisi.
King, R.(2002). Towards a new map of European migration. International Journal of Population Geography, 8(2), 89-106.
Kulu, H., & González-Ferrer, A. (2014). Family dynamics among immigrants and their descendants in Europe: Current research and opportunities. European Journal of Population,30, 411–435.
Kvasnicka, M., &Bethmann, D. (2013).World War II, missing men, and out-of-wedlock childbearing. Economic Journal, 123,162–194.
Lübke, C. (2015). How migration affects the timing of childbearing: The transition to a first birth among polish women in Britain. European Journal of Population, 31(1), 1–20.
Matthew,f., Larsen,T., Mccarthy, J., Jeremy,G., Moulton, Marianne. E.(2015). War and Marriage: Assortative Mating and the World War II GI Bill. Journal Demography. 52(5).1431-1461.
Meladze, G., Loladze, N. (2017).Population Changes and Characteristics of Demographic Processes in Tbilisi .Space-Society-Economy. N19, 85-101.
Paul, A. (2011). Stepwise international migration: A multistage migration pattern for the aspiring migrant. American Journal of Sociology, 116(6), 1842–1886.
Putkaradze, M., (2008). Features of modern migrational processes of population in mountainous regions of Georgia. Journal Geography of Georgia.6-7,148-151.
Raftery, A., Li, N., Ševcíková, H., Gerland, P., & Heilig, G. (2012).Bayesian probabilistic population projections for all countries. Proceedings of the National Academy of Sciences of the USA, 109,13915–13921.
Raymer, J., Wiśniowski, A., Forster, J., Smith, P., &Bijak, J. (2013).Integrated modeling of European migration. Journal of the American Statistical Association, 108(503), 801–819.
Salukvadze, J.& Meladze, G. (2014). Georgia: Migration, a main risk towards demographic future. In: Eross, Agnes and David Karacsonyi (eds.), Discovering Migration BetweenVisegrad Countries and Eastern Partners. Budapest: HAS RCAES Geographical Institute, (PP. 150-169.
Schou, P. (2006). Immigration, integration and fiscal sustainability. Journal of Population Economics, 9(4), 671-689. Shang, H., Booth, H., & Hyndman, R. (2011). Point and interval forecasts of mortality rates and life expectancy: A
Sobotka, T., Skirbekk, V., &Philipov, D. (2011).Economic recession and fertility in the developed world. Population and Development Review,37,267–306.
Tsuladze, M., Maghlapheridze, N., Kopaleishvili, N., Mamardashvili, G.,(2008). Demographic development of Georgia: Yesterday, today, tomorrow. Tbilisi, 2008.
VanNimwegen, N., & van der Erf, R. (2010). Europe at the crossroads: Demographic challenges and international migration. Journal of Ethnic and Migration Studies, 36(9), 1359– 1379.
Verwiebe,R., Wiesbock, L.,&Teitzer,R. (2014). New forms of intra-European migration, Iabour market dynamics and social inequality in Europe. Migration Letters, 11(2), 125-136.