Optical Properties And Electronic Transition
Of Sno
2
:Li Thin Films
Majid H . Hasouny , Salam Jumah Mashkoor
AL – Mustansiriyah University – college of Education , physics department Baghdad – Iraq
Corresponding author, E- mail:Ahmed_ naji _ abd @ yahoo . com
Abstract—In this paper , Undoped Tin Oxide and
Lithium doped Tin Oxide with a percentage of
doping (𝟓%) to (0.05, 0.1 , 0.15, 0.2 ) M of the Concentration , and have been deposited on a glass substrate only at A substrate temperature
of (400℃ ) . The thickness of the deposited film
Found to about (350 ∓𝟏𝟓) nm . The optical properties SnO 2 has been studied transmittance and absorbance in the wave lengths rang (360 -950)nm . The optical energy gap in the allowed direct transitions values for the undoped (SnO2) Films were (2.8, 2.7 , 2.6, 2) eV respectively, for each concentraction (0.05, 0.1, 0.15, 0.1 )M respectively, at the rate of doping . When (SnO2) films are doped with lithium by (5%) , we note that the optical energy gap values for the allowed transmission decrease when the dopping is increased (2.7, 2.4, 2.3, 2.2 ) eV respectively for each concentractions. The absorbance that decrease with the increase indoping for each concentraction and the transmittance increased per concentration and (extinction coefficient, reflectiance , refractive index , real and imaginary
By increasing in the doping per concentraction .
Keywords—SnO2 :Li , Optical properties , direct allowed transition , chemical Spray
Pyrolysis ,
Introduction :
In this work , method was used chemical Spray pyrolysis technique (CSP) ,this mothed is characterized by low cost and high- melting material, films can be prepared and well – homogenous films can be prepared in large area , this method is also suitable of films of oxides and sulfate materials[1] . The researcher
(Manifacieret . al ) [2] studied thin (SnO2)
who prepared in two ways they the thermal Evaporation in vacuum and chemical Spray pyrolysis , he studied their optical and electrical properties ,where it was found that the mothed of thermal evaporation is the edge of absorption
(2.4 eV) and the quality resistance (2×10⁵
Ω . cm) , either in chemical Spray pyrolysis method the edge of the absorption (3.7 eV) and the quality (5×10⁵ Ω . cm ) , the reason for this
difference is due to the process of crystallization of the prepared film , in the method of thermal evaporation the films were amorphous to crystallization ,in the chemical Spray pyrolysis method , the films were polycrystalline.Tin oxide (SnO2) is a sensitive material for various
gases , which has led to a lot of research in the field of gas sensors [3].It has recently been used in the design of ultraviolet (UV)and Laser diodes [4] . Experimental Work
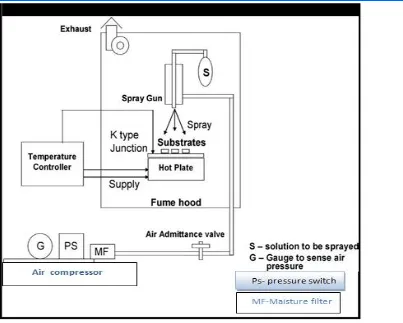
:-Lithium was doped by 5% and by concenteration (0.05, 0.1,0.15,0.2)M , thin (SnO2) films are prepared using a
chemical Spray pyrolysis device as
Shown in figure (1) . By using Tin chloride (SnCl2 . 2H2O) and the
Figure (1) shows the chemical Spray pyrolysis unit
Percentage of doping (5%) distilled water by using mixer glass at normal atmospheric pressure, then the solution was sprayed with a fixed distance
On the glass substrates of films was heated at a temperature of (400℃) .
Thickness of (350 ∓ 15) nm . The lithium was used as a doping agent with a volumetric concentrations of (0.05 , 0.1 , 0.15 , 0.2) M . The thickness of the films of the equation :-
t =∆𝑚
𝜌𝐴𝑆 --- (1)
the absorbance and the transmittance were recorded using a spectrophotometer type (shimadzu UV – 1650 PC) in the wavelength range (360 – 950) nm and all reading were recorded at room
Results and dissction :-
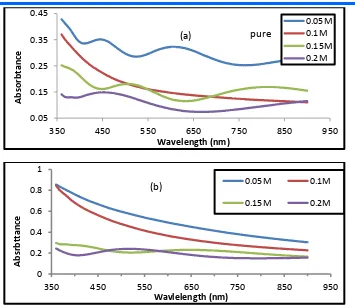
Figure (2-a,b) shows the relationship between absorbance and wavelengths(360 – 950) nm of the SnO2 films, (a) undoped
of the concenterations (0.05, 0.1, 0.15,0.2) M , ( b) doped with lithium by percentage (5%) and concentrations (0.05, 0.1, 0.15, 0.2) M . We observe a decrease in absorption by the increasing of wavelength , because the falling photon could not irate the electron and move it from the balance to the conductor beam and so on photon energy is less than the value of the forbidden gap [5] , we also note that absorption at wavelength leads to an increase in the optical energy
Figure (2-a,b) absorbance as a function of wavelength for Tin oxide (SnO2) films (a) undoped
different concentrations (0.05, 0.1, 0.15, 0.2)M
(b) Lithium and different concenterations with doping(5%) .
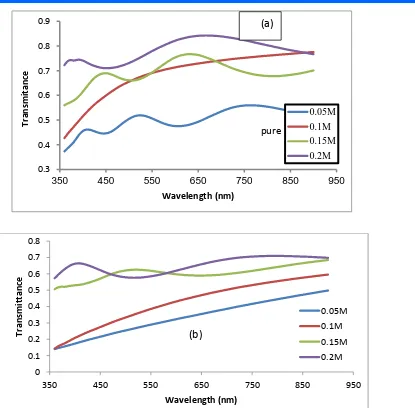
Figure (3-a,b) represents the relationship between the transmittance and the wavelength of the tin oxide films (a) undoped (SnO2) , (b) doped of lithium
(SnO2:Li) with percentage of doping
(5%) increased transmittance with increased wavelength . As well as increasing
transmittance by increasing doping concentrations with lithium . This is due to the lower roughness of the surface that has been increased by doping concentrations (SnO2:Li) . The roughness
of the surface reduces the dispersion of light and improves transmittance[6] . 0.05
0.15 0.25 0.35 0.45
350 450 550 650 750 850 950
Abso
rbtance
Wavelength (nm)
0.05M 0.1M 0.15M 0.2M
pure (a)
0 0.2 0.4 0.6 0.8 1
350 450 550 650 750 850 950
Absrb
ttance
Wavlelength (nm)
0.05M 0.1M
0.15M 0.2M
Figure (3- a, b) transmittance as a function of wavelength for tin oxide films (a) undoped , (b) doped lithium and different concentrations (0.05, 0.1, 0.15, 0.2) M of the percentage of doping (5%) .
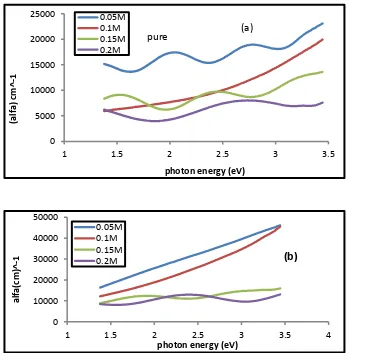
The absorption coefficient can be
calculated in the absorption region of the relationship [6] .
α = 2.303 A /d --- (2)
d : the thickness of the films . A : absorbance .
When the absorption coefficient value is (α > 104 𝑐𝑚−1) is the occurrence of the allowed direct transitions [7] . Figure (4 –
a, b ) shows the change in the absorption coefficient by photon energy for tin oxide , (a) undoped (b) doped with lithium for Concentrations (0.05, 0.1, 0.15 , 0.2) M and by doped (5%) . Not that the Coefficient absorption decreases with the increase of the oercentage of doped concentrations which are consistant (Bagheri) [8] .
0 0.1 0.2 0.3 0.4 0.5 0.6 0.7 0.8
350 450 550 650 750 850 950
Transmittanc
e
Wavelength (nm)
0.05M 0.1M 0.15M 0.2M
(b)
0.3 0.4 0.5 0.6 0.7 0.8 0.9
350 450 550 650 750 850 950
Transmitance
Wavelength (nm)
0.05M 0.1M 0.15M 0.2M
pure
Figure (4 - a,b) shows absorption coefficient as a function of photon energy of Tin oxide films (a) undoped , (b) doped lithium and different concentrations (0.05, 0.1, 0.15, 0.2 ) M of the percentage of doping (5%).
The opticl gap can be calculated (𝐸𝑔𝑜𝑝𝑡) for direct allowed transition according to this relationship [9] . α(ℎ𝑣) = p (ℎ𝑣 − 𝐸𝑔𝑜𝑝𝑡)𝑟 --- (3)
p: constant depends on the type of metrial .
𝐸𝑔𝑜𝑝𝑡 : optical energy gap .
r : 1/2 value .
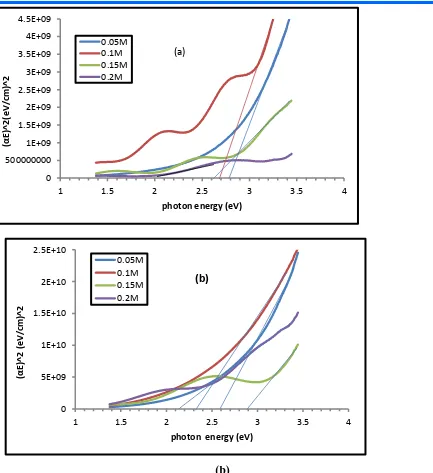
Figure (5 – a,b) represents the relationship between photon energy and the( αℎ𝑣)2 of Tin oxide for as deposited . Thin films of concentrations
(0.05, 0.1, 0.15, 0.2 ) M . The optical energy gap was decreasing up on
Doping ratio . The reason for this is the formation of local levels in the conduction bond there leading to decrease the optical energy gap(𝐸𝑔𝑜𝑝𝑡)
0 5000 10000 15000 20000 25000
1 1.5 2 2.5 3 3.5
(a
lfa) cm^
-1
photon energy (eV) 0.05M
0.1M 0.15M 0.2M
pure (a)
0 10000 20000 30000 40000 50000
1 1.5 2 2.5 3 3.5 4
al
fa(cm)^
-1
photon energy (eV) 0.05M
0.1M 0.15M
(b)
Figure (5-a,b) optical energy gap for direct transmission allowed Tin oxide films is (a)undoped and(b) doped lithium and different concentrations (0.05, 0.1, 0.15,0.2)M
of the percentage of doping (5%) 0
500000000 1E+09 1.5E+09 2E+09 2.5E+09 3E+09 3.5E+09 4E+09 4.5E+09
1 1.5 2 2.5 3 3.5 4
(αΕ)
^2
(eV/c
m)^
2
photon energy (eV) 0.05M
0.1M 0.15M 0.2M
(a)
0 5E+09 1E+10 1.5E+10 2E+10 2.5E+10
1 1.5 2 2.5 3 3.5 4
(αΕ)
^2
(eV/c
m)^
2
photon energy (eV) 0.05M
0.1M 0.15M 0.2M
Table (1) Optical energy gap for direct transitions allowed values for Tin oxide films undoped and doped lithium for the concentrations (0.05, 0.1, 0.15, 0.2 ) M
Of percentage of doping (5%) .
sample Optical energy gap values (𝑬𝒈𝒐𝒑𝒕)for direct transmission
Allowed (eV)
(SnO2) (0.05) M 2.8
(SnO2) (0.1) M 2.7
( SnO2) (0.15) M 2.6
( SnO2) (0.2 ) M 2
( SnO2: Li) (0.05) M 2.7
( SnO2: Li) (0.1) M 2.4
( SnO2: Li) (0.15) M 2.35
(SnO2: Li) (0.2) M 2.2
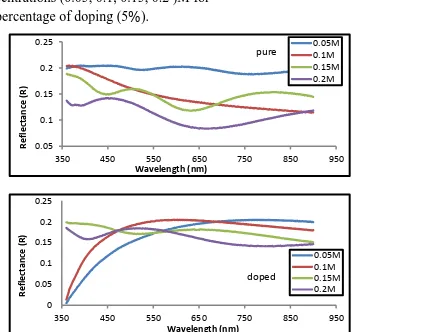
Figure (6- a,b) represents the relationship between the wave-length and the
Reflectance of the undoped and lithium doped Tin oxide for different
concentrations (0.05, 0.1, 0.15, 0.2 )M for the percentage of doping (5%).
We can note that the reflectance decrease with increase in wavelength . The reflectance of the doping thin films were decreased for increasing doping concentrations .
Figure (6- a, b) Reflectance as a function of wavelength for tin oxide films (a) undoped , (b) doped lithium and different concentrations (0.05, 0.1, 0.15, 0.2) M of the percentage of doping (5%) .
0.05 0.1 0.15 0.2 0.25
350 450 550 650 750 850 950
Reflectance
(R)
Wavelength (nm)
0.05M 0.1M 0.15M 0.2M
pure
0 0.05 0.1 0.15 0.2 0.25
350 450 550 650 750 850 950
Reflectance
(R)
Wavelength (nm)
0.05M 0.1M 0.15M 0.2M
The Refractive index (𝑛°) calculation through the following relationship[11] .
𝑛° = [(1+𝑅1−R− (K°2+ 1)]12 +1+R
1−R
--- (4)
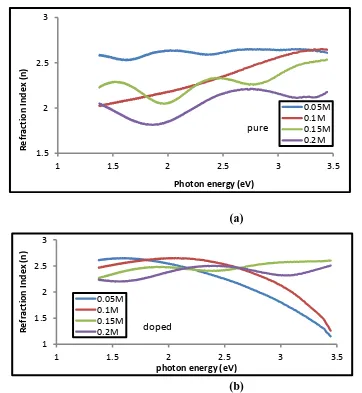
Figure (7- a,b) represents the relationship between the wavelength and the Refractive index of the (a) undoped , (b) Lithium doped Tin oxide different concentrations (0.05, 0.1, 0.15, 0.2 ) M of
the percentage of doping (5%) . We can notice that the refractive index decrease with the increase in wavelength . The refractive index of the thin films will decrease when the concentrations ratios increase as a result of the change of crystalline surfaces . We also note that the refractice index digram is Similar to the
reflective digram
,
(a)
(b)
Figure (7 - a,b) shows Refractive index as a function of photon energy of Tin oxide films (a) undoped , (b) doped lithium and different concentrations (0.05, 0.1, 0.15, 0.2 ) M of the percentage
of doping (5%).
Extinction coefficient (𝑘°) calculation through the following relationship [12] :-
𝑘° = 𝛼𝜆4𝜋 --- (5) 1.5
2 2.5 3
1 1.5 2 2.5 3 3.5
Refra
ction
In
dex
(n)
Photon energy (eV)
0.05M 0.1M 0.15M 0.2M
pure
1 1.5 2 2.5 3
1 1.5 2 2.5 3 3.5
Refra
ction
In
dex
(n)
photon energy (eV) 0.05M
0.1M 0.15M
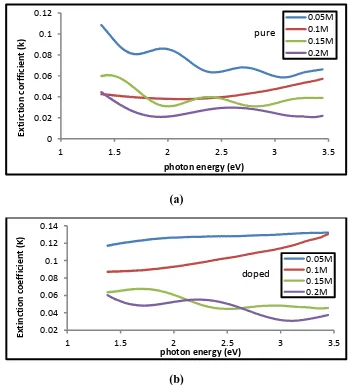
Figure (8- a,b) represents the relationship between the photon energy and
The Extinction coefficient of the , (a) undoped , (b) Lithium doped Tin oxide for different concenterations (0.05, 0.1, 0.15, 0.2) M of the percentage of doping
(5%) , we can notice that the Extinction coefficient
Decrease with the increase in photon energy for the undoped of the concentrations (0.05, 0.1, 0.15, 0.2 )M and lithium doped for the concenterations
(a)
(b)
Figure (8 - a,b) shows Extinction coefficient as a function of photon energy of Tin oxide films (a) undoped , (b) doped lithium and different concentrations (0.05, 0.1, 0.15, 0.2 ) M of the percentage of doping (5%).
Real dielectric constant (Ɛ1) and
imaginary dielectric (Ɛ2) can be calculated using of the following ( 6 )
𝑛°2− 𝑘
°2 = 𝜀1 ( 7 ) 𝑘° 𝜀2=2𝑛°
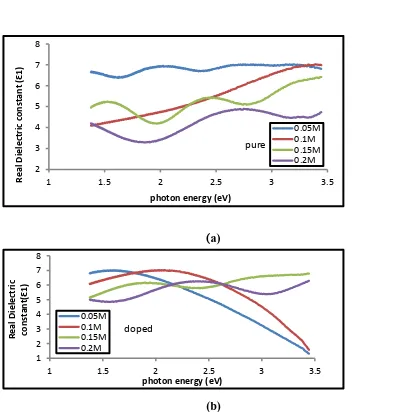
Figure (9- a,b) represents the relationship between the real (Ɛ1) part of
Dielectric constant and the photon energy of the (a) undoped , (b) Lithium doped Tin oxide for different concentrations (0.05, 0.1, 0.15,0.2) M of the percentage of doping (5%) . The real dielectric constant can be
0.02 0.04 0.06 0.08 0.1 0.12 0.14
1 1.5 2 2.5 3 3.5
Extinction
coef
ficien
t
(K)
photon energy (eV)
0.05M 0.1M 0.15M 0.2M doped 0 0.02 0.04 0.06 0.08 0.1 0.12
1 1.5 2 2.5 3 3.5
Extirction
corff
icient
(k)
photon energy (eV)
0.05M 0.1M 0.15M 0.2M
Notice with the refractive index because the real part depend on refractive index according to the eqution (6) . we can notice thar the real part decrease with the
increase in photon energy for the undoped same the real part of the doping thin films were decreased as the doping concentrations .
)a)
(b)
Figure (9 - a,b) shows Real dielectric constant as a function of photon energy of Tin oxide films (a) undoped , (b) doped lithium and different concentrations (0.05, 0.1, 0.15, 0.2 ) M of the percentage of doping (5%).
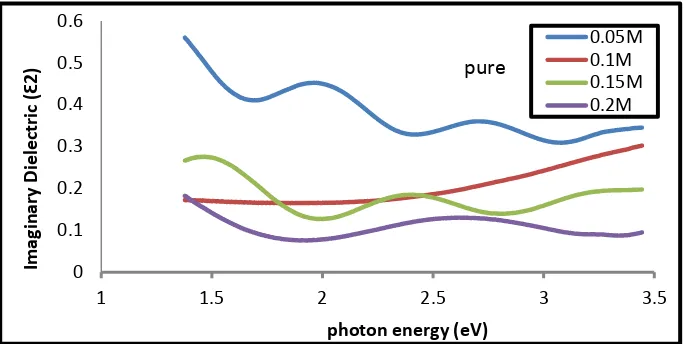
Figure (10- a,b) represents the relationship between the imaginary (Ɛ2) part of Dielectric constant and the photon energy of the (a) undoped , (b)
Lithium doped Tin oxide for different concentrations (0.05, 0.1, 0.15,0.2) M of the percentage of doping (5%) . The imaginary dielectric constant can be
refractive index according to the eqution (7) . we can notice thar the imaginary part decrease with the increase in photon energy for the undoped same the imaginary part of the doping thin films were decreased as the doping concentrations .
2 3 4 5 6 7 8
1 1.5 2 2.5 3 3.5
Rea
l Dielectric
con
stant
(Ɛ
1
)
photon energy (eV)
0.05M 0.1M 0.15M 0.2M
pure
1 2 3 4 5 6 7 8
1 1.5 2 2.5 3 3.5
Rea
l Dielectric
con
stant(Ɛ
1
)
photon energy (eV) 0.05M
0.1M 0.15M 0.2M
( a )
(b)
Figure (9 - a,b) shows Imaginary dielectric constant as a function of photon energy of Tin oxide films (a) undoped , (b) doped lithium and different concentrations (0.05, 0.1, 0.15, 0.2 ) M of the percentage of doping (5%).
Conclusion:-
Absorbance , optical energy gap , absorption coefficient , refractive Index , real dielectric constant and imaginary dielectric constant are Decreased , but
also value of the transmittance was increased with doping concentrations of thin films prepared . The type of transition observed was direct allowed transition in this work .
0 0.1 0.2 0.3 0.4 0.5 0.6
1 1.5 2 2.5 3 3.5
Im
ag
inar
y
Dielectric
(Ɛ
2
)
photon energy (eV)
0.05M 0.1M 0.15M 0.2M
pure
0.1 0.2 0.3 0.4 0.5 0.6 0.7
1 1.5 2 2.5 3 3.5
Im
ag
inar
y
Dielectric
con
stant
(Ɛ
2
)
photon energy (eV)
0.05M 0.1M 0.15M 0.2M
Refrences
[1] K . L . Chopra (1969) , "Thin Films Phenomena", M . C . Graw – Hill, NewYork [2] J . C . manifacier , M . Ddermurciq and J . P . Fillard, " Thin Solid Films ", 41(1977)
, p.127 – 135 .
[3] E . Elangoran , M . P . Singh, M . S . Dharaprakah , K . Ramamurthi , " Some physical properties of Spray doposited SnO2 Thin Films ", J . Optoelectronics and
Advanced Material , Vol . 6 , NO . 1 , (2004), P. 197- 203 .
[4] M . Gaidi , A . Hajjaji , My Ali Elkhakani . B . Chenevier , M . Metal Incorporation (pt , pd) : correlation with Microstructure chang", Japanse Journal of Applied physics , Vol . 48 , (2009) , p.(1-5)
]5] H.S.Bahidh" Optical and Structural Properties of( ZnO_ SnO2) and their Mixture
Prepared by Chemical Spray Pyrolysis “M.SC. Thesis, College of Science for Women of University of Baghdad, (2009).
[6] Bixia Lin , Zhoxi FU , Yunbo JIA , APPl phys . Lett, 79 , (2001), p.943.
[7] K . B . Sundaram and G . K . Bhagarat " Optical Absorption studies on Tin oxide Films ", J . Phys D: Appl . phys, Vol. 14 , (1981), p.(921- 925) .
[8] Mohammed – Mehdai Bagheri – Mohagheghi and Mehrded Shokooh – Sremi "Electrical , optical and Structural properties of Li – doped (SnO2) Transpanent
conducting films deposited by the spray pyrolysis Technique : a carrier – type convertion study", Institute of physics publishing seinicond – Scitechnd . 19 (2004) 764 – 769 .
[9]Warut Khamon1, Kamonchanok Rueangon1 Wisanu Pecharapa1, Jiruntanin. [10] J . Hua . Rui – Au , W . Gui – Qing , W . C . Xaebao, Vol . 17, NO.1
(2002) , P . 131 .
[11] K . L . chopra " Thin Films phenomena", Mc Graw Hill book company N . Y (1974) .