ISSN: 2250-3021 Volume 2, Issue 8 (August 2012), PP 112-119 www.iosrjen.org
www.iosrjen.org 112 | P a g e
Study of Classification Accuracy of Microarray Data for Cancer
Classification using Multivariate and Hybrid Feature Selection
Method
Sujata Dash
1, Bichitrananda Patra
2,
B.K. Tripathy
31
Department of CSE, GIFT Engineering College, Bhubaneswar, Orissa, India 2
Department of CSE, KMBB College of Engineering and Technology, Bhubaneswar, Orissa, India 3
VIT-University, Vellore, Tamilnadu, India
Abstract: Microarray analyses are becoming a powerful tool for clinical diagnosis, as they have the potential to discover gene expression patterns that are characteristic for a particular disease. This problem has received increased attention in the context of cancer research, especially in tumor classification. Various feature selection methods and classifier design strategies also have been used and compared. Feature selection is an important pre-processing method for any classification process. Selecting a useful gene subset as a classifier not only decreases the computational time and cost, but also increases classification accuracy. In this study, we applied the correlation-based feature selection method (CFS), which evaluates a subset of features by considering the individual predictive ability of each feature along with the degree of redundancy between them as a filter approach, and three wrappers (J48, Random Forest and Random Trees) to implement feature selection; selected gene subsets were used to evaluate the performance of classification. Experimental results show that by employing the proposed method fewer gene subsets are need to be selected to achieve better classification accuracy.
Keywords: - Microarrays, Hybrid Method, Filter Method, Wrapper Method, Correlation Based Feature Selection
I. Introduction
During the last decade, the motivation for applying feature selection (FS) techniques in bioinformatics has shifted from being an illustrative example to becoming a real prerequisite for model building. In particular, the high dimensional nature of many modelling tasks in bioinformatics, going from sequence analysis over microarray analysis to spectral analyses and literature mining has given rise to a wealth of feature selection
techniques being presented in the field. In contrast to other dimensionality reduction techniques like those based on projection (e.g. principal component analysis) or compression (e.g. using information theory), feature selection techniques do not alter the original representation of the variables, but merely select a subset of them. Thus, they preserve the original semantics of the variables, hence, offering the advantage of interpretability by a domain expert.
While feature selection can be applied to both supervised and unsupervised learning, we focus here on the problem of supervised learning (classification), where the class labels are known beforehand. The interesting topic of feature selection for unsupervised learning (clustering) is a more complex issue, and research into this field is recently getting more attention in several communities [32] and[33].
Typically, gene expression data possess a high dimension and a small sample size, which makes testing and training of general classification methods difficult. In general, only a relatively small number of gene expression data out of the total number of genes investigated shows a significant correlation with a certain phenotype. In other words, even though thousands of genes are usually investigated, only a very small number of these genes show a correlation with the phenotype in question. Thus, in order to analyze gene expression profiles correctly, feature selection (also called gene selection) is crucial for the classification process. Methods used for data reduction, or more specifically for feature selection in the context of microarray data analysis, can be classified into two major groups: filter and wrapper model approaches [28].
Several machine learning algorithms have already been applied to classifying tumors using microarray data. Voting machines and self-organising maps (SOM) were used to analyse acute leukemia [10]. Support vector machines (SVMs) were applied to multi-class cancer diagnosis by [21]. Hierarchical clustering was used to analyse colon tumor [1]. The best classification results are reported by Li et al.[17] and Antonov et al. [2]. Li et al [17]. employed a rule discovery method and Antonov et al.[2] maximal margin linear programming (MAMA).Given the nature of cancer microarray data, which usually consists of a few hundred samples with thousands of genes as features, the analysis has to be carried out carefully. Work in such a high dimensional space is extremely difficult if not impossible. One straightforward approach to select relevant genes is the application of standard parametric tests such as the t-test [24][25] and a nonparametric test such as the Wilcoxon score test[24][3]. Wilks’s Lambda score was proposed by [13] to access the discriminatory power of individual genes. A new procedure [2] was designed to detect groups of genes that are strongly associated with a particular cancer type.
In this paper we have applied two general approaches of feature subset selection, more specifically, wrapper and filter approaches and then created a new model called hybrid model by combining the characteristics of the two specified models for gene selection. We compared the gene selection performance of the filter model, wrapper model and hybrid model.
Wrappers and filters differ in how they evaluate feature subsets. Filter approaches remove irrelevant features according to general characteristics of the data. Wrapper approaches, by contrast, apply machine learning algorithms to feature subsets and use cross-validation to evaluate the score of feature subsets. Most methods of gene selection for microarray data analysis focus on filter approaches, although there are a few publications on applying wrapper approaches[14] [29] [28]. Nevertheless, in theory, wrappers should provide more accurate classification results than filters [15]. Wrappers use classifiers to estimate the usefulness of feature subsets. The use of ―tailor-made‖ feature subsets should provide a better classification accuracy for the corresponding classifiers, since the features are selected according to their contribution to the classification accuracy of the classifiers. The disadvantage of the wrapper approach is its computational requirement when combined with sophisticated algorithms such as support vector machines.
A common disadvantage of filter methods is that they ignore the interaction with the classifier (the search in the feature subset space is separated from the search in the hypothesis space), and that most proposed techniques are univariate. This means that each feature is considered separately, thereby ignoring feature dependencies, which may lead to worse classification performance when compared to other types of feature selection techniques. In order to overcome the problem of ignoring feature dependencies, a number of multivariate filter techniques were introduced, aiming at the incorporation of feature dependencies to some degree.
As a filter approach, correlation-based feature selection (CFS) was proposed by Hall[12]. The rationale behind this algorithm is ―a good feature subset is one that contains features highly correlated with the class, yet uncorrelated with each other.‖ It has been shown in Hall [12] that CFS gave comparable results to the wrapper and executes many times faster.
To evaluate and compare the proposed method to other feature selection methods, we used two classification algorithm namely, the K-nearest neighbour (KNN) and a Support Vector Machine (SVM) to evaluate the selected features, and to establish the influence on classification accuracy. The results indicate that in terms of the number of genes that need to be selected and classification accuracy of the proposed method is superior to other methods in the literature. The rest of this paper is organised as follows. We begin with a brief overview introducing the methods presented in Section 2. The experimental framework and settings are described in Section 3. Section 4 consists of the results and a theoretical discussion thereof. Finally, the conclusion and future work is presented in Section 5.
II. Related Methods 2.1 Feature subset selection
analysis[16]. Golub et al. [11] chose 50 genes most closely correlated with leukemia subtypes. Nevertheless, ranking genes by filters does present an overall picture of the microarray data.
In general, filters are much faster than wrappers [31]. However, as far as the final classification accuracy is concerned, wrappers normally provide better results. The general argument is that the classifier that will be built
from the feature subset should provide a better estimate of accuracy than a separate measure that may have an entirely different classification bias. The main disadvantage of wrapper approaches is that during the feature selection process, the classifier must be repeatedly called to evaluate a subset. For some computationally expensive algorithms such as SVMs or artificial neural networks, wrappers can be impractical.
2.2 The choice of filter algorithms and classifiers
2.2.1 Correlation-based feature selection
CFS evaluates a subset of features by considering the individual predictive ability of each feature along with the degree of redundancy between them [12].
where CFS S is the score of a feature subset S containing k features, ¯rcf is the average feature to class correlation (f ∈ S), and ¯rff is the average feature to feature correlation. The distinction between normal filter algorithms and CFS is that while normal filters provide scores for each feature independently, CFS presents a heuristic ―merit‖ of a feature subset and reports the best subset it finds.
2.2.2 Support Vector Machines (SVMs)
SVMs are relatively new types of classification algorithms. An SVM expects a training data set with positive and negative classes as an input (i.e. a binary labelled training data set). It then creates a decision boundary (the maximal-margin separating boundary) between the two classes and selects the most relevant examples involved in the decision process (the so-called support vectors). The construction of the linear boundary is always possible as long as the data is linearly separable. If this is not the case, SVMs can use kernels, which provide a nonlinear mapping to a higher dimensional feature space. The dot product has the following formula:
where x and y are the vectors of the gene expression data. The parameter d is an integer which decides the rough shape of a separator. In the case where d is equals to 1, a linear classification algorithm is generated, and in the case where d is more than 1, a nonlinear classification algorithm is generated. In this paper, when d is equals to 1, it is called the SVM dot product, when d is equals to 2, it is called the SVM quadratic dot product and when d is equals to 3, it is called the SVM cubic dot product. The radial basis kernel is as follows,
where σ is the median of the Euclidean distances between the members and non-members of the class. The main advantages of SVMs are that they are robust to outliers, converge quickly, and find the optimal decision boundary if the data is separable [7]. Another advantage is that the input space can be mapped into an arbitrary high dimensional working space where the linear decision boundary can be drawn. This mapping allows for higher order interactions between the examples and can also find correlations between examples. SVMs are also very flexible as they allow for a big variety of kernel functions. Sequential minimal optimization (SMO) [20]is used in this paper to train an SVM. SVMs have been shown to work well for high dimensional microarray data sets [10].However, due to the high computational cost it is not very practical to use the wrapper method to select genes for SVMs, as will be shown in our experimental results section.
2.2.3 k-nearest Neighbour
The k-nn classification algorithm is a simple algorithm based on a distance metric between the testing samples and the training samples. The main idea of the method is, given a testing sample s, and a set of training tuples T containing pairs in the form of (ti, ci) where ti’s are the expression values of gene i and ci is the class label of gene i. Find k training sample with the most similar expression value between t and s, according to a distance measure. The class label with the highest votes among the k training sample is assigned to s. The main advantage of k-nn is it has the ability to model very complex target functions by a collection of less complex approximations. It is easy to program and understand. No training or optimization is required for this algorithm. It is robust to noisy training data.
(2)
2.2.4 Decision Trees- J48, Random Forest, Random Trees
In decision tree structures, leaves represent classifications and branches represent conjunctions of features that lead to those classifications. There are advantages with decision tree algorithms: they are easily converted to a set of production rules, they can classify both categorical and numerical data, and there is no need to have a priori assumptions about the nature of the data. However multiple output attributes are not allowed in decision tree and algorithms are unstable. Slight variations in the training data can result it different attribute selections at each choice point within the tree. The effect can be significant since attribute choices affect all descendent sub-trees [27]. ID3 (Iterative Dichotomiser 3) is an algorithm used to generate a decision tree. Developed by J. Ross Quinlan [21], ID3 is based on the Concept Learning System (CLS) algorithm [19]. J48 is an improved version of ID3 algorithm. It contains several improvements, including: choosing an appropriate attribute selection measure, handling training data with missing attribute values, handling attributes with differing costs, and handling continuous attributes [21]. Random forest is another classifier that consists of many decision trees. It outputs the class that is the mode of the classes output by individual trees [6][8].
III. Experimental procedure
The experiments were performed with the Weka machine learning package [26].We used the following three general strategies to identify predictive features.
3.1 Selecting genes using CFS
a) Choose a search algorithm.
b) Perform the search, keeping track of the best subset encountered according to CFS. c) Output the best subset encountered.
3.2 Selecting genes using a wrapper method
a) Choose a machine learning algorithm to evaluate the score of a feature subset. b) Choose a search algorithm.
c) Perform the search, keeping track of the best subset encountered. d) Output the best subset encountered.
The search algorithm we used was best-first with forward selection, which starts with the empty set of genes. In this paper we report accuracy estimates for classifiers built from the best subset found during the search. Once the best subset has been determined, then a classifier evaluates the performance of the subset selected.
IV. The Proposed Hybrid Method
In this study, we hybrid the filter and wrapper model methods to select feature genes in microarrays, and used two different classification algorithms to evaluate the performance of the proposed method[18]. Figure 1 depicts the process of the hybrid filter and wrapper model feature selection method.
For example, let a microarray data set have 10 gene numbers(10 feature numbers which can be represented by f1 f2 f3 f4 f5 f6 f7 f8 f9 f10). If only 5 genes (f1, f2, f4, f7 and f10) conform to the CFS selection, only these 5 genes (f1 f2 f4 f7 f10) are used for the wrapper procedure to implement the selection process. However, when using the filter model selection, the feature number could be reduced dramatically. In order to remove more effectively unwanted features, we used wrappers namely, J48, Random Forest and Random Trees after the initial filter model selection to select features again, and then applied KNN and SVM algorithm to measure the classification performance.
V. Experimental Results and Comparison
In this section, we perform comprehensive experiments to compare the CFS-J48, CFS-Random Forest and CFS-Random Tree selection algorithm with CFS filter algorithm and the wrapper algorithms (J48, Random Forest and Random Tree) on three different datasets using two different classifiers SVM and KNN.
5.1 Datasets description and pre-processing
To evaluate the usefulness of the CFS-J48, CFS-Random Forest and CFS-Random approaches, we carried out experiments on three datasets of gene expression profiles. The datasets and their characteristics are summarized in Table 1. The data is taken from http://sdmc.lit.org.sg/GEDatasets/Datasets.html.
The Colon tumor dataset consists of 62 microarray experiments collected from colon-cancer patients with 2000 gene expression levels. Among them,40 tumor biopsies are from tumors and 22 (normal) biopsies are from healthy parts of the colons of the same patients.
The Leukemia dataset consists of 72 microarray experiments with 7129 gene expression levels. Two classes for distinguishing: Acute Myeloid Leukemia (AML) and Acute Lymphoblastic Leukemia (ALL). The complete dataset contains 25 AML and 47 ALL samples.
The Lung cancer dataset involves 181 microarray experiments with 12533 gene expression levels. Classification occurs between Malignant Pleural Mesothelioma (MPM) and Adenocarcinoma (ADCA) of the lung. In tissue samples there are 31 MPM and 150 ADCA.Table 1. Cancer related human gene expressiondatasets
Dataset # of genes # of samples # of classes # of positive samples # of negative samples
Leukemia 7129 72 2 47(ALL) 25(AML)
Lung Cancer 12533 181 2 31(MPM) 150(ADCA)
Colon Cancer 2000 62 2 22 40
Note that in these datasets, the samples in each class is generally small, and unevenly distributed. This, together with the large number of classes makes the classification task more complex. The original gene expression data are continuous values. We pre-processed the data so each gene has zero mean value and unit variance. We also discretized the data into categorical data to reduce noise.
We discretized the observations of each gene expression variable using the respective σ (standard deviation) and µ(mean) for this gene’s samples: any data larger than µ+ σ/2 were transformed to state 1; any data between µ + σ/2 and µ - σ/2 were transformed to state 0; any data smaller than µ - σ/2 were transformed to state -1. These three states correspond to the over expression, baseline, and under-expression of genes.
5.2 Parameter Settings
We used Weka, a well known comprehensive toolset for machine learning and data mining [4], as our main experimental platform. We evaluated the performance of feature selection methods in Weka environment with two classifiers, using 10-fold Cross Validation .
To evaluate the performance of the proposed method, the selected feature subsets were evaluated by K-fold cross validation (K-K-fold) for KNN and SVM classifiers. For K-K-fold cross validation, we set K=10 in this study.
During K-fold cross-validation, the data was separated into 10 parts {D1, D2 , K, D10}, and training and testing was carried out a total of 10 times. When any part Dn , n =1, 2, K, 10 is processed as a test set, the other 9 parts will be training sets. Following 10 times of training and testing, 10 classification accuracies are produced, and the averages of these 10 accuracies are used as the classification accuracy for the data set. We assumed that the obtained classification accuracy is an adaptive functional value.
5.3 Results and Comparison
We started experiment by evaluating performance accuracies of both the classifiers, SVM and KNN on the three datasets using 10-fold Cross Validation (CV) without using feature selection algorithms. The result of the 10-fold CV accuracy for the two classifiers are shown in table 5.
The experimental results show that the accuracy of microarray data which had feature selection implemented was better than without feature selection. Comparing filter and wrapper selection methods, the accuracy of the wrapper model was better than for the filter model, and the number of selected feature was smaller for the wrapper model than for the filter model which can be observed from Table 4.
The J48, Random Forest (RF) and Random Tree (RT)
wrapper models differ from the filter model in that it is dependent on a classifier and evaluates the combination of feature subsets using 10-fold CV internally. The wrapper model can identify interaction amongst all features simultaneously. However, how many gene subsets are truly necessary to identify cancer categories is still a question under debate [21].
But filter selection does not reduce the number of features very much; hence another method is needed to reduce the number of features further. In order to select more effective feature subsets, we used wrapper models namely, J48, Random Forest(RF) and Random Tree(RT) algorithms after implementing the filter approach.
Table 2. KNN Accuracy performance of three microarray data sets for the Filter, Wrapper and Hybrid feature selection method.
KNN (Statnikov et
al)[22] Filter Wrapper Hybrid
Dataset CFS J48 RF RT CFS+J48 CFS+RF CFS+
RT
Colon 87.10 95.16 82.26 82.26 85.48 87.10 82.26
Leukemia 83.57 98.61 93.06 88.89 90.28 95.83 98.61 94.44
Lung Cancer 99.45 99.45 99.45 96.13 99.45 99.45 98.43
Table 3. SVM Accuracy performance of three microarray data sets for the Filter, Wrapper and Hybrid feature selection method.
Filter Wrapper Hybrid SVM ( NO FS)
Dataset CFS J48 RF RT CFS+J48 CFS+RF CFS+RT Akadi et
al [23]
Statnikov et al[22]
Colon
Cancer 75.48 87.10 79.03 75.81 89.03 87.10 85.48 85.48
Leukemia 87.22 91.67 95.83 90.28 95.83 97.22 93.06 98.61 97.50
Lung
Cancer 95.45 99.45 97.45 96.13 100 99.24 98.34 87.67
Again, we can observed from Table 2, Table 3 and Graph-1that the proposed method effectively increases classification accuracy and selects a smaller number of feature subsets. During the wrapper phase of the proposed method, we have implemented the same wrapper model and this method returns very small sets of genes compared to alternative variable selection methods, while retaining predictive performance. Our method of gene selection will not return sets of genes that are highly correlated, because they are redundant. This method will be most useful under two scenarios:
(a) when considering the design of diagnostic tools, where having a small set of probes is often desirable; (b) to help understand the results from other gene selection approaches that return many genes, so as to
understand which ones of those genes have the largest signal to noise ratio and could be used as surrogates for complex processes involving many correlated genes. A best first search with forward direction, searches the space of attribute subsets by greedy hilclimbing augmented with a backtracking facility.
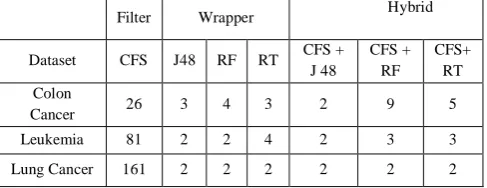
Table4. Selected feature number for the three microarray datasets using Filter, Wrapper and Hybrid feature selection method.
Filter Wrapper Hybrid
Dataset CFS J48 RF RT CFS + J 48
CFS + RF
CFS+ RT Colon
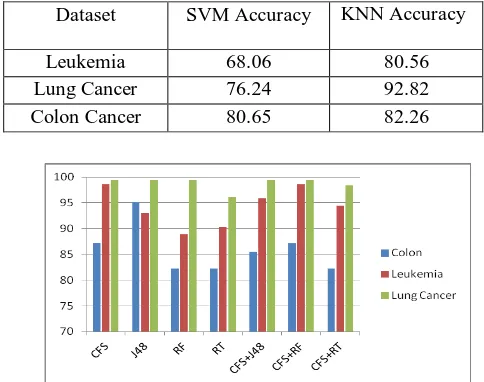
Table 5. 10-fold cross validation accuracy (%) with all features
Graph 1. Graphical Presentation of KNN Classificatio Accuracy
Graph 2. Graphical Presentation of SVM Classificatio Accuracy
The experiment showed that the combination of decision
tree wrapper model with a correlation based filter method achieves a better performance than CFS or single wrapper model.
Compared to previous works, it should be noted that without using feature selection Statnikov et al.[4] have obtained 83.57% accuracy for Leukemia dataset using KNN classifier. Whereas, our result is 80.56% without using selection method, 98.61% using CFS filter, 90.73% average classification performance of all three wrappers and 96.29% average accuracy using proposed hybrid method.
For multi class SVM with no feature selection, they obtained 2.50% error in Leukemia data classification and 2.39% by Akadi et al.,[5]. On the other hand with binary SVM classifier the rate of error of our result using CFS was 2.72%, 7.41% average error of all three wrappers and 4.67% average error of all three hybrid filter methods. For Colon dataset, our result obtained for hybrid filter CFS-J48, CFS-RF and CFS-RT were better than Akadi et al.,[5]. For Lung dataset, we obtained 100% result for J48 wrapper and CFS-J48 hybrid filter and almost 98% for rest of the methods. Whereas Akadi et al.,[5] obtained only 87.67% classification accuracy in their work.
We believe that our results will motivate more microarray practitioners to use wrappers and hybrid using CFS as their analysis tools. These machine learning algorithms are implemented in WEKA, a publicly available open-source software package. This software can be used both by experienced and novice users. WEKA has been already applied in a number of bioinformatics studies as reviewed elsewhere [9].
VI. Conclusion
In this paper, we hybrid the filter and wrapper model methods for microarray classification to implement a feature selection process, and then used KNN and SVM to evaluate the classification performance. Experimental results showed that the proposed method simplified gene selection and the total number of parameters needed effectively, thereby obtaining a higher classification accuracy compared to other feature selection methods. The classification accuracy obtained by the proposed method was comparatively higher than
Dataset SVM Accuracy KNN Accuracy
Leukemia 68.06 80.56
Lung Cancer 76.24 92.82
other methods for all three test problems. In the future, the proposed method can assist in further research where feature selection needs to be implemented. It can potentially be applied to problems in other areas as well.
References
[1] Alon, U., Barkai, N., Notterman, D., Gish, K., Ybarra, S., Mack, D., Levine, A., ― Broad patterns of gene expression revealed by clustering analysis of tumor and normal colon tissues probed by oligonucleotide arrays‖, Proc. Natl. Acad. Sci., 1999, 96 (12), 6745– 6750.
[2] Antonov, A.V., Tetko, I.V., Mader, M.T., Budczies, J., Mewes, H.W., ―Optimization models for cancer classification: extractin g gene interaction information from microarray expression data‖, Bioinformatics 20, 2004, 644–652.
[3] Antoniadis, A., Lambert-Lacroix, S., Leblanc, F., ― Effective dimension reduction methods for tumor classification using gene expression data‖, Bioinformatics 19,2003, 563–570.
[4] A. Statnikov, C.F. Aliferis, I. Tsamardinos, D. Hardin, S. Levy, ―A comprehensive evaluation of multicategory classification methods for microarray gene expression cancer diagnosis,‖ Bioinformatics, Vol. 21, 2005, No. 5, pp 631–643.
[5] A. E. Akadi, A. Amine, A. E. Ouardighi, D.Aboutajdine, , ―Feature selection for Genomic data by combining filter and wrapper approaches‖, INFOCMP Journal of computer science,2009, vol. 8, no. 4, pp. 28-36.
[6] Breiman Leo, Cutler Adele,, ―Random Forest‖, Machine Learning Conference Paper for ECE591Q,2010, 25 Apr.
[7] Brown, M. P. S., W. N. Grundy, D. Lin, N. Cristianini, C. W. Sugnet, T. S. Furey, M. Ares Jr., and D.Haussler., Knowledge -based Analysis of Microarray Gene Expression Data by Using Support Vector Machines,. Proc. Natl. Acad. Sci. USA.,1999, 97: 262-267. [8] Diaz-Uriarte R, Alvarez de Andres S,, ― Gene selection and classification of microarray data using random forest‖, BMC
Bioinformatics ,2006, 7:3.
[9] Frank E, Hall M, Trigg L, Holmes G, Witten IH: Data mining in bioinformatics using Weka. Bioinformatic 20(15),2004,:2479-2481. [10] Furey, T.S., Cristianini, N., Duffy, N., Bednarski, D.W., Schummer, M.,Haussler, D., ―Support vector machine classification a nd
validation of cancer tissue samples using microarray expression data‖, Bioinformatics 16,2000, 906–914.
[11] Golub, T., Slonim, D., Tamayo, P., Huard, C., Gaasenbeek, M., Mesirov, J.H.H.C., Loh, M., Downing, J., Caligiuri, M., Bloomfi eld, C., Lander, E., ― Molecular classification of cancer: class discovery and class prediction by gene expression monitoring‖, Science 286,1999, 531–537.
[12] Hall, M.A.,‖ Correlation-based feature selection for machine learning‖, Ph.D. Thesis. Department of Computer Science, University of Waikato, 1999.
[13] Hwang, D., Schmitt, W.A., Stephanopoulos, G., Stephanopoulos, G., ―Determination of minimum sample size and discriminatory expression patterns in microarray data‖, Bioinformatics 18,2002, 1184–1193.
[14] Inza, I., Larranaga, P., Blanco, R., Cerrolaza, A., ― Filter versus wrapper gene selection approaches in DNA microarray domains‖, Artif. Intell. Med.,2004, 31 (2), 91–103.
[15] Langley, P., ― Selection of relevant features in machine learning‖, Proceedings of AAAI Fall Symposium on Relevance,1994, pp. 140– 144.
[16] Li, W., Yang, Y., ― How many genes are needed for a discrimnant microarray data analysis. Methods of Microarray Data Analysis‖, Kluwer Academic Publishers,2002, pp. 137–150.
[17] Li, J., Liu, H., Ng, S.-K., Wong, L., Discovery of significant rules for classifying cancer diagnosis data. Bioinformatics 19,2003 93ii– 102ii.
[18] Li-Yeh Chuang, Chao-Hsuan Ke, and Cheng-Hong Yang, Member, IAENG, “A hybrid both filter and wrapper feature selection method for microarray classification”, Proceedings of the International MultiConference of Engineers and Computer Scientists ,2008,Vol I, 19-21 March, Hong Kong.
[19] Mitchell Tom M, ― Machine Learning‖, McGraw-Hill 1997.
[20] Platt, J.,‖ Fast training of support vector machines using sequential minimal optimization. Advances in Kernel Methods–Support Vector Learning‖,1998, MIT Press.
[21] Quinlan J.R.,, ―C4.5: Programs for Machine Learning‖,1993, Morgan Kaufmann Publishers.
[22] Ramaswamy, S., Tamayo, P., Rifkin, R., Mukherjee, S., Yeang, C., Angelo,M., Ladd, C., Reich, M., Latulippe, E., Mesirov, J., Poggio, T., Gerald, W., Loda, M., Lander, E., Golub, T., Multiclass cancer diagnosis using tumor gene expression signatures.,2001, Proc. Natl. Acad. Sci. 98 (26), 15149–15154.
[23] Shi et al., ― Top scoring pairs for feature selection in machine learning and applications to cancer outcome prediction‖, BMC Bioinformatics 2011,, http://www.biomedcentral.com/1471-2105/12/375.
[24] Thomas, J.G., Olson, J.M., Tapscott, S.J., Zhao, L.P. ― An efficient and robust statistical modeling approach to discover differentially expressed genes using genomic expression profiles‖, Genome Res.,2001, 11, 1227–1236.
[25] Tsai, C.-A., Chen,Y.-J., Chen, J.J., ― Testing for differentially expressed genes with microarray data‖, Nucl. Acids Res.,2003 31, e52. [26] Witten, I.H., Frank, E., ― Data Mining: Practical Machine Learning Tools and Techniques with Java Implementations‖,1999, Morgan
Kaufmann.
[27] Wang Y, Tetko IV, Hall MA, Frank E, Facius A, Mayer KF, Mewes HW:, ―Gene selection from microarray data for cancer classification--a machine learning approach‖,Comput Biol Chem , 2005,29(1):37-46.
[28] Xing, E., Jordan, M., Karp, R., ― Feature selection for high-dimensional genomic microarray data‖, Proceedings of the 18th International Conference on Machine Learning, 2001.
[29] Xiong, M., Fang, X., Zhao, J., ― Biomarker identification by feature wrapper‖, Genome Res.,2001, 11 (11), 1878–1887.
[30] Y. Saeys, I. Inza, and P. Larrañaga, ―A review of feature selection techniques in bioinformatics,‖ Bioinformatics, 23(19), 20 07, pp. 2507-2517.
[31] Y. Wang et al.,‖ Gene selection from microarray data for cancer classification—a machine learning approach‖, Computational Biology and Chemistry,2005 29 , 37–46.