S H O R T R E P O R T
Open Access
Multivariate methods and software for
association mapping in dose-response
genome-wide association studies
Chad C Brown
1,3, Tammy M Havener
2, Marisa Wong Medina
4, Ronald M Krauss
4, Howard L McLeod
2and Alison A Motsinger-Reif
1,3**Correspondence: [email protected]
1Department of Statistics, North
Carolina State University, Raleigh, NC, USA
3Bioinformatics Research Center,
North Carolina State University, Raleigh, NC, USA
Full list of author information is available at the end of the article
Abstract
Background: The large sample sizes, freedom of ethical restrictions and ease of repeated measurements make cytotoxicity assays of immortalized lymphoblastoid cell
lines a powerful newin vitromethod in pharmacogenomics research. However,
previous studies may have over-simplified the complex differences in dose-response profiles between genotypes, resulting in a loss of power.
Methods: The current study investigates four previously studied methods, plus one new method based on a multivariate analysis of variance (MANOVA) design. A simulation study was performed using differences in cancer drug response between genotypes for biologically meaningful loci. These loci also showed significance in separate genome-wide association studies. This manuscript builds upon a previous study, where differences in dose-response curves between genotypes were constructed using the hill slope equation.
Conclusion: Overall, MANOVA was found to be the most powerful method for
detecting real signals, and was also the most robust method for detection using alternatives generated with the previous simulation study. This method is also attractive because test statistics follow their expected distributions under the null hypothesis for both simulated and real data. The success of this method inspired the creation of the software program MAGWAS. MAGWAS is a computationally efficient, user-friendly, open source software tool that works on most platforms and performs GWASs for individuals having multivariate responses using standard file formats.
Keywords: Pharmacogenomics, Lymphoblastoid cell lines, Chemosensitivity, Chemotherapy, Temozolomide, Idarubicin, MANOVA, GWAS, Simulation study
Background
While genotyping technology can provide valuable individual genetic data, pharmacoge-nomics research has met little success in using this data to improve patient outcomes. This result is less surprising, considering that pharmacogenomics studies with human popu-lations often map a limiteda prioriset of targeted genes for therapeutic agents whose heritability is unknown using clinical trial data with limited sample sizes and many poten-tial confounders [1,2]. Developed in response to these limitations, a newin vitroassay system utilizing dose-response (DR) profiles of immortalized lymphoblastoid cell lines
(LCLs) allows for rapid experimental testing of multiple agents using virtually unlim-ited sample sizes, for either linkage or association at the genome-wide level [3-13]. A more thorough discussion of the practical benefits for using LCLs in pharmacogenomics research can be found in recent review articles [1,2].
However, obstacles for using LCLs to identify clinically relevant loci include elucidation of the translational relevance between donor and LCL, and the development of methods that are powerful for using DR data in gene mapping. For this second item, gene map-ping studies (such as in genome-wide association studies, or GWASs) attempt to find loci with genotypes having significantly different phenotypes. For cell models and other DR data, phenotypes are complex, and “different” is not well defined. Previous simulation studies show that the most powerful method depends on what these differences are [14]. For example, if differences in the DR curves between genotypes are due entirely to half inhibitory concentration (IC50), then summarizing each curve with it’s estimated IC50 and treating that as the response is the best course of action. However, if the true differ-ences between genotypes is not IC50, then this method may not perform optimally. We would like a method that is robust to differences in the dose-response profiles between genotypes. We would also like a method that is very powerful at detecting those kinds of differences that are likely to arise from biology. For instance, if a certain polymorphism affects the expression of an enzyme involved with inactivating a drug target, what kinds of differences in the DR profiles for LCL cytotoxicity will this polymorphism produce? Many previous studies have fit a non-linear equation (often without testing the appropriateness of this model) to each DR curve, choosing one parameter from this fit, and perform asso-ciation using this parameter estimate [3-13]. As mentioned above, the “true” differences in the DR profiles between phenotypes may not be captured by this parameter.
A previous study investigated using many different univariate summaries (such as parameter estimates from a hill slope fit) as the response in simulated association testing [14]. This study investigated the power each summary measure had in association testing, using many different simulated differences in the DR profiles between genotypes. Every summary measure performed poorly under at least one alternative. However, methods that modeled all of the responses jointly performed at least adequately (and sometimes very well) under every alternative. At question, however, is which alternative(s) is(are) most representative of the differences between in the DR profiles between genotypes for meaningful loci that are likely to be encountered in practice? To this end, the current study uses actual differences in curves between genotypes from real data for effects that have strong support for representing true biology. These differences will be referred to as
signalsthroughout. Each of these signals was created from markers that were found to be significant in genetic association studies and also had been validated from other data or from previous results. In this way, using real data to guide a simulation study, where these differences can be modeled after genuine biological signals, may give a more accurate assessment of which method performs best in practice.
Methods
Biological motivation for simulation study
located within the gene coding forO6-methylguanine-DNA methyltransferase[MGMT: ENSG00000170430]. In addition, a strong association (p=6.8∗10−26) was found between the same loci and expression levels for MGMT transcripts [15].MGMTis known to repair DNA damaged by temozolomide, and genetic variants affectingMGMT are known to be associated with temozolomide clinical efficacy [16]. Similarly, suggestive associations (p= 5.9∗10−7and ) were found between LCL cytotoxicity to 5-fluorouracil and locus
rs2270311, located within the gene coding for chimerin 2 [CHN2: ENSG00000106069]. Significant differences in the expression of CHN2 have been found between between colon cancer cells having different levels of 5-fluorouracil resistance [17].
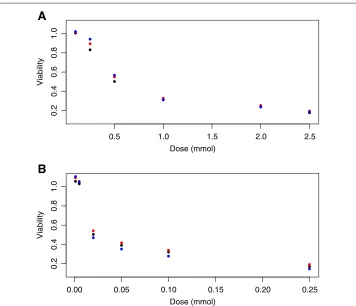
Figure 1 illustrates the differences in mean viabilities between genotypes at each con-centration for temozolomide and 5-fluorouracil. The mean viability was corrected for potentially confounding covariates by least squares regression and estimation at the sam-ple means for each covariate. These covariates include cellular growth rate, laboratory temperature, the first two genetic principal components and laboratory date (nominal). Signals are due to single nucleotide polymorphisms (SNPs), where black, red and blue circles represent genotypes for 0, 1 and 2 minor alleles, respectively.
After performing regression using the covariates mentioned above, error terms were assessed for multivariate normality. Although the error terms failed the Shapiro-Wilk test for multivariate normality (p= 2.8∗10−4for temozolomide and p= 1.4∗10−8for
0.5 1.0 1.5 2.0 2.5
0.2
0.4
0.6
0.8
1.0
A
Dose (mmol)
Viability
0.00 0.05 0.10 0.15 0.20 0.25
0.2
0.4
0.6
0.8
1.0
B
Dose (mmol)
Viability
5-fluorouracil, [18]), the goal of this simulation was to use real data as a guide in simu-lation. To this end, residuals were first transformed to be standardized and uncorrelated, according to [19]. Then histograms of errors for each drug concentration were overlaid with standard normal densities in Figures 2 and 3. In addition, Figures 4 and 5 show scat-ter plots of residuals between each pair of drug concentrations for temozolomide and 5-fluorouracil. Although the distribution of errors are definitely not normal, from these plots it appears, at least visually, that the deviations from normality (with the exception of a few outliers) are not severe.
Simulation and power comparisons of cell line methods
A simulation study was performed using the appropriate estimated means and error covariances, as described in the previous section. Using parameter estimates from these biological signals, data were generated as multivariate normal according to:
Yijk∼N6(μ˜i,)
˜
μi=μ0+ESβ1I(i=1)+β2I(i=2)
βm=μm−μ0, m∈1, 2
(1)
A
z score
Density
−2 −1 0 1 2 3 4
0.0
0.2
0.4
B
z score
Density
−2 0 2 4
0.0
0.1
0.2
0.3
0.4
C
z score
Density
−3 −2 −1 0 1 2 3
0.0
0.1
0.2
0.3
0.4
D
z score
Density
−3 −2 −1 0 1 2 3
0.0
0.1
0.2
0.3
0.4
E
z score
Density
−4 −2 0 2
0.0
0.2
0.4
F
z score
Density
−4 −3 −2 −1 0 1 2 3
0.0
0
.1
0.2
0
.3
0.4
A
z score
Density
−2 −1 0 1 2 3
0.0
0.2
0.4
B
z score
Density
−3 −2 −1 0 1 2 3
0.0
0.1
0.2
0.3
0.4
C
z score
Density
−3 −2 −1 0 1 2 3 4
0.0
0.1
0.2
0.3
0.4
D
z score
Density
−2 −1 0 1 2 3
0.0
0.1
0.2
0.3
0.4
E
z score
Density
−3 −2 −1 0 1 2 3
0.0
0
.1
0.2
0
.3
0.4
F
z score
Density
−4 −2 0 2 4
0.0
0
.2
0.4
Figure 3 Histograms for 5-fluorouracil atrs2270311.Histogram of residuals for 5-fluorouracil atrs2270311, with standard normal densities overlaid. PanelsA-Fare for transformed residuals for highest to lowest drug concentrations.
whereYijkis the vector of viabilities for six concentrations for thekthreplication of thejth individual having genotypei(the number of minor alleles). Here,is the sample covari-ance of errors,μiis the vector of mean viabilities for genotypei, andESis the effect size. Effect sizes ranged from 0 (corresponding to the null) to 1.0 (the observed differences between genotypes). The sample size was set to 500 and minor allele frequency (MAF) was set to 0.5.
A
B
C
D
E
F
G
H
I
J
K
L
M
N
O
Figure 4 Scatter plots for temozolomide atrs531572.Scatter plots of residual vectors between each pair of drug concentrations for temozolomide. PlotsA-Orepresent residuals between drug concentrations 1 and 2, 1 and 3,. . ., 5 and 6.
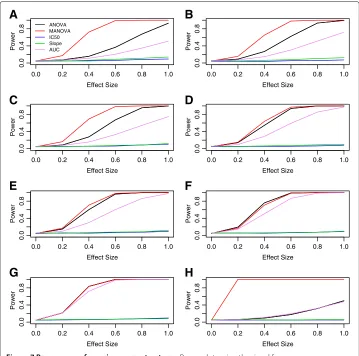
alpha = 0.05 level, are illustrated in Figure 6, where panels A and B represent the power curves for simulation using signals from temozolomide/MGMT and 5-fluorouracil/CHN2.
In addition, each of these same methods were compared using a previous simula-tion described in [14], where differences in the DR curves between genotypes are due to differences in the distribution of hill slope parameters. Figure 6 gives power curves for a representative sample of these simulations, where data were simulated under an additive genetic model, with equally spaced drug dosages and a MAF of 0.5. Panels
A F K
B G L
C H M
D I N
E J O
Figure 5 Scatter plots for 5-fluorouracil atrs2270311.Scatter plots of residual vectors between each pair of drug concentrations for 5-fluorouracil. PlotsA-Orepresent residuals between drug concentrations 1 and 2, 1 and 3,. . ., 5 and 6.
Using the Friedman test, significant differences (p < 10−15 for all) in p-values were found between methods for every positive (i.e. non-null) effect size for both sets of simulations.
0.0 0.2 0.4 0.6 0.8 1.0
0.0
0.2
0.4
0.6
0.8
1.0
A
Effect Size
Power
ANOVA MANOVA IC50 Slope AUC
0.0 0.2 0.4 0.6 0.8 1.0
0.0
0.2
0.4
0.6
0.8
1.0
B
Effect Size
Power
0.0 0.1 0.2 0.3 0.4 0.5
0.0
0.2
0.4
0.6
0.8
1.0
C
Effect Size
Power
0.0 0.1 0.2 0.3 0.4 0.5
0.0
0.2
0.4
0.6
0.8
1.0
D
Effect Size
Power
0.0 0.1 0.2 0.3 0.4 0.5
0.0
0
.2
0.4
0.6
0
.8
1.0
E
Effect Size
Power
Figure 6 Power curves for real and contrived alternatives.PanelsAandBare real signals based on LCL response to temozolomide atrs531572(within the gene MGMT) and 5-fluorouracil atrs2270311(located within the gene CHN2), respectively. PanelsC,DandEare for differences between genotypes being due to the hill slope parameters, “Min”, “IC50” and “Slope” from [14].
independently, but using a centered gamma distribution with parameters shape=8 and scale=0.125. The results for each of these simulations is shown in Figure 7.
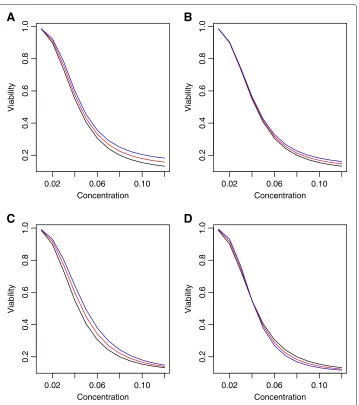
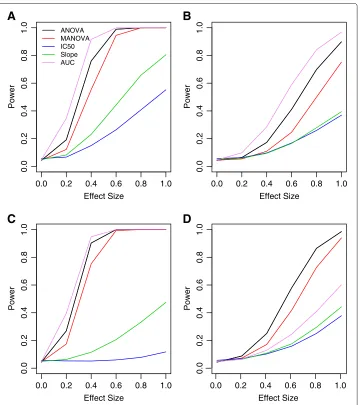
Finally, simulations were performed to assess the strength of MANOVA with data gen-erated using multivariate normal, but under non-ideal situations. For these, mean vectors and covariances were constructed from 12 equally-spaced doses. The difference in mean vectors between genotypes were designed to follow a specific univariate summary, includ-ing area under the curve, and the hill slope parameters “Min”, “IC50” and “Slope”, as illustrated in Figure 8. Using these mean vectors, simulations were performed where error terms follow an exponential decay correlation structure, withρ=0.25. Power plots from these simulations are illustrated in Figure 9.
Results and discussion
0.0 0.2 0.4 0.6 0.8 1.0 0.0 0.4 0.8
A
Effect Size Power ANOVA MANOVA IC50 Slope AUC0.0 0.2 0.4 0.6 0.8 1.0
0.0 0.4 0.8
C
Effect Size Power0.0 0.2 0.4 0.6 0.8 1.0
0.0 0.4 0 .8
E
Effect Size Power0.0 0.2 0.4 0.6 0.8 1.0
0.0 0.4 0 .8
G
Effect Size Power0.0 0.2 0.4 0.6 0.8 1.0
0.0 0.4 0.8
B
Effect Size Power0.0 0.2 0.4 0.6 0.8 1.0
0.0 0.4 0.8
D
Effect Size Power0.0 0.2 0.4 0.6 0.8 1.0
0.0 0 .4 0.8
F
Effect Size Power0.0 0.2 0.4 0.6 0.8 1.0
0.0 0 .4 0.8
H
Effect Size PowerFigure 7 Power curves for various error structures.Power plots using the signal from
temozolomide/MGMT with different error structures are shown in all panels. PanelsA,CandEare under equal correlation withρ=0.75, 0.5 and 0.25, respectively. PanelsB,DandFare under exponential correlation withρ=0.75, 0.5 and 0.25, respectively. PanelsGandHhad error terms generated independently as normal and gamma, respectively.
0.02 0.06 0.10
0.2
0.4
0.6
0.8
1.0
A
Concentration
Viability
0.02 0.06 0.10
0.2
0.4
0.6
0.8
1.0
B
Concentration
Viability
0.02 0.06 0.10
0.2
0.4
0.6
0.8
1.0
C
Concentration
Viability
0.02 0.06 0.10
0.2
0.4
0.6
0.8
1.0
D
Concentration
Viability
Figure 8 Dose response curves for used for non-ideal conditions.Dose response curves used for generating data that are not ideal for MANOVA, where differences between genotypes are designed to follow univariate summary statistics. PanelArepresents area under the curve and panelsB-Dare for the hill slope parameters “Min”, “IC50” and “Slope”, respectively.
are due entirely to a simple summary measure. These ideas are illustrated in Figures 8 and 9, where data are generated for large (12) vector responses, correlations are low (ρ=0.25) and differences in the DR curves between genotypes can be summarized well using sim-ple summary measures. In this case, the MANOVA method does not perform optimally, even though data are generated using a multivariate normal model.
0.0 0.2 0.4 0.6 0.8 1.0
0.0
0.2
0.4
0.6
0.8
1.0
A
Effect Size
Power
ANOVA MANOVA IC50 Slope AUC
0.0 0.2 0.4 0.6 0.8 1.0
0.0
0.2
0.4
0.6
0.8
1.0
B
Effect Size
Power
0.0 0.2 0.4 0.6 0.8 1.0
0.0
0.2
0.4
0.6
0.8
1.0
C
Effect Size
Power
0.0 0.2 0.4 0.6 0.8 1.0
0.0
0.2
0.4
0.6
0.8
1.0
D
Effect Size
Power
Figure 9 Power curves for non-ideal conditions.Shown are power curves for data generated using the DR curves from Figure 8, using an exponential decay correlation structure withρ=0.25. PanelsA-Dare for area under the curve, “Min”, “IC50” and “Slope” parameters, respectively.
in Figure 6. In addition, the advantage of MANOVA is actually increased over the other methods for the temozolomide/MGMT signal when the distribution of the error terms change from multivariate normal to gamma. These results need to be cautioned, how-ever, because allp-values were generated using resampling techniques, described in [14]. When compared to their expected distributions, MANOVA test statistics generated from the hill slope-type simulations are well-behaved, but the same test statistics generated with gamma distributed error terms behave quite poorly (Figure 10). This latter case would lead to inflated type-I error rates, ifp-values are calculated using the expected null asymptotic distribution.
Software implementing MANOVA in GWASs: Introducing MAGWAS
0.0 0.5 1.0 1.5 2.0 2.5 3.0
0.0
0.5
1.0
1.5
2.0
2.5
3.0
3.5
A
Observed quantiles
Theoretical quantiles
0.0 0.5 1.0 1.5 2.0 2.5 3.0
0.0
0.5
1.0
1.5
2.0
2.5
3.0
3.5
B
Observed quantiles
Theoretical quantiles
0.0 0.5 1.0 1.5 2.0 2.5 3.0
0.0
0.5
1.0
1.5
2.0
2.5
3.0
3.5
C
Observed quantiles
Theoretical quantiles
28 29 30 31 32
0.0
0.5
1.0
1.5
2.0
2.5
3.0
3.5
D
Observed quantiles
Theoretical quantiles
Figure 10 MANOVA test statistic QQ plots.Shown are QQ plots of MANOVA test statistics generated under the null, based on temozolomide/MGMT (panelA), 5-fluorouracil/CHN2 (panelB), random hill slope curves from a previously reported simulation (panelC) [14], and error structures following a gamma distribution (panelD).
accomplished using the Java package JAMA [24] and distributional calculations are made using the Java package DistLib [25].
Conclusions
In conclusion, no method is uniformly superior for modeling the genetic effects for DR cell line data. However, unlike other univariate summary methods (such as estimating the IC50 for each DR curve and treating this estimate as the response), MANOVA makes no assumption about the nature of the DR curve or about what the differences in the DR curves between genotypes are expected to be. Unsurprisingly, using simulated data from a previous study, MANOVA was the only method that had good power under all alternatives considered. In addition, MANOVA was most powerful in detecting differ-ences between genotypes for simulations based on signals obtained from real data. A final advantage of using MANOVA is that test statistics asymptotically follow a known distri-bution under the null, allowing for fast and accurate analysis of each loci in a GWAS, so long as sample sizes are not small. Quantile-quantile (QQ) plots of the null distributions of test statistics from this study, as well as the null for the previous simulation, demon-strate that the type I error rate is under control in all conditions, except when data are generated using a gamma distribution for the error structure. Figure 10 shows four repre-sentative examples of these QQ plots. Under the assumption that most loci have no true association in genome-wide data, a similar result was found for QQ plots from a sepa-rate set of GWASs (results not shown) involving LCL response to 29 different anticancer drugs.
On the other hand, MANOVA is not guaranteed to always be optimal, especially if the number of responses for each individual is large, the correlations between responses are small, and/or the true differences in DR curves between genotypes are known to be due to entirely to single univariate summary measure. Also, the interpretation for MANOVA is somewhat more complicated, as traditional measures of effect size, such as model r-squared (R2) and parameter estimates are not immediately clear. For example, R2 may vary substantially between responses at each concentration. Similarly, parameter esti-mates for the effect of SNP are unlikely to be the same, and may even have opposite directions, at different concentrations. Overall, we feel the benefits outweigh the handi-caps and that MANOVA is a great method for gene mapping, or other association tests utilizing DR data.
Abbreviations
DR: dose response; LCL: lymphoblastoid cell line; GWAS: genome-wide association study; QQ: quantile-quantile; ANOVA: analysis of variance; MANOVA: multivariate ANOVA; MAF: minor allele frequency.
Competing interests
The authors declare that they have no competing interests.
Authors’ contributions
CCB wrote the manuscript, performed all analysis and created magwas software. TMH collected LCL data. MWM and RMK provided and performed genotyping for the Epstein-Barr virus immortalized LCLs. HLM revised the manuscript and designed the original linkage and association studies. AAM revised the manuscript and helped design the simulation and real data experiments. All authors read and approved the final manuscript.
Acknowledgements
This work was supported by NIH NCI R01CA161608 and T32GM081057 from the National Institute of General Medical Sciences and the National Institute of Health. Kevin Long, Director, PharmacoInformatics, UNC IPIT, helped with testing MAGWAS. Some parts of this manuscript were taken from a recent technical report [21].
Author details
1Department of Statistics, North Carolina State University, Raleigh, NC, USA.2Institute for Pharmacogenomics and
Individualized Therapy, University of North Carolina at Chapel Hill, Chapel Hill, NC, USA.3Bioinformatics Research Center,
North Carolina State University, Raleigh, NC, USA.4Children’s Hospital Oakland Research Institute, Oakland, CA 94609, USA.
Received: 3 April 2012 Accepted: 4 December 2012 Published: 12 December 2012
References
1. Wheeler H, Dolan M:Lymphoblastoid cell lines in pharmacogenomic discovery and clinical translation.
Pharmacogenomics2012,13:55–70.
2. Welsh M, Mangravite L, Medina M, Tantisira K, Zhang W, Huang R, McLeod H, Dolan M:Pharmacogenomic discovery using cell-based models.Pharmacological rev2009,61(4):413–429.
3. Watters JW, Kraja A, Meucci MA, Province MA, McLeod HL:Genome-wide discovery of loci influencing chemotherapy cytotoxicity.Proc Natl Acad Sci USA2004,101:11809–11814.
4. Huang R, Duan S, Bleibel W, Kistner E, Zhang W, Clark T, Chen T, Schweitzer A, Blume J, Cox N, et al.:A genome-wide approach to identify genetic variants that contribute to etoposide-induced cytotoxicity.Proc National Acad Sci2007,104(23):9758.
5. Dolan M, Newbold K, Nagasubramanian R, Wu X, Ratain M, Cook E, Badner J:Heritability and linkage analysis of sensitivity to cisplatin-induced cytotoxicity.Cancer res2004,64(12):4353.
6. Bleibel W, Duan S, Huang R, Kistner E, Shukla S, Wu X, Badner J, Dolan M:Identification of genomic regions contributing to etoposide-induced cytotoxicity.Human genet2009,125(2):173–180.
7. Watson VG, Motsinger-Reif A, Hardison NE, Peters EJ, Havener TM, Everitt L, Auman JT, Comins DL, McLeod HL:
Identification and Replication of Loci Involved in Camptothecin-Induced Cytotoxicity Using CEPH Pedigrees.PLoS ONE2011,6:e17561.
8. Peters EJ, Kraja AT, Lin SJ, Yen-Revollo JL, Marsh S, Province MA, McLeod HL:Association of thymidylate synthase variants with 5-fluorouracil cytotoxicity.Pharmacogenet Genomics2009,19:399–401.
9. Peters E, Motsinger-Reif A, Havener T, Everitt L, Hardison N, Watson V, Wagner M, Richards K, Province M, McLeod H:
Pharmacogenomic characterization of US FDA-approved cytotoxic drugs.Pharmacogenomics2011,
12(10):1407–1415.
10. Watson V, Hardison N, Harris T, Motsinger-Reif A, McLeod H:Genomic Profiling in CEPH cell lines distinguishes between the Camptothecins and Indenoisoquinolines.Mol Cancer Ther2011,10(10):1839–1845.
11. Duan S, Huang R, Zhang W, Mi S, Bleibel W, Kistner E, Cox N, Dolan M:Expression and alternative splicing of folate pathway genes in HapMap lymphoblastoid cell lines.Pharmacogenomics2009,10(4):549–563. 12. Gamazon E, Duan S, Zhang W, Huang R, Kistner E, Dolan M, Cox N:PACdb: a database for cell-based
pharmacogenomics.Pharmacogenetics and genomics2010,20(4):269.
13. Stark AL, Zhang W, Mi S, Duan S, O’Donnell PH, Huang RS, Dolan ME:Heritable and non-genetic factors as variables of pharmacologic phenotypes in lymphoblastoid cell lines.Pharmacogenomics J2010,10:505–512. 14. Brown C, Havener T, Everitt L, McLeod H, Motsinger-Reif A:A comparison of association methods for cytotoxicity
mapping in pharmacogenomics.Frontiers in Stat Genet And Methodology2012,2:1–14.
15. Brown CC, Havener TM, Medina MW, Mangravite L, Kraus RM, McLeod H, Motsinger-Reif A:A genome-wide association analysis of temozolomide response using lymphoblastoid cell lines reveals a clinically relevant association with MGMT.Pharmacogenetics and Genomics2012,22(11):796–802.
16. Hegi M, Liu L, Herman J, Stupp R, Wick W, Weller M, Mehta M, Gilbert M:Correlation of O6-methylguanine methyltransferase (MGMT) promoter methylation with clinical outcomes in glioblastoma and clinical strategies to modulate MGMT activity.J Clinical Oncol2008,26(25):4189–4199.
17. Schmidt W, Kalipciyan M, Dornstauder E, Rizovski B, Steger G, Sedivy R, Mueller M, Mader R:Dissecting progressive stages of 5-fluorouracil resistance in vitro using RNA expression profiling.Int j cancer2004,112(2):200–212. 18. Jarek S:mvnormtest: Normality test for multivariate variables; 2009. [R package version 0.1-7].
20. Timm N:Applied multivariate analysis. 175 Fifth Avenue, New York, NY 10010, USA: Springer Verlag New York, Inc.; 2002.
21. Brown C, Motsinger-Reif A:Software for genome-wide association studies having multivariate responses: Introducing MAGWAS.NC State Department Stat Tech R2012:1–9.
22. Purcell S, Neale B, Todd-Brown K, Thomas L, Ferreira M, Bender D, Maller J, Sklar P, De Bakker P, Daly M, et al.:PLINK: a tool set for whole-genome association and population-based linkage analyses.The Am J Human Genet2007,
81(3):559–575.
23. Purcell S:PLINK v1.07; 2009. [Http://pngu.mgh.harvard.edu/purcell/plink/]
24. Hicklin J, Moler C, Webb P, Boisvert RF, Miller B, Pozo R, Remington K:JAMA v1.0.2; 2011. [Http://math.nist.gov/ javanumerics/jama/]
25. Steinmetz PN, Warnes G, Warnes J:DistLib v0.9.1; 2007. [Http://statdistlib.sourceforge.net/]
26. Molenberghs G, Verbeke G:Models for discrete longitudinal data. 233 Spring Street, New York, NY 10013, USA: Springer Science+Business Media, Inc.; 2006.
27. Wu S, Fu G, Chen Y, Wang Z, Wu R:Genetic mapping of complex traits by minimizing integrated square errors.
BMC genet2012,13:20.
28. Wu S, Yang J, Wu R:Semiparametric functional mapping of quantitative trait loci governing long-term HIV dynamics.Bioinformatics2007,23(13):i569—i576.
29. Yang J, Wu R, Casella G:Nonparametric functional mapping of quantitative trait loci.Biometrics2008,65:30–39. doi:10.1186/1756-0381-5-21
Cite this article as:Brownet al.:Multivariate methods and software for association mapping in dose-response genome-wide association studies.BioData Mining20125:21.
Submit your next manuscript to BioMed Central and take full advantage of:
• Convenient online submission
• Thorough peer review
• No space constraints or color figure charges • Immediate publication on acceptance
• Inclusion in PubMed, CAS, Scopus and Google Scholar • Research which is freely available for redistribution


![Figure 10 MANOVA test statistic QQ plots. Shown are QQ plots of MANOVA test statistics generated underfrom a previously reported simulation (panel(panelthe null, based on temozolomide/MGMT (panel A), 5-fluorouracil/CHN2 (panel B), random hill slope curves C) [14], and error structures following a gamma distribution D).](https://thumb-us.123doks.com/thumbv2/123dok_us/362351.1528823/12.595.119.476.86.488/statistic-statistics-previously-simulation-temozolomide-fluorouracil-structures-distribution.webp)
