R E S E A R C H
Open Access
Comprehensive behavioral study of mGluR3
knockout mice: implication in schizophrenia
related endophenotypes
Ryuta Fujioka
1†, Takenobu Nii
1†, Akiko Iwaki
1, Atsushi Shibata
1, Isao Ito
2, Kiyoyuki Kitaichi
3,4, Masatoshi Nomura
5,
Satoko Hattori
6,7, Keizo Takao
7,8, Tsuyoshi Miyakawa
6,7,8and Yasuyuki Fukumaki
1*Abstract
Background:We previously performed systematic association studies of glutamate receptor gene family members with schizophrenia, and found positive associations of polymorphisms in theGRM3(a gene of metabotropic glutamate receptor 3: mGluR3) with the disorder. Physiological roles ofGRM3in brain functions and its functional roles in the pathogenesis of schizophrenia remain to be resolved.
Results:We generated mGluR3 knockout (KO) mice and conducted comprehensive behavioral analyses. KO mice showed hyperactivity in the open field, light/dark transition, and 24-hour home cage monitoring tests, impaired reference memory for stressful events in the Porsolt forced swim test, impaired contextual memory in cued and contextual fear conditioning test, and impaired working memory in the T-Maze forced alternation task test. Hyperactivity and impaired working memory are known as endophenotypes of schizophrenia. We examined long-term synaptic plasticity by assessing long-term potentiation (LTP) in the CA1 region in the hippocampi of KO and wild-type (WT) mice. We observed no differences in the amplitude of LTP between the two genotypes, suggesting that mGluR3 is not essential for LTP in the CA1 region of the mouse hippocampus. As hyperactivity is typically associated with increased dopaminergic transmission, we performedin vivomicrodialysis measurements of extracellular dopamine in the nucleus accumbens of KO and WT mice. We observed enhancements in the
methamphetamine (MAP)-induced release of dopamine in KO mice.
Conclusions:These results demonstrate that a disturbance in the glutamate-dopamine interaction may be involved in the pathophysiology of schizophrenia-like behavior, such as hyperactivity in mGluR3 KO mice.
Keywords:Metabotropic glutamate receptors,Grm3, Knockout mice, Working memory, Reference memory, Contextual memory, Hyperactivity, LTP, Microdialysis, Schizophrenia
Background
Glutamate receptors play central roles in neuronal excita-tion in the mammalian central nervous system. Glutamate receptors have been categorized into two classes: iono-tropic glutamate receptors and metaboiono-tropic glutamate receptors (mGluRs) [1]. mGluRs are G protein-coupled re-ceptors and consist of eight different subtypes that have been subdivided into three groups (I–III) based on their sequence homology [2]. mGluR3 and mGluR2 have been
classified as group II mGluRs due to their sequence hom-ology and shared signal propagation mechanism [3-5]. mGluR2 is expressed in neuronal cells, whereas mGluR3 is distributed in both neuronal and glial cells. Group II mGluRs play an important role in synaptic plasticity, in-cluding the regulation of LTP [6]. An inhibitory effect of mGluR3 on LTP was observed in the rat dentate gyrus [7,8]. These events mainly occur in presynaptic sites, through their inhibition of glutamate release [9]. Group II mGluRs function as heteroceptors, regulating the release of other neurotransmitters, including dopamine [5,9]. Since mGluR2/3 activation leads to a net reduction in glu-tamate neurotransmission, the ligands for these receptors * Correspondence:[email protected]
†Equal contributors 1
Division of Human Molecular Genetics, Research Center for Genetic Information, Medical Institute of Bioregulation, Fukuoka 812-8582, Japan Full list of author information is available at the end of the article
may be potential therapeutic agents for a wide range of psychiatric disorders [10]. Phencyclidine (PCP), an antag-onist of the N-methyl-D-aspartate (NMDA) receptor of glutamate receptor, induces schizophrenic symptoms in humans [11]. The psychotic effect induced by PCP is at-tenuated by administration of agonists specific to mGluR2 and mGluR3 [12]. We, therefore, previously conducted systematic studies on the association of glutamate receptor genes with schizophrenia. We found a positive association between single nucleotide polymorphisms (SNPs) located
in GRM3 and schizophrenia in the Japanese population
[13]. Four subsequent studies also showed the positive
association between SNPs located in GRM3 and
schizo-phrenia [14-17], although negative results were reported [18-20]. Resequencing of all exons and splice sites of
GRM3of schizophrenia patients revealed no missense or
splice-site SNPs, suggesting that intronic SNPs located in
GRM3 or related haplotypes may affect subtle regulatory
effects on GRM3 transcription [14]. To explore the
physiological roles of GRM3 in brain functions and its
functional roles in the pathogenesis of schizophrenia, we
generated Grm3 knockout (KO) mice and conducted
comprehensive behavior tests, electrophysiological, and pharmaco-physiological analyses.
Results
Generation of mGluR3 KO mice
To generate mGluR3 KO mice, three fragments
corre-sponding to theGrm3exon 4 region encoding the
trans-membrane domain, and the 5′and 3′arms were cloned
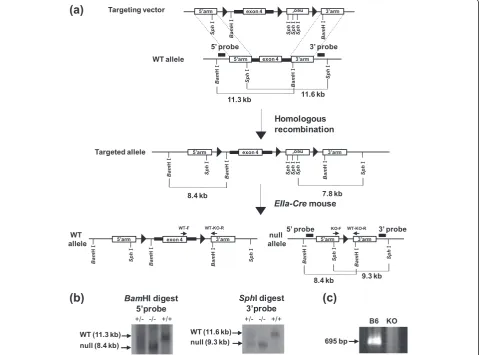
and inserted into the targeting vector pflox, that carried a neorcassette and threeloxPsites (Figure 1a).
Homolo-gous recombination at the Grm3locus in the mouse ES
cells electroporated with the mGluR3 targeting vector was confirmed by Southern blot analysis (data not shown). The chimeric mice generated by the injection of
Figure 1Generation and validation of mGluR3 KO mice. (a)WT and KO alleles: Closed boxes indicate the approximate positions of the 5′and 3′probes. The closed triangle indicates theloxPsequence.(b)Southern blots ofBamH I andSphI-digested genomic DNA were hybridized with the 5′probe and 3′probe shown in(a), respectively. The DNA bands indicated by the arrows correspond to theBamH I andSphI-fragments.
(d)
30 60 90 120
0
200
400
600
800
1000
1200
1400
1600
Total Distance (cm)
Time (min)
p = 0.0457
30 60 90 120
0
20
40
60
80
100
120
Center Time (sec)
Time (min)
p = 0.3514
30 60 90 120
0
200
400
600
800
1000
1200
1400
1600
Stereotypic Counts
Time (min)
p = 0.2283
Light
Dark
0
500
1000
1500
)
m
c(
d
el
e
v
ar
T
e
c
n
at
si
D
p = 0.704 p = 0.0161
0
50
100
150
200
250
)
c
e
s(
t
h
gi
L
ni
e
mi
T
y
at
S
p = 0.5121
0
10
20
30
40
Transitions
p = 0.1967
0
10
20
30
40
50
60
70
Latency to Light (sec)
p = 0.1082
WT (n = 20)
KO (n = 20)
WT (n = 19)
KO (n = 20)
30 60 90 120
0
20
40
60
80
100
Vertical Activity
Time (min)
p = 0.1454 p = 0.0421
min 0-30
p = 0.0643 min 0-60
min 0-120
(a)
(b)
(c)
(e)
(f)
(h)
(g)
p = 0.351
p = 0.512
p = 0.197 p = 0.108
p = 0.145
correctly targeted ES cells into C57BL/6J blastocysts
were crossed with C57BL/6 mice to obtain Grm3targ/+
offspring. Mice carrying the targeted allele were mated withEIIa-CreTg/0 mice to removeGrm3 exon 4 and the
neor gene. The resultant Grm3null/+ mice were
inter-crossed to obtainGrm3null/nullmice after backcross with
C57BL/6 mice. The Grm3null/null mice showed the
8.4 kb-BamH I fragment on the 5′probe and the 9.3
kb-Sph I fragment on the 3′ probe by Southern blotting
(Figure 1b). Targeted disruption of the mGluR3 gene was also confirmed by RT-PCR of brain RNA from these mice (Figure 1c).
Normal general characteristics of mGluR3 KO mice
A behavioral test battery was conducted as described previously [21,22]. There were no abnormalities evident in the physical aspects of mGluR3 KO mice, including reproductive capability. mGluR3 KO mice appeared to be normal and healthy, but mGluR3 KO mice weighed ~1.5 g less than WT littermates (Additional file 1: Figure S1a, Student’s t-test, genotype effect, t37= 2.59, p= 0.0134). The body temperature, grip strength and wire hanging time of mGluR3 KO mice were normal (Additional file 1: Figure S1b-d).
Hyper locomotor activity of mGluR3 KO mice
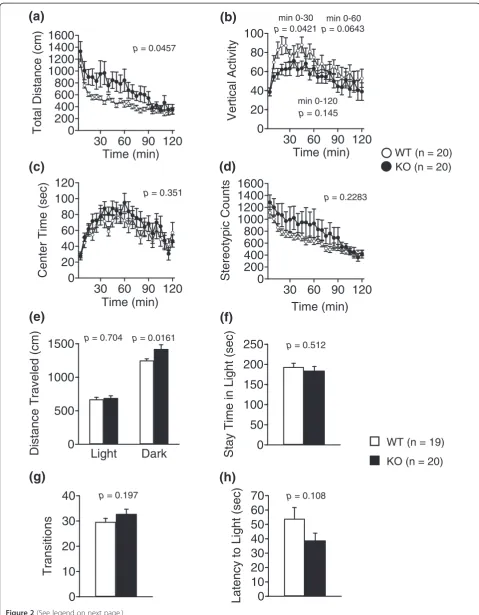
Locomotor activity was examined in the open field (Figure 2a-d), light/dark transition (Figure 2e-h), 24-hour home cage monitoring (Figure 3), t-maze forced alterna-tion task (Figure 4), elevated plus maze (Addialterna-tional file 2: Figure S2), and social interaction tests (Additional file 3: Figure S3). mGluR3 KO mice traveled significantly longer distances in the open field test (Figure 2a, two-way
re-peated measures ANOVA, genotype effect, 0–120
mi-nutes, F1,38= 4.27,p= 0.0457), in the dark compartment in the light/dark transition test (Figure 2e, Student’s t-test, genotype effect, t37=−2.52, p= 0.0161), and in the 24-hour home cage monitoring test (Figure 3b, two-way
repeated measures ANOVA, genotype effect, F1,16= 5.54,
p= 0.0317) than those of WT mice. In contrast, decreased vertical activity was observed in mGluR3 KO mice in the open field test, especially at 0–30 minutes (Figure 2b,
two-way repeated measures ANOVA, genotype effect, 0–30
minutes, F1,38= 4.42, p= 0.0421). A significant difference was not observed in perseverative motor behavior in the stereotypic behavior of the open field test (Figure 2d).
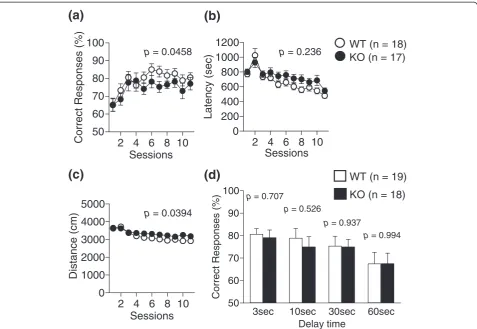
There was no significant difference in locomotor activity in the elevated plus maze (Additional file 2: Figure S2c), social interaction tests (Additional file 3: Figure S3e) and gait analysis (Additional file 4: Figure S4). T-maze forced alternation task test showed that distance traveled was significantly increased in KO mice (Figure 4c, two-way
repeated measures ANOVA, genotype effect, F1,33= 4.60,
p= 0.0394), whereas the latency time was not different be-tween the two genotypes (Figure 4b). Anxiety-like behav-iors were examined in the light/dark transition, elevated plus maze and time spent in the center time of open field tests. There were no significant differences in these tests except for the distance traveled in the dark compartment in the light/dark transition test (Figure 2c, 2e-h), which in-dicated no difference in anxiety-like behaviors between the two genotypes.
No impairment in social behavior of mGluR3 KO mice
Social behavior was examined in the 24-hour home cage monitoring test and in the social interaction test in a novel environment. There was no significant difference in the mean number of particles in the 24-hour home cage monitoring for 1 week (Figure 3a), and in all pa-rameters of the social interaction test in a novel environ-ment (Additional file 3: Figure S3).
No impairment in prepulse inhibition of mGluR3 KO mice
The prepulse inhibition (PPI) test has been widely used to measure deficits in information-processing abilities or sensorimotor gating in schizophrenic patients [23], and can be employed in both human and animal experi-ments [24]. The PPI is defined as the degree (%) to which the acoustic startle response is reduced when the startle-eliciting stimulus is preceded by a brief, low-intensity, non-eliciting stimulus. There was no signifi-cant difference in the PPI test between the two geno-types (Additional file 5: Figure S5).
Impaired reference and working memories of mGluR3 KO mice
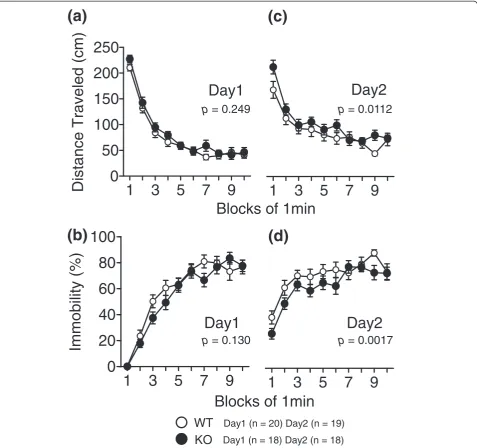
In the Porsolt forced swim test, there was no significant difference between the two genotypes in the first trial (Figure 5a and b), indicating that mGluR3 KO mice did not show the depression-related behavior. However, mGluR3 KO mice traveled a greater distance (Figure 5c, two-way repeated measures ANOVA, genotype effect,
(See figure on previous page.)
F1,35= 7.18,p= 0.0112) and showed lower immobility in the second trial, (Figure 5d, two-way repeated measures
ANOVA, genotype effect, F1,35= 11.6, p= 0.0017),
sug-gesting that mGluR3 KO mice remembered the previous event less than WT mice. We analyzed the ratio of total distance traveled in each genotype (Day1 vs. Day2,
re-spectively, Mann–Whitney U-test) and found that the
ratio of total distance traveled was significantly increased
in mGluR3 KO mice (p= 0.0449). These findings suggest
that mGluR3 KO mice may have impaired reference memory for stressful events. Alternatively there is a pos-sibility that depression-related behavior was simply de-creased in mGluR3 KO mice on Day2. In the T-maze forced alternation task for working memory, mGluR3 KO mice had a significantly lower correct response than WT mice (Figure 4a, two-way repeated measures ANOVA for session 1–11, genotype effect, F1,33= 4.31,p= 0.0458). To increase the difficulty of the task, a delay period (3, 10, 30, 60 seconds) was applied. Under these conditions, there was no significant difference in the percentage of the cor-rect response between KO and WT mice (Figure 4d). These results suggested that working memory was slightly impaired in mGluR3 KO mice. However, there is also a possibility of impairment in reinforcement learning or procedural learning in the KO mice. There was no signifi-cant difference in spatial memory between KO and WT mice in the Barnes maze test (Additional file 6: Figure S6).
Affected fear memory in mGluR3 KO mice
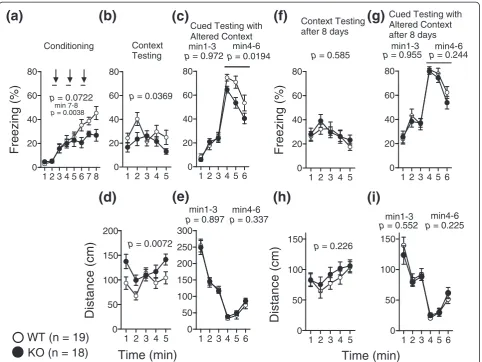
The cognitive functions of KO and WT mice were examined in a cued and contextual fear conditioning test. Twenty-four hours after the conditioning session (Figure 6a), mGluR3 KO mice showed decreased levels of freezing during context testing (Figure 6b, two-way
re-peated measures ANOVA, genotype effect, F1,35= 4.71,
p= 0.0369; Figure 6d, two-way repeated measures ANOVA,
genotype effect, F1,35= 8.13, p= 0.0072) and cued testing with altered context testing at 4–6 minutes (Figure 6c, two-way repeated measures ANOVA, genotype effect, with tone, F1,35= 6.00, p= 0.0194), although the distance was unaltered in mGluR3 KO mice in cued testing with al-tered context (Figure 6e). mGluR3 KO mice responded differently to the conditioning condition (Figure 6a, 7–8 min, p= 0.0038), suggesting that freezing level is simply decreasing in mGluR3 KO mice during sessions. There were no significant differences between KO and WT mice in the context and cued test with altered context 8 days after conditioning (Figure 6f-i). There was also no signifi-cant difference in fear memory between KO and WT mice in the passive avoidance test (Additional file 7: Figure S7). In the hot plate test, there was no significant difference be-tween the two genotypes in the latency time (Additional file 8: Figure S8). These results suggested that contextual memory of stressful event, but not sensitivity to the stress may be affected in mGluR3 KO mice.
(a)
(b)
11.2 1.4 1.6 1.8 2
0 200000 400000 600000 800000 1000000
WT (n = 9) KO (n = 9) p = 0.0317
p = 0.8561
Activity Level (Arbitrary Uni
t)
Mean Number of Particles
Day p = 0.0808
Night p = 0.7024
Day p = 0.9465
Night p = 0.0232
p = 0.856
Day p = 0.0808
Night p = 0.702
Day p = 0.947
Night p = 0.0232
p = 0.0317
Normal LTP of hippocampus of mGluR3 KO mice
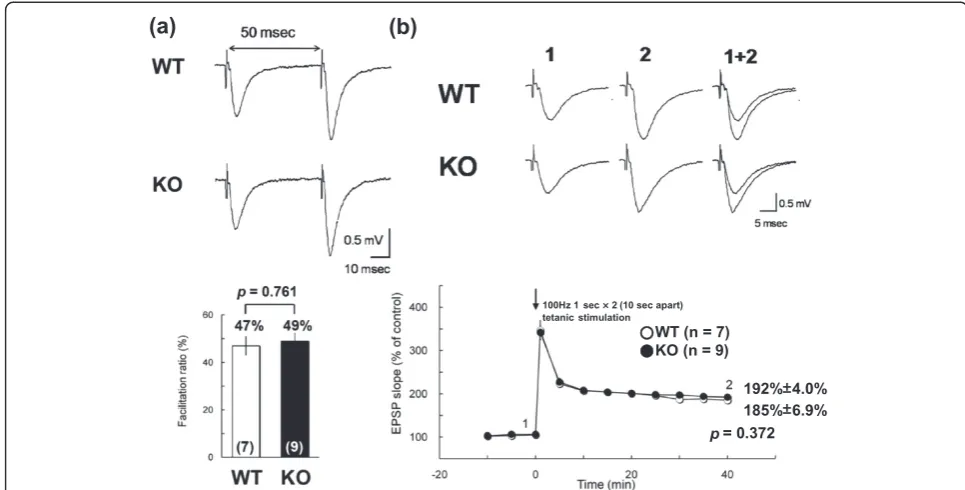
We investigated short- and long-term synaptic plasticity by assessing paired-pulse facilitation (PPF) and long-term potentiation (LTP), respectively, in the CA1 region of the hippocampi of mice. The normalized facilitation ratio for WT mice (n = 7) was 47%, and that for KO mice (n = 9) was 49%, indicating that there were no differences in PPF between WT and KO mice (Figure 7a). These results showed that synaptic transmission was intact in mGluR3 KO mice. We, therefore, measured LTP in mGluR3 KO mice. Tetanic stimulation (100 Hz for 1 second delivered twice at 0.1 Hz) induced a long lasting increase in the syn-aptic strength of control slices (Figure 7a). The normalized EPSP slope for WT mice 40 minutes after the tetanus was 185% ± 6.9% of the average slope before stimulation (n = 7), and that for KO mice was 192% ± 4.0% (p= 0.372) (n = 9), indicating that there were no significant differences in LTP between the two genotypes (Figure 7b).
Increased dopamine concentration in nucleus accumbens of mGluR3 KO mice
mGluR3 KO mice showed hyperactivity in comprehen-sive behavioral analyses. To investigate the molecular
basis for the hyperactivity of mGluR3 KO mice, we con-ducted pharmaco-physiological analyses using the in vivo
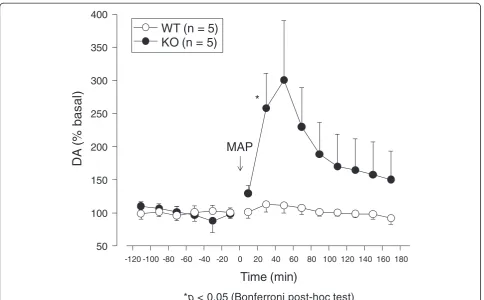
microdialysis procedure of mice. We measured the level of dopamine release induced by the intraperitoneal adminis-tration of MAP (2 mg/kg) in the nucleus accumbens. Sam-pling was performed during three hours following its administration. The MAP-induced increase in dopamine concentrations was significantly greater in the nucleus ac-cumbens of KO mice than in WT mice (Figure 8). The low level MAP-induced increase of dopamine concentra-tions in the nuclear accumbens of WT mice could be due to difference in genetic background from the authentic WT mice because the WT mice prepared in this experi-ment were products of heterozygotes for the mGluR3 KO allele.
Discussion
Certain behavioral abnormalities in KO mice of the rele-vant genes are similar to those observed in patients with psychiatric disorders [25,26]. mGluR3 KO mice showed hyperactivity and impaired working memory, which have been proposed as schizophrenia endophenotypes [27]. However, mGluR3 KO mice did not manifest other
2 4 6 8 10
0
200
400
600
800
1000
1200
Latency (sec)
Sessions
p
= 0.2362
2 4 6 8 10
0
1000
2000
3000
4000
5000
Distance (cm)
Sessions
p
= 0.0394
3sec 10sec 30sec 60sec 50
60 70 80 90 100
Co
rrect Resp
on
ses (%)
Delay time p = 0.7073
p = 0.5258
p = 0.9369
p = 0.9943
WT (n = 19)
KO (n = 18)
WT (n = 18) KO (n = 17)2 4 6 8 10
50
60
70
80
90
100
Correct Responses (%)
Sessions
p
= 0.0458
(c)
(d)
(a)
(b)
p = 0.236
p = 0.707
p = 0.526
p = 0.937
p = 0.994
p = 0.0458
p = 0.0394
schizophrenia phenotypes such as PPI impairment and at-tenuated social behavior. Glutamatergic dysfunction due to the loss of mGluR3 is not sufficient to cause behavioral abnormalities related to the clinical symptoms of schizo-phrenia, which may require additional genetic factors and/ or environmental factors to establish schizophrenia phe-notypes because of the multifactorial background of the pathogenesis of schizophrenia. In fact, according to poly-genic analysis of the results of genome-wide association studies, there may be thousands of common alleles with very small individual effects being involved in the risk of schizophrenia [28].
Group II mGluRs (mGluR2 and mGluR3) have key roles in synaptic plasticity, such as the modulation of LTP [6]. The results of the Porsolt forced swim test and cued and contextual fear conditioning test suggested im-paired reference and contextual memories of stressful events in mGluR3 KO mice. To investigate the possible
involvement of Grm3in reference and contextual
mem-ories through LTP, we performed electrophysiological
analysis in the hippocampi of mice aged 12–14 weeks
old. This age is almost the same age at which the Porsolt forced swim test was conducted. No significant differ-ence in the magnitude of LTP was observed between the
WT
KO
Day1 (n = 20) Day2 (n = 19)
Day1 (n = 18) Day2 (n = 18)
Day1
Day2
1
3
5
7
9
0
50
100
150
200
250
)
m
c(
d
el
e
v
ar
T
e
c
n
at
si
D
Blocks of 1min
1
3
5
7
9
p
= 0.2494
p
= 0.0112
Day2
Day1
1
3
5
7
9
0
20
40
60
80
100
Immobility (%)
Blocks of 1min
1
3
5
7
9
p
= 0.1301
p
= 0.0017
(b)
(d)
(a)
(c)
p
= 0.249
p
= 0.130
p
= 0.0112
p
= 0.0017
two genotypes. These results suggested thatGrm3is not essential for LTP in the hippocampus, although hippo-campal mossy fiber LTD was impaired in mGluR2 KO mice [29]. An inhibitory role of mGluR3 in LTP was
ob-served in the rat dentate gyrus, both in vitro [7] and
in vivo [8]. The mGluR3 specific agonist, NAAG (N-acetylaspartylglutamate) impaired the expression of LTP
in the hippocampus, whereas its antagonist, β-NAAG
had no effect [8], which is consistent with our results. A possibility of a compensatory effect of mGluR2 on LTP could not be excluded in mGluR3 KO mice. Ikegamiet al. [30] reported that striatal dopamine D1 receptor is essen-tial for contextual fear conditioning. The impaired fear conditioning in the mGluR3 KO mice could be due to dopaminergic dysfunction caused by a loss of mGluR3 in the hippocampal circuit.
Pharmaco-physiological analysis revealed that MAP-induced dopamine release was increased in mGluR3 KO mice. An increase in the extracellular levels of dopamine after cocaine administration was also observed in mGluR2 KO mice [31]. These observations suggest that group II mGluRs modulate the extracellular levels of dopamine underlying locomotor activity. This possibility has also been supported by in vitroand in vivoexperimental evi-dence in which group II mGluRs negatively modulated dopamine release in the limbic and cortical regions [5]. Seemanet al. [32] revealed that D2 receptor was 17-fold more sensitive in mGluR3 knockout striate homogenates compared with control. There is also a possibility that D2 receptor hypersensitivity may cause hyper locomotor ac-tivity of mGluR3 mice in this study. The glutamate-dopamine interaction modulates the release of glutamate-dopamine
(d)
(e)
(h)
(i)
WT (n = 19)
KO (n = 18)
Context Testing after 8 days
Cued Testing with Altered Context after 8 days
1 2 3 4 5 0
20 40 60 80
Freezing (%)
1 2 3 4 5 6 0
20 40 60 80
p= 0.5845 p= 0.9547p= 0.2441 min1-3 min4-6
1 2 3 4 5 6 0
50 100 150 200 250 300
1 2 3 4 5 0
50 100 150 200
Distance (cm)
Time (min)
p = 0.0072
min1-3
p = 0.8973 min4-6
p= 0.3365
1 2 3 4 5 6 0
50 100 150
1 2 3 4 5 0
50 100 150
Distance (cm)
Time (min)
p= 0.2256p= 0.5517p= 0.2252 min4-6 min1-3
(a)
(b)
(c)
(f)
(g)
min4-6 p= 0.0194
1 2 3 4 5 6 7 8 0
20 40 60 80
Freezing (%)
1 2 3 4 5 0
20 40 60 80
1 2 3 4 5 6 0
20 40 60 80 Conditioning Context
Testing
Cued Testing with Altered Context
p = 0.0722 p = 0.0369
min1-3 p= 0.9724
min 7-8
p= 0.0038
p = 0.972 p = 0.585 p = 0.955 p = 0.244
p = 0.897 p = 0.337
p = 0.226
p = 0.552 p = 0.225
Figure 6Cued and contextual fear conditioning test.Freezing rates during the conditioning phase(a), contextual test performed 24-hours after conditioning(b)and the cued test with altered context(c)were recorded. Distance traveled in the contextual test(d)and cued test
in the nucleus accumbens through the pyramidal neuron-GABA interneuron network of the prefrontal cortex and corresponding outputs to the nucleus accumbens [33], suggesting that a disturbance in the glutamate-dopamine interaction may be involved in the pathophysiology of schizophrenia-like behavior in mGluR3 KO mice. Further evaluations of the molecular and physiological properties of mGluR3 KO mice could provide new insights into the pathophysiology of schizophrenia and also the roles of mGluR3 in the higher brain function.
Conclusions
mGluR3 KO mice showed hyperactivity and impaired working memories, both known as schizophrenia endophe-notypes. MAP-induced dopamine release in the nucleus
accumbens was increased in mGluR3 KO mice.Grm3may
affect the extracellular level of dopamine underlying hyper-activity. These results demonstrate that a disturbance in the glutamate-dopamine interaction may be involved in the pathophysiology of schizophrenia-like behavior, such as hyperactivity in mGluR3 KO mice.
Methods
Generation of mGluR3 knockout mice
We disrupted exon 4 encoding the first six of seven trans-membrane domains of mGluR3 of 129/Sv mice, although
Cortiet al.[34] reported a generation of mGluR3 mice by targeted disruption of exon 2. Genomic clones containing exon 4, which encodes the first six of seven transmem-brane domains of mGluR3, were isolated from the 129/Sv mouse genomic library (Stratagene). To construct an mGluR3 targeting vector, the 5′arm (4.4 kb), exon 4 re-gion (2.5 kb), and 3′arm (3.7 kb) fragments were isolated from the genomic clones and were inserted into the pflox vector. J1 embryonic stem (ES) cells derived from 129/SvJ strain mice were electroporated with a linearized mGluR3 targeting vector and cultured in medium containing
200μg/ml G418. G418-resistant ES cells were genotyped
by Southern blot analysis. Twelve recombinant ES cell clones were obtained from a total of 144 G418-resistant ES cell clones. The correctly targeted ES cell clones were injected into C57BL/6J (B6) blastocysts and subsequent chimeric mice were crossed with C57BL/6 mice to obtain
Grm3targ/+offspring. FemaleGrm3targ/+mice were crossed
with male transgenic mice expressing Cre recombinase
under the control of the adenovirusEIIapromoter ( EIIa-Cre) to obtain heterozygous mice carrying a null allele by
the deletion of Grm3 exon 4 and neor
(neomycin-resist-ant) gene (Grm3null/+mice). TheGrm3null/+offspring were further backcrossed with C57BL/6J mice for at least seven generations before behavioral, pharmacological
and electrophysiological analyses. Finally, Grm3null/+
Figure 7Paired pulse facilitation and long-term potentiation. (a)Facilitation ratios evaluated at 50-millisecond (msec) intervals; scale: 0.5 mV, 10 msec. The facilitation ratio values were computed as the ratio of the second stimulus-evoked fEPSP peak divided by the first stimulus-evoked fEPSP peak. The facilitation ratios of WT (white bar) and KO (black bar) hippocampal slices (WT: n = 7; KO: n = 9) were calculated from the averaged facilitation ratio values.(b)Average traces recorded at times 1 and 2; scale: 0.5 mV, 5 msec. The arrow indicates the time when the tetanic stimulation {100 Hz 1 sec × 2 (10 sec apart)} was applied. Regarding LTP, the normalized EPSP slope for WT mice 40 minutes after the tetanus was 185% ± 6.9% of the mean slope before stimulation, and that for KO mice was 192% ± 4.0%. There was no significant difference in the magnitude of LTP in WT and KO
mice were intercrossed to generate homozygous knock-out (KO,Grm3null/null) mice.
Genotyping and sex determination
Genomic DNA was isolated from tail biopsies, and was used as a template for genotyping polymerase chain
re-action (PCR). The primers used for the Grm3 wild-type
allele were: WT-F, 5′-GGG GGA AAT TTC ATC ATT
CC-3′; and WT-KO-R, 5′-TGC TGT GCT TTC CTT
TTG AG-3′; and for the null allele were: KO-F, 5′-TCT
AGC CAA GAA CAC CAC CA-3′; and WT-KO-R.
These primers amplified 411-bp and 329-bp fragments
from the Grm3 wild-type and null alleles, respectively.
The sex determination of postnatal day 5 (P5) mice was also conducted by PCR analysis of tail genomic DNAs. The combination of a pair of primers was used to detect
male mice: a pair of 5′-CCA TGT CAA GCG CCC CAT
GA-3′ as the forward primer and 5′-GTA AGG CTT
TTC CAC CTG CA-3′as the reverse primer.
Southern blot analysis
Mouse genomic DNA was extracted from G418-resistant ES cells, and was digested with restriction
enzymes BamH I and Sph I, fractionated by
electro-phoresis through 0.7% agarose gels, transferred onto Hybond-XL (GE Healthcare), and hybridized with the 5′and 3′ probes, respectively. The 5′ probe detected 11.3 kb and 8.4 kb fragments corresponding to the
wild-type and targeted alleles, respectively. The 3′
probe detected 11.6 kb and 7.8 kb fragments corre-sponding to the wild-type and recombinant alleles,
respectively. The 5′ and 3′ probes used in Southern
blot analysis corresponding to nucleotides 6519727–
6520251 and 6504151–6504632 of NT_039299,
re-spectively, were amplified from mouse genomic DNA by PCR. The nucleotide sequences of the primers for
probes were as follows: 5′-TCG GGA TTC TTT CAT
GCT GTT-3′and 5′-AAT CAC CAG AGG GTC CTT
CA -3′were for the 5′probe, and 5′-GCT TGC CTA
TCC CCA AAA GT-3′ and 5′-CGG TGT TTC AGT
CAC TGG TC -3′were for the 3′probe. The genomic
DNA extracted from the mouse brain was also geno-typed by Southern blotting to distinguish mice carry-ing the KO allele. The KO allele was detected as
8.4 kb BamH I and 9.3 kb Sph I fragments by the 5′
and 3′probes, respectively.
-120 -100 -80 -60 -40 -20 0 20 40 60 80 100 120 140 160 180
50 100 150 200 250 300 350 400
DA
(
%
bas
al
)
Time (min)
WT (n = 5)
KO (n = 5)
MAP
*
*
p
< 0.05 (Bonferroni post-hoc test)
Figure 8In vivo microdialysis analysis of mGluR3 KO mice.Methamphetamine (MAP) induced the release of dopamine in the nucleus accumbens of mGluR3 KO mice. The extracellular dopamine levels of WT and KO mice were determined byin vivomicrodialysis and HPLC. After the collection of basal fractions, MAP (2 mg/kg, i.p) was administrated at time 0. Data are given as mean (±SEM) for the indicated number of mice. Repeated-measures analysis of variance revealed a genotype effect of F1,88= 61.9 (p <0.001), a time effect of F8,82= 3.74 (p <0.01), and a
Extraction of RNA and Reverse transcription-PCR (RT-PCR)
Prefrontal cortex tissues were collected from WT and mGluR3 KO mice. The mice were anesthetized with sevoflurane and decapitated. Brains were quickly re-moved under semi-sterile conditions. The brain tissues were retrieved from RNAlater solution with sterile for-ceps, excess RNAlatersolution was quickly blotted away with an absorbent lab wipe, and the tissues were then submerged in ISOGEN (Nippongene). Tissues were ho-mogenized promptly after placing them in ISOGEN on ice using a glass homogenizer potter. RNA was subse-quently washed with 75% ethanol and suspended in
diethylpyrocarbonate-treated water. Total RNA of 1 μg
was reverse transcribed in a 20 μl reaction using the
High Capacity RNA-to-cDNA Kit (ABI). The primer
se-quences for RT-PCR of Grm3 were 5′-GCC ATT GAC
AGC AGC AAC TA-3′(exon 3) for the forward primer,
and 5′-GCT TTG ACC AAG GGT GTG TT-3′ (exon
4) for the reverse primer.
Comprehensive behavioral analyses
Animal and experiment design
Comprehensive behavioral experiments were done as previously described [21,22]. Prior to behavioral studies, mGluR3 KO males were obtained from the crossing be-tween male and female N7 heterozygotes. The resulting heterozygotes were then intercrossed to produce homo-zygous WT and KO mice littermates. The behavioral tests were performed with the male mice of this gener-ation, which were 10 weeks old at the start of the be-havioral study (n = 20 for both groups). Mice were reorganized as soon as they were genotyped at the time of weaning, and were group-housed with four mice per cage, two WT and two KO littermates. Housing condi-tions included a 12-hour light/dark cycle, with lights on
at 7:00 a.m. and access to food and water ad libitum.
Behavioral testing was performed between 9:00 a.m. and 6:00 p.m. After the tests, all apparatus were cleaned with super hypochlorous water to prevent a bias based on olfactory cues with the apparatus. The order of each testing was as indicated in Table 1. Tests were con-ducted from least to more stressful tests, expect ones require long term recording periods like 24-hour homecage motoring. Animal experiments, including the production and maintenance protocols were approved by the Animal Research Committee of Kyushu University. All behavioral tests were approved by the Animal Research Committee of the National Institute for Physiological Sciences. Raw data from the behavioral tests, the date on which each experiment was performed, and the age of the mice at the time of the experiment are available in the Mouse Phenotype Database (http://www.mouse-phenotype.org/).
Open field test
Locomotor activity was measured using the open field test. The open field test was conducted as previously described [21]. Each subject was placed in the center of the open field apparatus (40 cm × 40 cm × 30 cm; Accuscan Instru-ments, Columbus, OH, USA). Total distance traveled (centimeters), vertical activity (rearing measured by count-ing the number of photobeam interruptions), time spent in the center, the beam-break counts for stereotypic be-haviors, and the number of fecal boli were recorded. Data were collected for 120 minutes. Photo beams were posi-tioned 1 cm inside apart from walls at the edge of the open field. The center area was defined as 20 cm × 20 cm area located at the center of the open field.
Light/dark transition test
The apparatus used for the light/dark transition test con-sisted of a cage (21 cm × 42 cm × 25 cm) divided into two sections of equal size by a partition with a door (O’Hara & Co., Tokyo, Japan). One chamber was brightly illuminated (390 lx), whereas the other chamber was dark (2 lx). Mice were placed into the dark side, and allowed to move freely between the two chambers with the door open for 10 mi-nutes. The total number of transitions, time spent in each compartment, first latency to the light side, and distance traveled were recorded automatically using ImageLD soft-ware. On-line material describing this method is available visually [35].
Twenty-four hour home cage monitoring test
The 24-hour home cage monitoring test was conducted as previously described [36]. We used a system that automatically analyzed the locomotor activity of mice in the home cage. The system contained a home cage (29 cm × 18 cm × 12 cm) and a filter cage top, separated by a 13-cm-high metal stand containing an infrared video camera, which was attached to the top of the stand (O’Hara & Co., Tokyo, Japan). Two mice of the same genotype that had been housed separately were placed together in a home cage. Their locomotor activity and social behavior were monitored for 1 week. Outputs from the video cameras were fed into a computer and images from each cage were captured at a rate of one frame per second. Distance traveled was measured auto-matically using ImageHA software. Social interaction was measured by counting the number of particles de-tected in each frame: two particles indicted that the mice were not in contact with each other, and one particle (i.e., the tracking software could not distinguish two sep-arate bodies) indicated contact between the two mice.
T-maze forced alternation task test
The forced alternation task test was conducted using an
described previously [37]. It was constructed of white plastic runways with 25 cm high walls. The maze was partitioned off into six areas by sliding doors that could be opened downward. The stem of the T was composed of area S2 (13 cm × 24 cm) and the arms of the T were composed of areas A1 and A2 (11.5 cm × 20.5 cm).
Areas P1 and P2 were the connecting passage ways from the arms (area A1 or A2) to the start compartment (area S1). The end of each arm was equipped with a let dispenser that could provide a food reward. The pel-let sensors were able to automatically record pelpel-let intake by the mice. One week before pre-training, mice
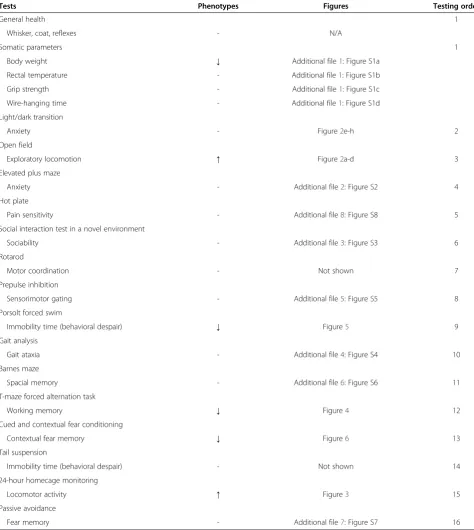
Table 1 Comprehensive behavioral test battery and the phenotypes of mGluR3 KO mice
Tests Phenotypes Figures Testing order
General health 1
Whisker, coat, reflexes - N/A
Somatic parameters 1
Body weight ↓ Additional file1: Figure S1a
Rectal temperature - Additional file1: Figure S1b
Grip strength - Additional file1: Figure S1c
Wire-hanging time - Additional file1: Figure S1d
Light/dark transition
Anxiety - Figure2e-h 2
Open field
Exploratory locomotion ↑ Figure2a-d 3
Elevated plus maze
Anxiety - Additional file2: Figure S2 4
Hot plate
Pain sensitivity - Additional file8: Figure S8 5
Social interaction test in a novel environment
Sociability - Additional file3: Figure S3 6
Rotarod
Motor coordination - Not shown 7
Prepulse inhibition
Sensorimotor gating - Additional file5: Figure S5 8
Porsolt forced swim
Immobility time (behavioral despair) ↓ Figure5 9
Gait analysis
Gait ataxia - Additional file4: Figure S4 10
Barnes maze
Spacial memory - Additional file6: Figure S6 11
T-maze forced alternation task
Working memory ↓ Figure4 12
Cued and contextual fear conditioning
Contextual fear memory ↓ Figure6 13
Tail suspension
Immobility time (behavioral despair) - Not shown 14
24-hour homecage monitoring
Locomotor activity ↑ Figure3 15
Passive avoidance
Fear memory - Additional file7: Figure S7 16
were deprived of food until their body weight was re-duced to 80–85% of the initial level. Mice were kept on a maintenance diet throughout the course of all the T-maze experiments. Before the first trial, mice were sub-jected to three 10-minute adaptation sessions, during which they were allowed to freely explore the T-maze with all doors open and both arms baited with food. On the day after the adaptation session, mice were sub-jected to a forced alternation protocol for 11 days (one session consisting of 10 trials per day; cutoff time, 50 mi-nutes). Mice were given 10 pairs of training trials per day. On the first (sample) trial of each pair, the mouse was forced to choose one of the arms of the T (area A1 or A2), and received the reward at the end of the arm. Choosing the incorrect arm resulted in no reward and confinement to the arm for 10 seconds. After the mouse consumed the pellet or the mouse stayed >10 seconds without consuming the pellet, the door that separated the arm (area A1 or A2) and connecting passage way (area P1 or P2) was opened and the mouse could return to the starting compartment (area S1), via the connect-ing passage way. The mouse was then given a 3-second delay there and a free choice between both T arms and rewarded for choosing the other arm that was not chosen on the first trial of the pair. The location of the sample arm (left or right) was varied pseudo-randomly across trials using the Gellermann schedule so that mice received equal numbers of left and right presentations. A variety of fixed extramaze cues surrounded the appar-atus. A delay (10, 30, or 60 seconds) was applied three trials after the sample trial.
Porsolt forced swim test
The Porsolt forced swim test was performed as de-scribed previously [38]. The apparatus consisted of four Plexiglas cylinders (20 cm height × 10 cm diameter; O’Hara & Co., Tokyo, Japan). The cylinders were filled with water at 23°C, up to a height of 7.5 cm. Mice were placed into the cylinders, and their behavior was re-corded over a 10-minute test period (days 1 and 2). Im-ages were captured at one frame per second. For each pair of successive frames, the amount of area (pixels) that the mouse moved in was measured. When the amount of area was below a certain threshold, mouse
behavior was judged as “immobile.” When the amount
of area equaled or exceeded the threshold, the mouse was considered as“moving.”The optimal threshold used for judging was determined through adjustments it to the amount of immobility measured by human observa-tion. Immobility lasting for less than 2 seconds was not included in the analysis. Retention tests were admi-nistered 24 hours after training. Data acquisition and analysis were performed automatically using ImageTS software.
Cued and contextual fear conditioning test
The cued and contextual fear conditioning test was con-ducted as previously described [39]. On the training day, each mouse was placed into a conditioning chamber (10.5 cm × 10.5 cm × 10.5 cm; O’Hara & Co., Tokyo, Japan) and allowed to explore freely for 2 minutes. A tone (75 dB) was presented as the conditioned stimulus for 30 seconds followed by a 2-second mild foot shock (0.3 mA) as the unconditioned stimulus. One or two more toneshock pairs were given at 2-minute intervals and the animal was returned to its home cage 30 seconds after the last pair. Twenty-four hours after the condi-tioning session, the mice were placed back into the con-ditioning chamber for 5 minutes and their freezing behavior was measured in context. One hour after the context testing, the mice were placed into a different, white Plexiglas chamber for 3 minutes and then the tone was turned on for 3 minutes. Freezing behavior was measured eight days after the conditioning in the same manner as that 24 hours after the conditioning. Data ac-quisition, control of stimuli (i.e., tones and shocks), and data analysis were performed automatically, using Ima-geFZ software. Images were captured at one frame per second. For each pair of successive frames, the amount of area (pixels) by which the mouse moved was mea-sured. When this area was below a certain threshold (i.e., 20 pixels), the behavior was judged as‘freezing’. When the amount of area equaled or exceeded the threshold, the
be-havior was considered as ‘non-freezing’. The optimal
threshold (amount of pixels) to judge freezing was deter-mined by adjusting it to the amount of freezing measured by human observation.‘Freezing’that lasted less than the defined time threshold (i.e., 2 s) was not included in the analysis.
Image analysis
The applications used for the behavioral studies (ImageLD, ImageHA, ImageTM, ImageTS, ImageFZ, ImageEP, ImageSI, and ImageBM) were based on the NIH Image program (developed at the U.S. National Institutes of Health and available at http://rsb.info.nih.gov/nih-image) and the ImageJ program (http://rsb.info.nih.gov/ij). They were modified for each test by authors and are available through O’Hara & Co. ImageLD [35], ImageEP [40], Ima-geFZ [37] and ImageTM are freely available at the follow-ing URL: http://www.mouse-phenotype.org/software.html.
Electrophysiological analysis
and were incubated in NR to allow them to recover for at least 1 hour at room temperature. All recordings were car-ried out in a submerged slice chamber perfused with NR 33°C ± 0.5°C. A recording electrode filled with 0.9% NaCl was used for recording. Synaptic responses were evoked at 0.1 Hz using a bipolar tungsten electrode. Paired pulse fa-cilitation (PPF) was examined at 50-millisecond (msec) in-terstimulus intervals with three traces. PPF values were calculated as the ratio of the second stimulus-evoked field excitatory postsynaptic potential (fEPSP) peak divided by the first stimulus-evoked fEPSP peak. Frequency facilita-tion was calculated to obtain the average value of the fa-cilitation ratio of three traces. Tetanic stimulation to evoke LTP consisted of two trains of 100 Hz stimulation lasting for 1 second at an inter-trial interval of 10 seconds. LTP of the fEPSP slope was expressed as a percentage of the mean before tetanic stimulation. To preclude bias, the experiments of the PPF and LTP measurements were blinded with respect to the genotype of the mice analyzed. All data were expressed as a mean ± SEM analyzed with Student’s t-test.
Pharmaco-physiological analysis
Pharmaco-physiological analysis was conducted as
pre-viously described [43]. We performedin vivo
microdial-ysis measurements of extracellular dopamine in the central nervous systems of 10-12-week-old mice. These mice were anesthetized with sodium pentobarbital, and a guide cannula (AG-4; EICOM, Kyoto, Japan) was im-planted into the nucleus accumbens (+1.1 mm antero-posterior and +1.0 mm mediolateral relative to the
bregma and −4.0 mm dorsoventral relative to the dura
of the skull, according to the atlas of Franklin and Paxi-nos) and was secured to the skull with stainless steel screws and dental acrylic cement. The placement of probes were confirmed by the standard histological examination. One day after the surgery, a dialysis probe (AI-4-1, 1-mm membrane length; EICOM) was inserted through the guide cannula and was perfused at a flow
rate of 1 μl/min with artificial cerebrospinal fluid
(148 mM NaCl, 2.7 mM KCl, 1.2 mM CaCl2, 0.85 mM MgCl2). Sample collection was started after an equili-bration period of 1 hour. Outflow fractions were col-lected every 20 minutes. After the collection of at least six baseline fractions, mice were treated with MAP (2 mg/kg, i.p.) and sampling was continued for an additional 300 minutes. The amount of dopamine in the dialysis fractions was measured by high-performance liquid chromatography (HPLC) on PP-ODS column (EICOM) that was maintained at 25°C and equipped with an electrochemical detection system (HTEC-500, EICOM) and PowerChrom (EICOM). The mobile phase comprised 0.1 M phosphate buffer (pH 6.0) containing 1% methanol, sodium decanesulfonic acid (500 mg/l),
and EDTA (disodium salt, 50 mg/l) and was delivered at a flow rate of 0.5 ml/minute.
Statistical analysis
Statistical analyses of comprehensive behavioral tests were conducted by using StatView (SAS Institute, Cary, NC). Data were analyzed by Student’s t-test or Mann–Whitney
U-test, one-way Analysis of Variance (ANOVA) or
two-way repeated measures ANOVA. Values in graphs are expressed as mean ± SEM. Electrophysiological analysis
was performed using the Student’s t-test.
Pharmaco-physiological analysis was conducted using the Bonferroni post-hoc test.
The detailed method for statistical analysis was described in the Figure legend.
The following methods of behavioral analyses, whose results were shown in Additional files 1, 2, 3, 4, 5, 6, 7 and 8.
General health and neurological examination
To compare the physical characteristics of WT mice and KO mice littermates, we first conducted neurological screening as previously described [38]. The righting, whis-kers touch, and ear twitch reflexes were evaluated, and a number of physical features including body weight and temperature, and the presence of whiskers or bald hair patches were recorded. Neuromuscular strength was ex-amined by the grip strength and wire-hanging tests. The grip strength meter (O’Hara & Co., Tokyo, Japan) was used to assess forelimb grip strength. Mice were lifted and held by their tail so that their forepaws could grasp a wire grid. Mice were then gently pulled backward by the tail with their posture parallel to the surface of the table until they released the grid. The peak force applied by the mouse forelimbs was recorded in newtons (N). Each mouse was tested three times and the greatest value mea-sured was used for statistical analysis. In the wire hanging test, mice were placed on a wire mesh, which was then inverted and waved gently, so that the subject gripped the wire. Latency to fall was recorded, with a 60-second cut-off time.
Elevated plus maze test
a 10-minute test period as previously described [40]. The number of entries into, and the time spent on open and enclosed arms were recorded. For data analysis, we employed the following four measures: the percentage of entries into the open arms, the time stayed in the open arms (seconds), the number of total entries, and total distance traveled (centimeters). Data acquisition and analysis were performed automatically, using ImageEP software.
Social interaction test in a novel environment
The social interaction test in a novel environment was conducted as previously described [44]. Two mice of identical genotypes, which were previously housed in different cages, were placed into a box together (40 cm × 40 cm × 30 cm) and allowed to explore it freely for 10 minutes. Social behavior was monitored by a CCD camera, which was connected to a Macintosh computer. Analysis was performed automatically using ImageSI software. The number of contacts, duration of contacts, and total distance traveled were measured.
Gait analysis
The gait analysis was conducted as previously described [45]. Digital video images of the underside of mice were collected at 150 frames per second with a high-speed video camera from below the transparent belt of a motor-ized treadmill (DigiGait Imaging System, Mouse Specifics, Quincy, MA, USA). The compartment of the treadmill in which the mouse walked was ~25 cm in length and ~5 cm wide, and could be changed to accommodate different-sized animals. The software of DigiGait Imaging System identified the four paws of each mouse in each individual image of the underside of the mouse as it walked on the belt through its strides. Each image represented 6.67 msec; the paw area indicated the temporal placement of the paw relative to the treadmill belt. Color images were converted to their binary matrix equivalents, and the areas (in pixels) of the approaching or retreating paws relative to the belt and camera were calculated throughout each stride. Plot-ting the area of each digital paw print (paw contact area) imaged sequentially in time provided a dynamic gait sig-nal, representing the temporal record of paw placement relative to the treadmill belt. Each gait signal for each limb comprised a stride duration (stride time), which included the stance duration when the paw of a limb was in contact with the walking surface, plus the swing duration when the paw of the same limb is not in contact with the walk-ing surface. Stance duration was further subdivided into braking duration (increasing paw contact area over time) and propulsion duration (decreasing paw contact area over time). Stride frequency was calculated by counting the number of gait signals over time. Stride length was cal-culated from the equation:speed = stride frequency × stride
length. To obtain stance widths and paw placement angles at full stance, ellipses were fitted to the paws, and the centers, vertices, and major axes of the ellipses were deter-mined. Forelimb and hindlimb stance widths were calcu-lated as the perpendicular distance between the major axes of the left and right paw images during peak stance. Gait data were collected and pooled from both the left and right forelimbs, and the left and right hindlimbs.
Startle response/prepulse inhibition
The startle response/prepulse inhibition test was con-ducted as previously described [44]. A startle reflex meas-urement system was used (O’Hara & Co., Tokyo, Japan). A test session began by placing a mouse in a Plexiglas cy-linder where it was left undisturbed for 10 minutes. The duration of white noise that was used as the startle stimu-lus was 40 msec for all trial types. The startle response was recorded for 140 msec (measuring the response every 1 msec) starting with the onset of the prepulse stimulus. The background noise level in each chamber was 70 dB. The peak startle amplitude recorded during the 140 msec sampling window was used as the dependent variable. A test session consisted of six trial types [i.e., two types for ‘startle-stimulus-only’ trials, and four types for prepulse inhibition (PPI) trials]. The intensity of startle stimulus was 110 or 120 dB. The prepulse sound was presented 100 msec before the startle stimulus, and its intensity was 74 or 78 dB. Four combinations of prepulse and startle stimuli were employed (74–110, 78–110, 74–120, and 78– 120 dB). Six blocks of the six trial types were presented in pseudo-random order such that each trial type was pre-sented once within a block. The average inter-trial interval was 15 seconds (range: 10–20 seconds).
Barnes maze test
The Barnes maze test was performed as described previ-ously [21]. The test was conducted on“dry land”, a white circular surface, 1.0 m in diameter, with 12 holes equally
spaced around the perimeter (O’Hara & Co., Tokyo,
environment room cues. One trial was conducted immedi-ately after the probe test, and additional probe tests were conducted again 1 month later. Latency, the number of er-rors, distance traveled until they located the target hole, and the time spent around each hole were recorded by ImageBM software.
Passive avoidance test
Passive avoidance test was conducted as described previ-ously [21]. The apparatus was a trapezoidal box, consist-ing of one dark and one bright chamber connected by a guillotine door (O’Hara & Co., Tokyo, Japan). Each mouse was first placed into the lighted chamber and the guillotine door was opened. After mouse entered the dark chamber, a two seconds footshock at 0.3 mA was delivered to mouse. Mice that did not enter the dark chamber within 300 seconds were excluded from ana-lysis. One day and two days later, animals were tested for retention by placing each animal into the lighted chamber and the latency of the mouse entering the dark chamber was recorded.
Hot plate test
The hot plate test was conducted as previously described [21]. The hot plate test was used to evaluate nociception or sensitivity to a painful stimulus. Mice were placed on a hot plate at 55.0 ± 0.3°C (Columbus Instruments, Columbus, OH, USA), and latency to the first hind-paw response was recorded. The hind-paw response was ei-ther a foot shake or paw lick.
Additional files
Additional file 1: Figure S1.Somatic parameters and general behavior. Body weight(a), body temperature(b), grip strength(c), and latency to fall in the wire hang test(d)were recorded. Thep-values indicate a genotype effect in Student’s t-test. Data are given as mean (±SEM). Additional file 2: Figure S2.Elevated plus maze test. The number of entries into the center crossing between the open and closed arms(a), number of entries into the open arms(b), distance traveled(c), the total time spent in the open arms(d), the total time spent in the close arms
(e), and the total time spent in the center(f)were recorded. Thep-values indicate a genotype effect in the one-way ANOVA. Data are given as mean (±SEM).
Additional file 3: Figure S3.Social interaction test in a novel environment. The total duration of contacts(a), number of contacts
(b), total duration of active contacts(c), mean duration of each contact
(d), and the total distance traveled(e)were recorded. Thep-values indicate a genotype effect in the one-way ANOVA. Data are given as mean (±SEM).
Additional file 4: Figure S4.Gait analysis.(a-f)Front paw and(g-l)
hind paw. Stride duration of swing, brake, and propel(a, g), stance duration of brake and propel(b, h), stance width(c, i), stride length
(d, j), step angle(e, k), and paw angle(f, l)were recorded. Thep-values indicate a genotype effect in the one-way ANOVA. Data are given as mean (±SEM). There were no significant differences excepting for stride length of front and hind paws (d,p= 0.0182;j,p= 0.0087), and paw angle of hind paw (l,p= 0.0119). It is possible that the weight difference is a cause in the difference of the stride length.
Additional file 5: Figure S5.Startle response/prepulse inhibition. The acoustic startle response(a)and prepulse inhibition test(b)were recorded. Thep-values indicate a genotype effect in the one-way ANOVA. Data are given as mean (±SEM).
Additional file 6: Figure S6.Barnes maze test.(a, b)Training course: Latency to the target hole(a)and the number of errors to the target hole(b)were recorded.(c, d)Probe tests 24-hours after the last training: Time spent around each hole(c)and the ratio of time spent around the target and target + ±30(d)were recorded.(e, f)Probe tests 1 month after the last training: time spent around each hole(e), ratio of time spent around the target and target + ±30(f)were recorded. Thep-values indicate a genotype effect in the two-way repeated measures ANOVA
(a, b), one-way ANOVA(c, e)and Mann-WhitneyU-test(d, f). Data are given as mean (±SEM).
Additional file 7: Figure S7.Passive avoidance test.(a, b)Latency to enter dark compartment after one day(a)and two days(b)were recorded. Thep-values indicate a genotype effect in the one-way ANOVA. Data are given as mean (±SEM).
Additional file 8: Figure S8.Hot plate test. Latency to the first hind-paw response was recorded. Thep-values indicate a genotype effect in the one-way ANOVA. Data are given as mean (±SEM).
Abbreviations
mGluR3:Metabotropic glutamate receptor 3; KO: Knockout; WT: Wild-type; mGluRs: Metabotropic glutamate receptors; ES: Embryonic stem; B6: C57BL/ 6J;EIIa-Cre:Crerecombinase under the control of the adenovirusEIIa promoter; neor: Neomycin-resistant; PCR: Polymerase chain reaction; RT-PCR: Reverse transcription-PCR; NR: Normal ringer; LTP: Long-term potentiation; PPF: Paired pulse facilitation; fEPSP: Field excitatory postsynaptic potential; MAP: Methamphetamine; PPI: Prepulse inhibition; NAAG: N-acetylaspartylglutamate; GABA: Gamma-aminobutyric acid.
Competing interests
The authors declare that they have no competing interests.
Authors’contributions
RF and TN co-wrote the manuscript. RF carried out the electrophysiological analyses under the supervision of II. TN performed the comprehensive behavioral experiments under the supervision of SH, KT, and TM. AI, AS and MN participated in generation and characterization of mGluR3 KO mice. KK conducted the pharmaco-physiological analyses. YF designed the study. All authors read and approved the final manuscript.
Acknowledgements
We are grateful to Dr. Noriaki Sagata, Ms. Yuki Fukuyoshi, and Mr. Tatsuya Sasaki of the Research Center for Genetic Information, Medical Institute of Bioregulation, Kyushu University, for their help in the generation of mGluR3 KO mice and Ms. Rie Funatsu for maintaining the mouse colonies. This work was supported by Grants-in-Aid for Scientific Research on Priority Areas
‘Applied Genomics’and Grant-in-Aid for Scientific Research on Innovative Areas‘Comprehensive Brain Science Network’from the Ministry of Education, Culture, Sports, Science, and Technology of Japan and a Grant-in-Aid for Scientific Research (A) from the Japan Society for the Promotion of Science.
Author details
1Division of Human Molecular Genetics, Research Center for Genetic
Information, Medical Institute of Bioregulation, Fukuoka 812-8582, Japan.
2Department of Biology, Faculty of Science, Kyushu University, Fukuoka
812-8581, Japan.3Department of Pharmacology, Nagasaki International University, Sasebo 859-3298, Japan.4Department of Pharmacology, Gifu
University Hospital, Gifu 501-1194, Japan.5Department of Medicine and Bioregulatory Science, Graduate School of Medical Science, Kyushu University, Fukuoka 812-8582, Japan.6Division of Systems Medical Science, Institute for Comprehensive Medical Science, Fujita Health University, Toyoake 470-1192, Japan.7CREST, Japan Science and Technology Agency, Kawaguchi 332-0012, Japan.8Section of Behavior Patterns, Center for Genetic
Received: 1 February 2014 Accepted: 15 April 2014 Published: 23 April 2014
References
1. Meldrum BS:Glutamate as a neurotransmitter in the brain: review of physiology and pathology.J Nutr2000,130:1007S–1015S.
2. Conn PJ, Pin JP:Pharmacology and functions of metabotropic glutamate receptors.Annu Rev Pharmacol Toxicol1997,37:205–237.
3. Tanabe Y, Masu M, Ishii T, Shigemoto R, Nakanishi S:A family of metabotropic glutamate receptors.Neuron1992,8:169–179. 4. De Blasi A, Conn PJ, Pin JP, Nicoletti F:Molecular determinants of
metabotropic glutamate receptor signaling.Trends Pharmacol Sci2001,
22:114–120.
5. Harrison PJ, Lyon L, Sartorius LJ, Burnet PW, Lane TA:The group II metabotropic glutamate receptor 3 (mGluR3, mGlu3, GRM3): expression, function and involvement in schizophrenia.Psychopharmacology2008,
22:308–322.
6. Anwyl R:Metabotropic glutamate receptors: electrophysiological properties and role in plasticity.Brain Res Rev1999,29:83–120. 7. Lea PM, Wroblewska B, Sarvey JM, Neale JH:Beta-NAAG rescues LTP from
blockade by NAAG in rat dentate gyrus via the type 3 metabotropic glutamate receptor.J Neurophysiol2001,85:1097–1106.
8. Pöschel B, Wroblewska B, Heinemann U, Manahan-Vaughan D:The metabotropic glutamate receptor mGluR3 in critically required for hippocampal long-term depression and modulates long-term potentiation in the dentate gyrus of freely moving rats.Cereb Cortex2005,15:1414–1423. 9. Cartmell J, Schoepp DD:Regulation of neurotransmitter release by
metabotropic glutamate receptors.J Neurochem2000,75:889–907. 10. Javitt DC:Glutamate as a therapeutic target in psychiatric disorders.
Mol Psychiatry2004,9:984–997.
11. Javitt DC, Zukin SR:Recent advances in the phencyclidine model of schizophrenia.Am J Psychiatry1991,148:1301–1308.
12. Moghaddam B, Adams BW:Reversal of phencyclidine effects by a group II metabotropic glutamate receptor agonist in rats.Science1998,
281:1349–1352.
13. Fujii Y, Shibata H, Kikuta R, Makino C, Tani A, Hirata N, Shibata A, Ninomiya H, Tashiro N, Fukumaki Y:Positive associations of polymorphisms in the metabotropic glutamate receptor type 3 gene (GRM3) with
schizophrenia.Psychiatr Genet2003,13:71–76.
14. Egan MF, Straub RE, Goldberg TE, Yakub I, Callicott JH, Hariri AR, Mattay VS, Bertolino A, Hyde TM, Shannon-Weickert C, Akil M, Crook J, Vakkalanka RK, Balkissoon R, Gibbs RA, Kleinman JE, Weinberger DR:Variation in GRM3 affects cognition, prefrontal glutamate, and risk for schizophrenia.
Proc Natl Acad Sci U S A2004,101:12604–12609.
15. Chen Q, He G, Chen Q, Wu S, Xu Y, Feng G, Li Y, Wang L, He L:A case– control study of the relationship between the metabotropic glutamate receptor 3 gene and schizophrenia in the Chinese population.
Schizophr Res2005,73:21–26.
16. Nicodemus KK, Kolachana BS, Vakkalanka R, Straub RE, Giegling I, Egan MF, Rujescu D, Weinberger DR:Evidence for statistical epistasis between catechol-O-methyltransferase (COMT) and polymorphisms in RGS4, G72 (DAOA), GRM3, and DISC1: influence on risk of schizophrenia.Hum Genet 2007,120:889–906.
17. Mössner R, Schuhmacher A, Schulze-Rauschenbach S, Kühn KU, Rujescu D, Rietschel M, Zobel A, Franke P, Wölwer W, Gaebel W, Häfner H, Wagner M, Maier W:Further evidence for a functional role of the glutamate receptor gene GRM3 in schizophrenia.Eur Neuropsychopharmacol2008,18:768–772. 18. Norton N, Williams HJ, Dwyer S, Ivanov D, Preece AC, Gerrish A, Williams
NM, Yerassimou P, Zammit S, O’Donovan MC, Owen MJ:No evidence for association between polymorphisms inGRM3and schizophrenia.
BMC Psychiatr2005,5:e23.
19. Schwab SG, Plummer C, Albus M, Borrmann-Hassenbach M, Lerer B, Trixler M, Maier W, Wildenauer DB:DNA sequence variants in the metabotropic glutamate receptor 3 and risk to schizophrenia: an association study.
Psychiatr Genet2008,18:25–30.
20. Albalushi T, Horiuchi Y, Ishiguro H, Koga M, Inada T, Iwata N, Ozaki N, Ujike H, Watanabe Y, Someya T, Arinami T:Replication study and meta-analysis of the genetic association ofGRM3gene polymorphisms with schizophrenia in a large Japanese case–control population.Am J Med Genet B Neuropsychiatr Genet2008,147:392–396.
21. Takao K, Tanda K, Nakamura K, Kasahara J, Nakao K, Katsuki M, Nakanishi K, Yamasaki N, Toyama K, Adachi M, Umeda M, Araki T, Fukunaga K, Kondo H, Sakagami H, Miyakawa T:Comprehensive behavioral analysis of calcium/ calmodulin-dependent protein kinase IV knockout mice.PLoS One2010,
5(3):e9460.
22. Sagata N, Iwaki A, Aramaki T, Takao K, Kura S, Tsuzuki T, Kawakami R, Ito I, Kitamura T, Sugiyama H, Miyakawa T, Fukumaki Y:Comprehensive behavioral study of GluR4 knockout mice: implication in cognitive function.Genes Brain Behav2010,9:899–909.
23. Geyer MA, Ellenbroek B:Animal behavior models of the mechanisms underlying antipsychotic atypicality.Prog Neuropsychopharmacol Biol Psychiatry2003,27:1071–1079.
24. Arguello PA, Gogos JA:Modeling madness in mice: one piece at a time.
Neuron2006,52:179–196.
25. Gainetdinov RR, Mohn AR, Caron MG:Genetic animal models: focus on schizophrenia.Trends Neurosci2001,24:527–533.
26. Gottesman II, Gould TD:The endophenotype concept in psychiatry: etymology and strategic intentions.Am J Psychiatry2003,160:636–645. 27. Amann LC, Gandal MJ, Halene TB, Ehrlichman RS, White SL, McCarren HS, Siegel SJ:Mouse behavioral endophenotypes for schizophrenia.Brain Res Bull2010,83:147–161.
28. The International Schizophrenia Consortium, Purcell SM, Wray NR, Stone JL, Visscher PM, O’Donovan MC, Sullivan PF, Sklar P:Common polygenic variation contributes to risk of schizophrenia and bipolar disorder.
Nature2009,460:748–752.
29. Yokoi M, Kobayashi K, Manabe T, Takahashi T, Sakaguchi I, Katsuura G, Shigemoto R, Ohishi H, Nomura S, Nakamura K, Nakao K, Katsuki M, Nakanishi S:Impairement of hippocampal mossy fiber LTD in mice lacking mGluR2.Science1996,273:645–647.
30. Ikegami M, Uemura T, Kishioka A, Sakimura K, Mishina M:Striatal dopamine D1 receptor is essential for contextual fear conditioning.Sci Rep2014,
4:e3976.
31. Morishima Y, Miyakawa T, Furuyashiki T, Tanaka Y, Mizuma H, Nakanishi S:
Enhanced cocaine responsiveness and impaired motor coordination in metabotropic glutamate receptor subtype 2 knockout mice.Proc Natl Acad Sci U S A2005,102:4170–4175.
32. Seeman P, Battaglia G, Corti C, Corsi M, Bruno V:Glutamate receptor mGlu2 and mGlu3 knockout striata are dopamine supersensitive, with elevated D2(High) receptors and marked supersensitivity to the dopamine agonist (+)PHNO.Synapse2009,63:247–251.
33. Del Arco A, Mora F:Prefrontal cortex-nucleus accumbens interaction: in vivo modulation by dopamine and glutamate in the prefrontal cortex.
Pharmacol Biochem Behav2008,90:226–325.
34. Corti C, Battaglia G, Molinaro G, Riozzi B, Pittaluga A, Corsi M, Mugnaini M, Nicoletti F, Bruno V:The use of knock-out mice unravels distinct roles for mGlu2 and mGlu3 metabotropic glutamate receptors in mechanisms of neurodegeneration/neuroprotection.J Neurosci2007,27:8297–8308. 35. Takao K, Miyakawa T:Light/dark transition test for mice.J Vis Exp2006,
1:e104.
36. Komine Y, Takao K, Miyakawa T, Yamamori T:Behavioral abnormalities observed in Zfhx2-deficient mice.PLoS One2012,7(12):e53114. 37. Shoji H, Hagihara H, Takao K, Hattori S, Miyakawa T:T-maze forced
alternation and left-right discrimination tasks for assessing working and reference memory in mice.J Vis Exp2012,60:e3300.
38. Miyakawa T, Yamada M, Duttaroy A, Wess J:Hyperactivity and intact hippocampus-dependent learning in mice lacking the M1 muscarinic acetylcholine receptor.J Neurosci2001,21:5239–5250.
39. Yao I, Takao K, Miyakawa T, Ito S, Setou M:Synaptic E3 ligase SCRAPPER in contextual fear conditioning: extensive behavioral phenotyping of Scrapper heterozygote and overexpressing mutant mice.PLoS One2011,
6(2):e17317.
40. Komada M, Takao K, Miyakawa T:Elevated plus maze for mice.J Vis Exp 2008,22:e1088.
41. Ito I, Kawakami R, Sakimura K, Mishina M, Sugiyama H:Input-specific targeting of NMDA receptor subtypes at mouse hippocampal CA3 pyramidal neuron synapses.Neuropharmacology2000,39:943–951. 42. Kawakami R, Shinohara Y, Kato Y, Sugiyama H, Shigemoto R, Ito I:
Asymmetrical allocation of NMDA receptor epsilon2 subunits in hippocampal circuitry.Science2003,300:990–994.
the schizophrenia-associated protein FEZ1 manifest hyperactivity and enhanced responsiveness to psychostimulants.Hum Mol Genet2008,
17:3191–3203.
44. Matsuo N, Takao K, Nakanishi K, Yamasaki N, Tanda K, Miyakawa T:
Behavioral profiles of three C57BL/6 substrains.Front Behav Neurosci2010,
4:e29.
45. Hampton TG, Stasko MR, Kale A, Amende I, Costa AC:Gait dynamics in trisomic mice: quantitative neurological traits of Down syndrome.Physiol Behav2004,82:381–389.
doi:10.1186/1756-6606-7-31
Cite this article as:Fujiokaet al.:Comprehensive behavioral study of mGluR3 knockout mice: implication in schizophrenia related endophenotypes.Molecular Brain20147:31.
Submit your next manuscript to BioMed Central and take full advantage of:
• Convenient online submission
• Thorough peer review
• No space constraints or color figure charges
• Immediate publication on acceptance
• Inclusion in PubMed, CAS, Scopus and Google Scholar
• Research which is freely available for redistribution