P R I M A R Y R E S E A R C H
Open Access
An efficient method for protein function
annotation based on multilayer protein
networks
Bihai Zhao, Sai Hu
*, Xueyong Li, Fan Zhang, Qinglong Tian and Wenyin Ni
*Abstract
Background:Accurate annotation of protein functions is still a big challenge for understanding life in the post-genomic era. Many computational methods based on protein-protein interaction (PPI) networks have been proposed to predict the function of proteins. However, the precision of these predictions still needs to be improved, due to the incompletion and noise in PPI networks. Integrating network topology and biological information could improve the accuracy of protein function prediction and may also lead to the discovery of multiple interaction types between proteins. Current algorithms generate a single network, which is archived using a weighted sum of all types of protein interactions.
Method:The influences of different types of interactions on the prediction of protein functions are not the same. To address this, we construct multilayer protein networks (MPN) by integrating PPI networks, the domain of proteins, and information on protein complexes. In the MPN, there is more than one type of connections between pairwise proteins. Different types of connections reflect different roles and importance in protein function prediction. Based on the MPN, we propose a new protein function prediction method, named function prediction based on multilayer protein networks (FP-MPN). Given an un-annotated protein, the FP-MPN method visits each layer of the MPN in turn and generates a set of candidate neighbors with known functions. A set of predicted functions for the testing protein is then formed and all of these functions are scored and sorted. Each layer plays different importance on the prediction of protein functions. A number of top-ranking functions are selected to annotate the unknown protein.
Conclusions:The method proposed in this paper was a better predictor when used onSaccharomyces cerevisiae protein data than other function prediction methods previously used. The proposed FP-MPN method takes different roles of connections in protein function prediction into account to reduce the artificial noise by introducing biological information.
Background
The accurate annotation of protein functions is the key to understanding life at the molecular level and has great biomedical and pharmaceutical implications. Due to high-throughput biological technologies, a large number of protein sequences [1] are available, while majority of their functions are still unknown. With its inherent diffi-culty and expense, experimental characterization of pro-tein functions cannot accommodate the ever-increasing number of sequences and structures produced by Genom-ics Centers. Recent developments in experiments such as
yeast two-hybrid [2], tandem affinity purification [3] and mass spectrometry [4] have resulted in the publications of many high-quality, large-scale protein-protein interaction (PPI) data, which make it possible and feasible to use com-putational methods to predict functions for un-annotated proteins [5].
The past decade has witnessed a rapid development of computational methods for predicting protein functions from PPI datasets. A neighbor counting (NC) method proposed by Schwikowski et al. [6] predicted an un-annotated protein with the functions that occurred most frequently among its neighbor proteins. However, this method ignored the background frequency of different function annotations. Hishigaki et al. [7] improved the * Correspondence:[email protected];[email protected]
Department of Mathematics and Computing Science, Changsha University, Changsha, Hunan 410022, China
neighbor counting method by using the Chi-Square statistics instead of frequency as a scoring function. Besides direct neighbors, Chua et al. [8] inferred the func-tional information within both direct (level 1) and indirect (level 2) neighbors by giving them different weights. Prior methods typically measured proximity as the shortest-path distance in the network, while most proteins are close to each other. Cao et al. [9] introduced diffusion state distance (DSD), a new metric based on a graph diffu-sion property, designed to capture finer-grained distinc-tions in proximity for transferring functional annotation in PPI networks. Other methods have been introduced to make functional prediction by getting the most consistent agreement throughout the whole PPI networks [10]. Chi et al. [11] proposed an approach that predicted protein functions iteratively. This iterative approach incorporated the local and global semantic influence of protein func-tions into the prediction. Some kind of network-based methods partitioned proteins in PPI networks into several function modules [12], and the proteins in the same mod-ules are assigned with the same functions. Lee et al. [13] applied a novel method that generated improved modular-ity solutions, and developed a better method to use this community information to predict protein’s functions.
Taking both high noise in PPI data and insufficient number of available annotated proteins into account, some researchers have tried to improve the prediction performance by incorporating other heterogeneous data sources. Cozzetto et al. [14] proposed an integrative approach for addressing annotation challenge, which combines into a wide variety of biological information sources encompassing sequence, gene expression, and PPI data. Zhang et al. [15] presented a novel protein function prediction method that combined protein domain composition information and PPI networks. Domain combination similarity (DCS) [16] was applied to predict protein function by integrating PPI networks and proteins’domain information. Different from Zhang’s, DCS changed the method to calculate domain context similarity and combined the domain compositions of both proteins and their neighbors. Liang et al. [17] built a net-work model called protein overlap netnet-work (PON) using domain co-occurrence information. In a PON, each node represented a protein and two nodes were connected with an edge if they share a common domain. The function of a protein can be predicted by counting the occurrence frequency of gene ontology (GO) terms associated with domains of direct neighbors in the PON. Recently, some new algorithms are proposed to predict protein function from PPI networks. Gong et al. [18] developed a method named GoFDR for predicting GO-based protein functions. The input for GoFDR is simply a query sequence-based multiple sequence alignment (MSA) produced by PSI-BLAST (Position-Specific Iterated PSI-BLAST). Kumar et al.
[19] proposed an improved approach for protein function prediction by exploiting the connectivity properties of prominent proteins. Yu et al. [20] proposed a method called Predicting Protein Function using Multiple Kernels (ProMK). ProMK iteratively optimizes the phases of learn-ing optimal weights and reduces the empirical loss of multi-label classifier for each of the labels simultaneously.
In conclusion, many computational methods that inte-grate heterogeneous data for predicting protein (or gene) functions have been suggested. Most of these techniques follow the same basic paradigm: firstly, they generate vari-ous functional association networks by analyzing implicit information of shared functions of proteins from different data sources. Then these individual networks are com-bined into a composite and highly reliable network through a weighted sum. The weight of each individual network represents the contribution of the corresponding data source to the function prediction. A correct setting of these weights is thought to be the key to designing an ef-fective function prediction method. In general, the weights adjustment of individual networks is mainly influenced by human experience and statistical analysis. The major drawback of how each network is weighted is that it varies between different datasets. Furthermore, functions of pro-teins are diverse and some of them only occur under spe-cific conditions. Different functional association networks play different roles and have varying importance in func-tion predicfunc-tion. Combining a heterogeneous data source into a single weighted network could obscure the inherent nature of the protein function.
To address these difficulties, we construct a multilayer protein network which integrates PPI network topology, domain information, and protein complexes. Additionally, we propose an efficient protein function annotation method, named FP-MPN (function prediction based on multilayer protein networks). FP-MPN takes into account the varying influences by multiple connections in the pre-diction of protein function. Given an un-annotated pro-tein, FP-MPN generates candidate functions by examining multilayer networks systematically in turn. The perform-ance of FP-MPN was tested on the well-studied species of
Saccharomyces cerevisiae. Compared to several previously reported protein function prediction algorithms, FP-MPN achieved a greater degree of accuracy in predicting protein function. The experimental results demonstrate that this method, which distinguishes different types of connec-tions in function prediction, is more robust and effective than those methods combining multiple interactions, and that FP-MPN is a good example of this.
Materials and methods
Assessment criteria
The proteins in the PPI network are partitioned into two subsets, the training set and the testing set. Func-tions are removed from the part of proteins in the PPI network artificially. These proteins consist of the test-ing set and the rest proteins form the traintest-ing set. Functions of proteins in the testing set are predicted, using functional information of proteins in the training set. Finally, the comparing results of predicted func-tions with actual funcfunc-tions are used to evaluate the per-formance of protein function prediction algorithms. The cross-validation methods can be classified into two categories: one-out cross-validation and leave-percent-out validation. The leave-one-out cross-validation method puts one protein into the testing set and the remaining proteins into the training set, while the leave-percent-out cross-validation method ran-domly selects a percentage of proteins as the testing set and then puts other proteins into the training set. Each function of proteins in the testing set is assigned with a probability, according to the functions of proteins in the training set. Then a number of top-ranking func-tions are selected to annotate the protein with un-known functions. The quality of prediction depends on the matching results of predicted functions with actual ones. There are two widely used criteria to measure the predicted results. The one is Precision which measures the percentage of predicted functions that match the known functions. The other is Recall which measures the fraction of known functions that are matched by the predicted ones. They can be calculated as follows:
Precision¼ TP
TP þ FP ð1Þ
Recall¼ TP
TP þ FN ð2Þ
where TP (true positive) is the number of predicted func-tions matched by known funcfunc-tions. FP (false positive) is the number of predicted functions that are not matched by known functions. FN (false negative) is the number of known functions that are not matched by predicted func-tions. Selecting more functions can improve the recall, but it may lead to the reduction of precision. F-measure, as the harmonic mean of precision and recall, is another measure to evaluate the performance of a method synthet-ically, which is calculated as follows:
F‐measure¼2 Precision Recall
Precision þ Recall ð3Þ
At the same time, the coverage rate (CR) [21] is also used to evaluate a function prediction algorithm, which shows how many functions of proteins in the testing set can be covered by predicted functions. Given a testing protein set TP = {tp1, tp2, …, tpn}, KF = {kf11, kf12,…, kfij,
…, kfnm} is a list of known function sets of TP, KFi= {kfi1,
kfi2,…, kfil} is a known function set of the protein tpi. PF = {pf11, pf12,…, pfij,…, pfnm’} is a list of predicted function
sets of TP, PFi= {pfi1, pfi2,…, pfil’} is a predicted function
set of the protein tpi. The coverage rate is then defined as
CR¼X
n
i¼1
KFi∩PFi j j=Xn
i¼1 KFi
j j ð4Þ
Motivation
Some methods try to reconstruct more reliable networks by integrating PPI networks and biological information, in order to reduce the impact of random noise on pre-dicting performance. There exist complex and diverse relationships between proteins as demonstrated after in-tegrating biological information. For example, proteins can interact with each other through physical interac-tions which can be identified by biological experiments, co-expression based on time course gene expression data [22, 23], or co-annotation based on gene ontology [24, 25], etc. Most of these methods generate various functional association networks, such as co-expression networks and co-annotation networks. Then a single network can be constructed through a weighted sum of these individual networks. The weight assigned to each individual network reflects its contribution towards protein function annotation, which is computed by a specific similar metric for the related biological data.
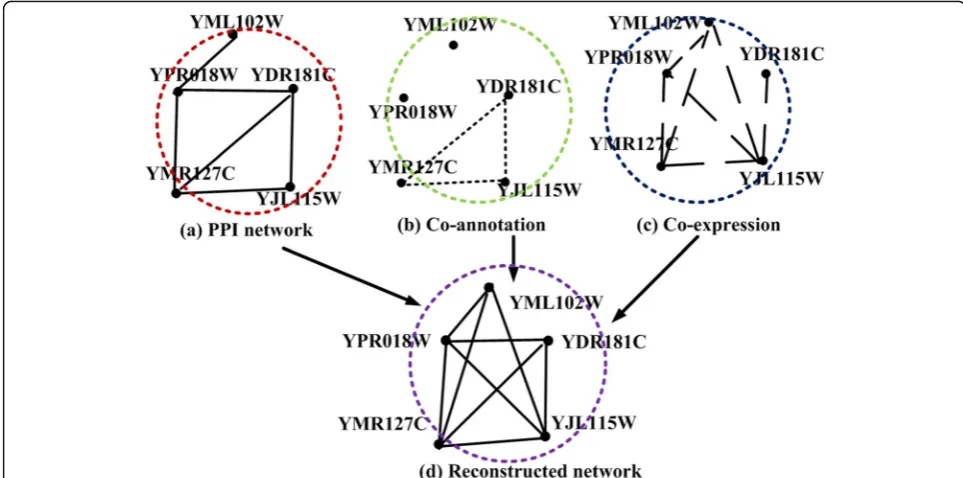
Figure 1 describes an example of constructed networks by integrating the PPI network and heterogeneous data. Figure 1a shows an original physical PPI network, which was derived from experimental methods. In the co-annotation network, as shown in Fig. 1b, there exists a connection between a pair of proteins if they perform the same functions. As for the co-expressed network, it is based on time course gene expression data. For a pro-teinv, its gene expression atndifferent times is denoted as a variate:Gen(v) = {T(v, 1),T(v, 2), …,T(v, n)},T(v, i) denotes the expression level of gene vat the time point
constructed network in Fig. 1d, YPR018W and YDR181C are treated in the same way. The connection (YPR018W, YJL115W) and (YDR181C, YJL115W) has the same status and reliability (they both have an edge clustering coeffi-cient [27] of one). After analyzing the original PPI net-work, co-annotation netnet-work, and co-expression network as shown in Fig. 1, it is demonstrated that the connection (YDR181C, YJL115W) is more reliable than (YPR018W, YJL115W), due to its occurrence in all three networks. YPR018W and YJL115W are only co-expressed at the gene expression level, based on gene expression data. Therefore, YDR181C should contribute more to the func-tion predicfunc-tion of YJL115W, than the protein YPR018W. Connections between YDR181C and YJL115W overlap in the reconstructed network; therefore, it is difficult to de-termine their relationship. The information mentioned above was obtained from the reconstructed network.
The analysis of this experiment suggests that existing methods have two deficiencies. Different biological data sources (i.e., PPI networks, protein domains, and subcellu-lar information) often describe protein properties in differ-ent ways and have differdiffer-ent correlations with differdiffer-ent GO terms. Combining multiple biological data into a single network can not only enhance the matching accuracy (i.e., recall, which measures the fraction of known functions that are matched to the predicted ones) to a certain extent but also introduce a lot of noise functions and reduce predict-ing accuracy (i.e., precision, which measures the percent-age of predicted functions which match the known
functions). As a result, the comprehensive performance improvement is not apparent. Current methods set differ-ent weights for heterogeneous data based on the quality of data sources in order to integrate them into a single net-work. Setting the weighting system for multiple biological data is the key to ensuring the accuracy of protein func-tion predicfunc-tion. These optimal weighting methods rely on empirical analysis and have differences between datasets. Furthermore, these weighting methods may also lead to the inconsistency of these prediction algorithms.
In conclusion, it is inappropriate to combine multiple in-teractions or connections between two proteins, as they often occur under different conditions and play different roles in protein function prediction. In this paper, we de-scribe a multilayer protein network developed by integrat-ing PPI network topology and heterogeneous data. In the constructed network, a pair of proteins has more than one connection which is connected through multiple links. Based on the multilayer protein network, we propose a new method for predicting protein functions, named FP-MPN.
Multilayer protein networks construction
preferential attachment). In reality, connections among nodes in complex networks are diversified. For instance, in social networks, people can contact each other via emails, telephones or MSN, etc., and hence make up a complex network with multi-links. Similarly, in biological networks there are diverse links among proteins via co-expression or co-annotation of the proteins. Multilayer networks are more complex than those with single link.
We consider a multilayer networkG= (V,E), whereV = {v1, v2,…, vn} represents a set of proteins, the edge set
E= {Me1, Me2,…, Mem} consists of edges of L different types representing different relations. That is, Mei= {ei1,
ei2,…, eiL} (0 <i < =m), eij (0 <j < =L) represents the ith connection in thejth layer ofG. We can view the multi-layer network as a graph with vector valued edge infor-mation, i.e., the adjacency matrixAconsists of elements
Aij, who are themselvesL dimensional vectors: Aij= {Aij
(1)
, Aij(2),…, Aij(L)}. An alternative way to approach the problem is to view the multi-graph as a collection ofL,
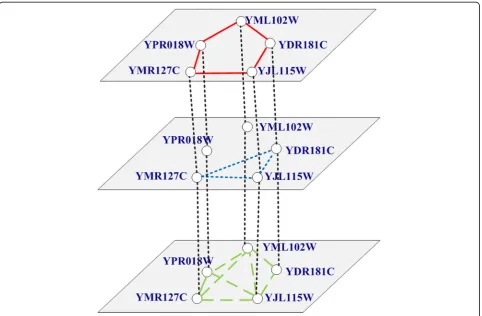
N×Nadjacency matrices {A(1), A(2),…, A(L)}, each corre-sponding to one type of relation. Figure 2 describes an example of a multilayer network according to Fig. 1. The multilayer network consists of five nodes and three
layers. Each layer represents a different level of connec-tion or relaconnec-tionship between nodes.
Functions are often performed by proteins physically interacting with each other, located within the same com-plex, or by having similar structures. A protein consists of one or more domains which have independent functions. There may be discrepancies within domain combinations among different proteins and it is of great significance to recognize these. In this paper, we develop a multilayer net-work by integrating the PPI netnet-work, protein domain infor-mation, and protein complexes. The multilayer network consists of three layers, which include the physical inter-action layer (PIL), sharing domain layer (SDL), and sharing complex layer (SCL). The physical interaction layer is de-rived from original PPI networks. On the SDL, two proteins are physically connected if there is at least one domain common to both of them. On the SCL, each node repre-sents a protein and two nodes are physically connected if they are contained in a common complex. Our previous re-search on protein complex prediction [28] and essential protein identification [26] suggests that the performance of the prediction algorithm based on weighted networks is superior to that based on un-weighted networks. An
explanation for this could be that the weight stands for the reliability of interactions and therefore, weighted networks can be more useful than un-weighted networks in the rep-resentative of PPI networks. In this work, appropriate weighting methods for the three types of connections are developed for the multilayer network.
Methods of Zhang and DCS successfully integrated do-main information and PPI networks, improving the per-formance of protein function prediction. The two methods rely on the same principle, which is to implement function prediction by way of computing similarities between the two proteins. The two methods differ in that the method described by Zhang only computes similarity through the domain information of the protein itself, while the DCS method expands on the extra domain information of the neighbors surrounding it. The two methods are all based on the computing similarity of the combination formula. However, they have the problem of being highly complex to program. To balance the pros and cons of the two methods, this study has set up the weighting computational formula aiming at the interaction of shared domain as follows:
W v i;vj¼
Di∩Dj
2 Dij jDj
; Di≠∅andDj≠∅
0 ; otherwise
8 <
: ð5Þ
where Di and Dj are sets of distinct domain types of vi andvj, respectively.
In a similar way, the weight of sharing complexes be-tweenviandvjon the SCL can be calculated as follow:
W v i;vj¼
Ci∩Cj
2 Cij jCj
; Ci≠∅andCj≠∅
0 ; otherwise
8 <
: ð6Þ
where Ci and Cj are the sets of protein complexes that contained vi and vj, respectively, and Ci∩Cj denotes the set of common protein complexes.
As for the weight of connections on the PIL, we suggest that the weight of an interaction can be reflected by the number of common neighbors between the proteins. Here we use a variant of edge clustering coefficient (ECC) [27] to calculate the weight of protein pairs. Given a pair of proteinsviand vj, the weight of edge (vi,vj) on the PIL is defined as follows:
W vi;vj¼ Ni∩Nj
2
Ni
j j−1
ð Þ Nj−1 ; j jNi >1 and
(
Njj>10;otherwise
ð7Þ
whereNiand Njare sets consisting of all neighbors ofvi andvj, respectively.
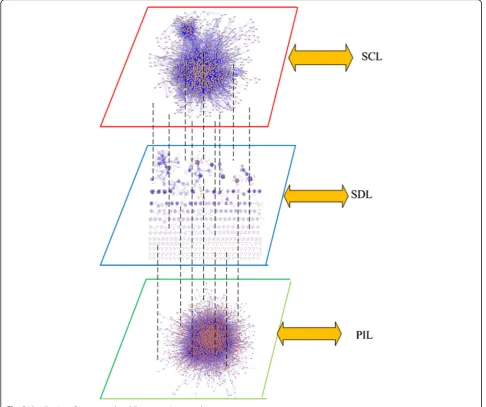
Figure 3 is the visualization of our constructed multi-layer protein network. The network consists of three layers, i.e., PIL, SDL, and SCL. There are the same set of
proteins and different connections sets on these three layers. The multilayer protein network can be modeled as G= (V, E), where V= {v1,v2,…, vn}, E= {Me1, Me2,…,
Mem}. Mei= {ei1, ei2, ei3} (0 <i < =m), eij (0 <j < =3) rep-resents theith connection in thejth layer ofG.
FP-MPN algorithm
Based on the weighted multilayer protein network, we propose a new method for protein functional prediction, named FP-MPN. How to deal with the multilayer net-works is the first problem to be addressed. Current algorithms combine different connections into a single connection when dealing with these complex biological networks. In reality, it is inappropriate to combine mul-tiple connections between two proteins, as they often occur under different conditions and play different roles in protein function prediction. The influences of different types of interactions in protein function prediction are not the same. Combining different interactions into a single event can lead to false positive results. So, it is necessary to deal with multilayer networks in another way.
The different connections among proteins may have different impacts on function prediction. To address this, FP-MPN visits each layer of the multilayer network in turn to generate candidate functions. Each layer has different contribution to predict ion of functions for an un-annotated protein. The FP-MPN algorithm operates in two stages, pre-processing data and predicting functions.
To assign functions of proteins in the testing of a set of probabilities, pre-processing of the multilayer protein work is required. The constructed multilayer protein net-work can be represented as a tensor A= (ai,j,k) n×n×m, wherenis the number of proteins andmis the number of types of interconnections. If nodeiis connected to nodej by thekth type link,ai,j,kis equal to 1; otherwise, it equals 0. Figure 4 depicts the tensor representation of the multi-layer network as shown in Fig. 2. Given a tensorA, we can get a new tensorA(1), which is calculated as follows:
að Þ1
i;j;k¼ ai;j;k=
Xn
j¼1
ai;j;k;
Xn
j¼1
ai;j;k>0;otherwise
(
ð8Þ
Therefore, for each rowiof the tensorA(1),Xn
j¼1
að Þ1 i;j;k¼1or
Xn
j¼1
að Þ1 i;j;k¼0.
Fig. 3Visualization of constructed multilayer protein networks
coefficient (IC) for each layer of the MPN. For the ith layer, its IC value can be calculated as follow:
ICð Þ ¼i 1 2i ð9Þ
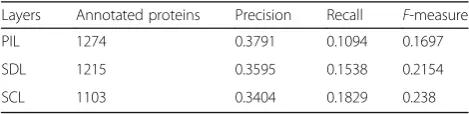
The final score of a predicted function is the weighed sum of scores achieved from all layers. The IC value of a layer is used to present the weight. The layer accessed firstly has higher IC value than that rest of the layers. For this reason, the set up access sequence of each layer in the MPN is critical for the FP-MPN method. This paper ad-dresses the problem of the impact of each layer on the ac-curacy of function predictions using statistical analysis. More detailed statistical results can be found in Table 1.
In this experiment, we used the NC [6] method on the SDL, SCL, and PIL to annotate all unknown proteins, using leave-one-out cross-validation. Then, we calculate the aver-age Precision, Recall, andF-measure to evaluate the signifi-cance of each layer for function prediction. The original PPI network consisted of 5093 proteins with 24,743 inter-actions. For the PIL, SDL, and SCL, there are 13,871, 23,749, and 7337 connections, respectively. Using PIL, there are 2388 proteins, which had at least one neighbor. The number of nodes with neighbors on the SDL and SCL is 2972 and 1494, respectively. From Table 1, it can be seen that SCL archives the highestF-measure among the three layers. In addition, 73.83 % (1103/1494 = 73.83 %) of pro-teins with neighbors on the SCL have been annotated as at least one function. While the proportion of PIL and SDL is 53.35 % (1274/2388 = 53.35 %) and 40.88 % (1215/2972 = 40.88 %), respectively. The SDL gets the second highestF -measure and Recall after SCL among all the layers. Thus, we assigned the highest access sequence to SCL, the sec-ond highest priority to SCL, and the lowest order to PIL.
The second stage of FP-MPN consists of two major steps. The first step is to search its neighbors in the MPN for a particular proteinu with unknown function, to generate candidate functions. Starting from the layer in MPN which has the highest access sequence, the FP-MPN method creates a functions list PF. These lists of functions are derived from neighbors of the testing pro-tein u. Assume that P= {p1, p2,…, pn} is a set of neigh-bors of the proteinuon the first layer,F= {f1,f2,…,fm} is a set of functions of all these proteins inP. The score of
a certain functionfjinFcan be calculated by the follow-ing formula:
S fj ¼
Xn
i¼1
W uð ;piÞ tij; ðj∈½1;mÞ ð10Þ
where W(u,pi) represents the weight of the connection between u and pi. If pi contains function fj, thentij= 1, otherwisetij= 0. Then, the FP-MPN enters the next layer of MPN and continues to predict functions. If a function has been predicted on previous layers, its score is accu-mulated. This process is repeated for the next layer etc., until all the layers are traversed. For a predicted function
f, its final score is the weighed sum of scores on all layers and can be calculated as follow:
Scoreð Þ ¼f X
L
i¼1
IC ið Þ S fð Þi ð11Þ
whereLis the number of layers, IC(i) is the IC value of the ith layer, and S(fi) is the score of function f on the
ith layer calculated using Equation (10). From Equation (9), it is not difficult to deduce the formulaX
m
i¼1
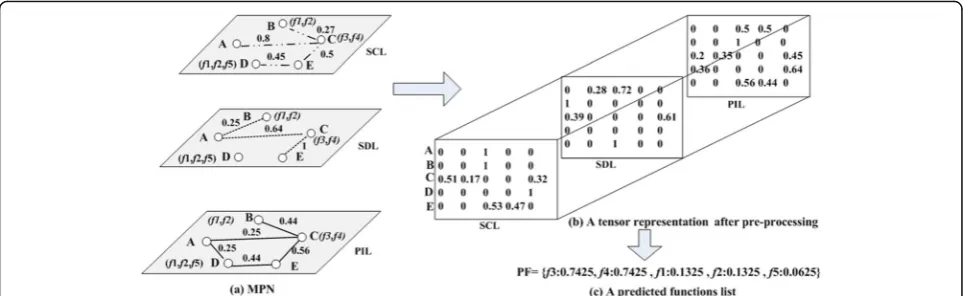
ICð Þi <1, thus ensuring that Score(f) is less than 1 and can be used as a probability of the functionf. Figure 5 illustrates how the FP-MPN method gets the predicted functions list. Figure 5a depicts the constructed multilayer protein net-work. Numbers on the edges of each layer in the MPN represent their corresponding weights. Figure 5b is the tensor representation of MPN after pre-processing, using Equation (8). Figure 5c shows the predicted functions list for the unknown protein A generated by the FP-MPN method. In this example, FP-MPN predicts functions f3 and f4 according to its neighbors on the SCL. FP-MPN computes the scores off3 andf4 on the SCL by Equation (10), which is 1 and 1, respectively. Then, FP-MPN enters the SDL and continues to generate functions. The candidate function set of A’s neighbors on SDL consists of {f1,f2,f3,
f4}. The score off1,f2,f3,f4 on the SDL is 0.28, 0.28, 0.72, and 0.72, respectively. In a similar way, FP-MPN records the functions {f1,f2,f3,f4,f5} on the PIL. Scores of the five func-tions are the same that is 0.5. According to Equation (11), the final score off3 can be calculated as follow:
Scoreð Þ ¼f3 11
2þ0:72 1 22þ0:5
1
23¼0:7425
The final score off1,f2,f4,f5 is 0.1325, 0.1325, 0.7425, and 0.0625, respectively.
The last step of the second stage is to rank functions according to their scores and select a top Nof the ranked functions for the protein with unknown function. This is a key factor which influences the performance of the function prediction algorithm. Existing methods for function selection
Table 1Statistical analysis of the influence of three layers
Layers Annotated proteins Precision Recall F-measure
PIL 1274 0.3791 0.1094 0.1697
SDL 1215 0.3595 0.1538 0.2154
are mainly implemented in two ways: one is represented by the methods of Zhang [15] and DCS [16], which computes the similarity between proteins and endow all functions of the protein with the highest similarity to the protein with unknown function. Another is repre-sented by the method of NC, which forms candidate func-tions set by all the funcfunc-tions of the neighbors, then grades and ranks these functions according to a strategy. We have performed statistical analysis for the overlap of functions be-tween the annotated proteins, in order to determine a solu-tion to funcsolu-tion selecsolu-tion, as shown in Table 2.
The first column in Table 2 refers to the function over-lap between each pair of proteins. The function overover-lap score of two proteinsuandvis defined as follows [28]:
OS uð ;vÞ ¼ jFFu∩Fvj2 uj jFv
j j ð12Þ
whereFu and Fvis the function set of proteins u and v, respectively. The second column in Table 2 has shown statistical results of overlaps of all pairs of proteins with shared functions, among which the overlap score of 54.22 % protein pairs has exceeded 0.8. As many proteins have only one function, we made statistics again after ex-cluding those with only one function (the result is shown in the third column). It turned out that the overlap score of more than half of the protein pairs falls in (0.4, 0.6], and
the protein pairs with overlap score over 0.6 accounts for only 11.99 %. Based on these statistical results, the FP-MPN method adopts the second strategy of function selection mentioned above.
All functions are sorted in descending order accord-ing to their scores. The top N of these functions can be selected to annotate the testing protein u, where N is the number of functions of the protein most closely associated with u. In this paper, we used the highest weight of a pair of proteins to evaluate the close de-gree of all their layers. We limited the number of pre-dicted functions to be less than or equal to that of the annotated GO terms in the protein with highest weight to u. Algorithm FP-MPN illustrates the overall framework to predict protein functions based on multilayer protein networks.
Fig. 5ais the constructed multilayer protein network.bis the tensor representation of MPN after pre-processing.cis the predicted functions list for the un-known protein A generated by the FP-MPN method
Table 2Statistical analysis of overlaps of functions
OS Proportion (all proteins) Proportion (proteins with more than one function)
(0, 0.2] 2.81 % 5.64 %
(0.2, 0.4] 13.90 % 27.95 %
(0.4, 0.6] 27.05 % 54.41 %
(0.6, 0.8] 2.02 % 4.06 %
Results and discussion
Experimental data
TheS. cerevisiae(yeast) PPI networks are widely used in the research of network-based function prediction methods, because the species of yeast has been well char-acterized by knockout experiments and is the most complete and convincible. Here, we also adopt the yeast PPI network to test our method. We have applied our method and four other competing algorithms by integrat-ing network topological features, domain information, and protein complexes data: Zhang [15], DCS [16], domain combination similarity in context of protein complexes (DSCP) [16], and PON [17] on DIP data [29]. DSCP is a variant of DSC, which combines protein complex infor-mation. The DIP dataset, updated to Oct. 1, 2014, consists of 5017 proteins and 23,115 interactions among the pro-teins. The self-interactions and the repeated interactions are filtered out in DIP data. The annotation data of pro-teins used for method validation is the latest version (2012.3.3) downloaded from GO official website [30]. The GO system consists of three separate categories of annota-tions, namely molecular function (MF), biological process (BP), and cellular component (CC). The predictions are validated separately for each of the three GO categories. To avoid too special or too general, only those GO terms that annotate at least 10 and at most 200 proteins will be kept in the experiments. After processing by this step, the number of GO terms is 267. The domain data is derived from Pfam database [31], including 1107 different types of domains among 3056 proteins. As for the protein complex information, we used the dataset CYC2008 [32], which consists of 408 protein complexes involving 1492 proteins in the yeast PPI network. The GO data and Pfam domain data are transformed to use the ensemble genome protein entries because the original PPI network uses such a label-ing system.
Effect of access sequence of each layer
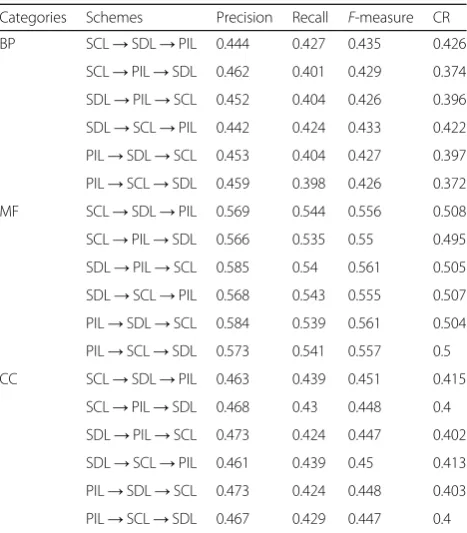
The access sequence of each layer in the MPN plays an important role in the performance of the proposed FP-MPN method. In this paper, the priority of each layer was determined using statistical analysis. Different schemes were used to sequence layers of the MPN and then compare these results to verify the effectiveness of the MPN method. Table 3 depicts the results of FP-MPN when different schemes were adopted. Table 3 demonstrates that the first scheme (SCL→SDL→PIL), in which SCL was visited first and the SDL was visited second, performed the highest in terms of BP (biological process), MF (molecular function), and CC (cellular component). The comparison of these results with the statistical results show they are in agreement. Experi-mental results also verify the method used to access the sequence of each layer in the FP-MPN.
Leave-one-out cross-validation
A representative set of function prediction algorithms was run: FP-MPN, Zhang, DCS, DSCP, and PON, and their performance was examined using the leave-one-out cross-validation method. In the DIP PPI network, 2870, 1592, and 2427 proteins from a total of 5017 proteins were annotated by BP, MF, and CC, respectively. We an-alyzed the overall prediction performance of FP-MPN on these annotated proteins, as well as four other
Table 3The influence of access sequence
Categories Schemes Precision Recall F-measure CR
BP SCL→SDL→PIL 0.444 0.427 0.435 0.426
SCL→PIL→SDL 0.462 0.401 0.429 0.374
SDL→PIL→SCL 0.452 0.404 0.426 0.396
SDL→SCL→PIL 0.442 0.424 0.433 0.422
PIL→SDL→SCL 0.453 0.404 0.427 0.397
PIL→SCL→SDL 0.459 0.398 0.426 0.372
MF SCL→SDL→PIL 0.569 0.544 0.556 0.508
SCL→PIL→SDL 0.566 0.535 0.55 0.495
SDL→PIL→SCL 0.585 0.54 0.561 0.505
SDL→SCL→PIL 0.568 0.543 0.555 0.507
PIL→SDL→SCL 0.584 0.539 0.561 0.504
PIL→SCL→SDL 0.573 0.541 0.557 0.5
CC SCL→SDL→PIL 0.463 0.439 0.451 0.415
SCL→PIL→SDL 0.468 0.43 0.448 0.4
SDL→PIL→SCL 0.473 0.424 0.447 0.402
SDL→SCL→PIL 0.461 0.439 0.45 0.413
PIL→SDL→SCL 0.473 0.424 0.448 0.403
PIL→SCL→SDL 0.467 0.429 0.447 0.4
Table 4Overall comparisons of various methods
Categories Methods MP Precision Recall F-measure CR
BP FP-MPN 1595 0.444 0.427 0.435 0.426
Zhang 810 0.225 0.220 0.222 0.216
DCS 1148 0.312 0.314 0.313 0.327
DSCP 1298 0.357 0.359 0.358 0.363
PON 572 0.150 0.140 0.145 0.161
MF FP-MPN 995 0.569 0.544 0.556 0.508
Zhang 608 0.332 0.332 0.332 0.316
DCS 839 0.461 0.462 0.461 0.441
DSCP 927 0.518 0.515 0.516 0.489
PON 413 0.223 0.216 0.22 0.228
CC FP-MPN 1265 0.463 0.439 0.451 0.415
Zhang 561 0.197 0.196 0.197 0.198
DCS 876 0.306 0.309 0.307 0.315
DSCP 1014 0.364 0.363 0.364 0.356
methods. The results are shown in Table 4, which in-clude the average Precision, Recall, and F-measure and coverage rate (CR) of the various algorithms.
In Table 4, MP is the number of proteins which have been matched to at least one function with known func-tion. Among the five methods, FP-MPN and PON are two methods of selecting top-ranking functions from the set of candidate functions, whereas the methods of Zhang, DCS, and DSCP are three methods of endowing un-annotated proteins with all functions of proteins with the highest similarity values. From Table 4, we can see that FP-MPN can predict functions for more proteins and archive higher performance than the other four methods, with respect to BP, MF, and CC. For BP, theF -measure of FP-MPN is 95.95, 38.98, 21.51, and 200 % higher than Zhang, DCS, DSCP, and PON, respectively. After integrating protein complexes and domains, DSCP improves the performance compared to DCS. FP-MPN outperforms DSCP, including the F-measure and cover-age rate. When looking at MF, the performances of these five methods are better. The F-measure of FP-MPN is 67.47, 20.61, 7.75, and 152.73 % higher than the results using the methods of Zhang, DCS, DSCP, and PON, re-spectively. As for CC, the F-measure of FP-MPN is 128.93, 46.91, 23.9, and 215.38 % higher than the results using the methods of Zhang, DCS, DSCP, and PON, respectively. Compared to BP and MF, FP-MPN had a higherF-measure growth rate compared to other methods.
A comprehensive comparison of the performances of these five methods was undertaken using a Precision-Recall (PR) curve to evaluate the global performance of every method in terms of the different strategies of func-tion selecfunc-tion adopted by the five predicfunc-tion methods. The same number of functions was chosen for each method, i.e., the top K functions of each prediction method. When examining the methods of Zhang, DCS, and DSCP, the top M (M< =K) proteins which had the highest similarity value were selected and the top K functions from the function list as a predictor of func-tions was listed in descending order according to the maximum value of protein similarity (e.g., given a certain functionFifound in more than one protein, the score of
Fiis the similarity value of this protein when compared to the tested proteins). As for the FP-MPN and PON methods, the topKGO terms are chosen to assign func-tional properties to the unknown proteins (Kranges from 1 to 50). The areas under the curve (AUC) for FP-MPN and other methods are used to compare their performance. AUC is considered to be a standard method to assess the accuracy of predictive distribution models. From Fig. 6, we can see that FP-MPN outperforms other methods in terms of BP, MF, and CC. For example, on the BP, the AUC of FP-MPN is 347.67, 53.76, 31.76, and 195.46 % higher than Zhang, DCS, DSCP, and PON, respectively.
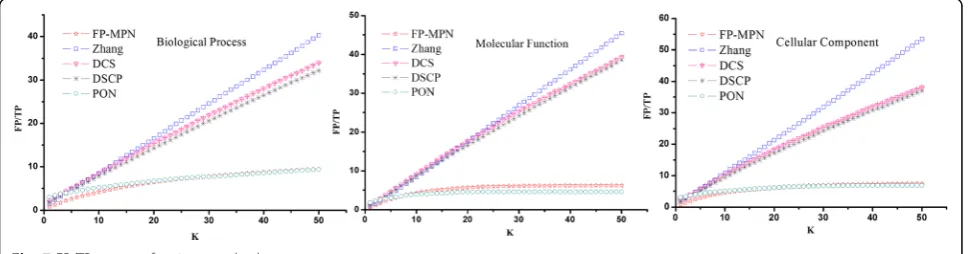
The number of incorrect predicted functions when matching a function correctly using these methods was Fig. 6The precision-recall curves of FP-MPN compared to other four existing algorithms
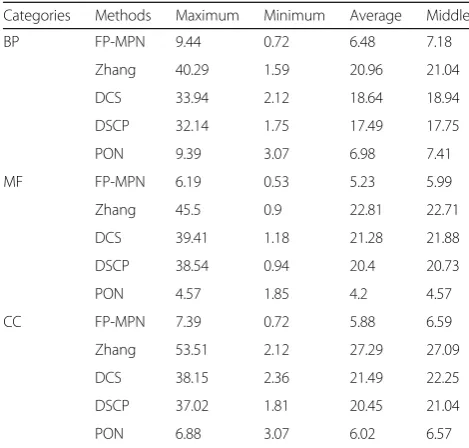
determined. For each testing protein, the topKfunctions are selected as its predicted ones, and TP and FP values are calculated according to its known functions. The TP and FP values of all testing proteins are added to calcu-lated TP and FP pairs. Selecting different values of K (ranging from 1 to 50), a FP/TP curve can be generated with different TP and FP pairs, as shown in Fig. 7. Figure 7 clearly shows that the curvature of FP-MPN curve is the lowest as compared to others, which means that, if matched functions are the same, the number of functions incorrectly matched by FP-MPN is the least. Table 5 lists the statistical results of the various FP/TP curves, including maximum value, the minimum value, the average value, and the middle value. These results in-dicates that to match a protein function correctly, the number of average noise functions (i.e., predicted function incorrectly matched) produced by FP-MPN is smaller compared to the Zhang, DCS, and DSCP methods. FP-MPN has comparable results with PON’s. For example, on the BP, the number of average noise functions of the
methods of FP-MPN, Zhang, DCS, DSCP, and PON is 7, 21, 19, 18, and 7, respectively. The results illustrate that FP-MPN has the high prediction efficiency and accuracy.
Tenfold cross-validation
The performance of FP-MPN was tested using leave-one-out validation. Experimental results demonstrate improvements when predicting protein functions by the FP-MPN method compared to competing methods. However, in practical applications, there are much more proteins without annotations, instead of one unknown protein. In this section, we will use the leave-percent-out cross-validation method to verify the effectiveness of FP-MPN on PPI networks that have less functional informa-tion. Tenfold cross-validation is a widely used leave-percent-out cross-validation, which is used in this paper. The tenfold cross-validation requires the entire set of ex-amples to be divided into ten equal sets randomly. Nine of the ten parts are used for training, and one part is used for testing. This is repeated ten times, each time using another testing set. We evaluate the performance of each method using area under precision-recall (PR) curve. Figure 8 illustrates the PR curve using tenfold cross-validation, in terms of biological processes, mo-lecular functions, and cellular components. When com-pared to the results of leave-one-out cross-validation, the performance of all methods using tenfold cross-validation decrease slightly, due to the decrease of the number of training proteins. It appears that Fig. 8 is very similar to Fig. 6, except for the coordinate values of the various methods. Figure 8 demonstrates that FP-MPN still outperforms other methods when tenfold cross-validation is used to test all methods.
Analysis of the overlaps and differences between FP-MPN and other methods
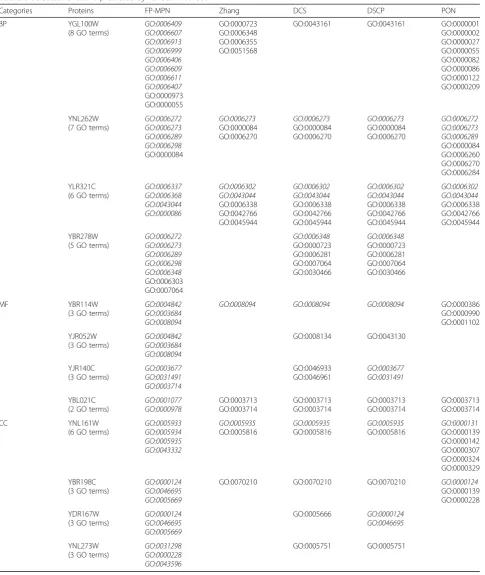
To further analyze the differences between the FP-MPN and other methods, we selected 12 testing proteins and predicted their functions using the five methods. Table 6 lists the functions of these selected proteins predicted by
Table 5Statistical analysis of FP/TP of various methods
Categories Methods Maximum Minimum Average Middle
BP FP-MPN 9.44 0.72 6.48 7.18
Zhang 40.29 1.59 20.96 21.04
DCS 33.94 2.12 18.64 18.94
DSCP 32.14 1.75 17.49 17.75
PON 9.39 3.07 6.98 7.41
MF FP-MPN 6.19 0.53 5.23 5.99
Zhang 45.5 0.9 22.81 22.71
DCS 39.41 1.18 21.28 21.88
DSCP 38.54 0.94 20.4 20.73
PON 4.57 1.85 4.2 4.57
CC FP-MPN 7.39 0.72 5.88 6.59
Zhang 53.51 2.12 27.29 27.09
DCS 38.15 2.36 21.49 22.25
DSCP 37.02 1.81 20.45 21.04
PON 6.88 3.07 6.02 6.57
various methods. The third to the seventh column of Table 6 lists functions predicted by the FP-MPN, Zhang, DCS, DSCP, and PON methods, respectively. In this table, functions in italics represent the matched
functions of the testing proteins, the rest are mis-matched functions. In Table 6, we can see that FP-MPN can record more correct functions and fewer error func-tions compared to the other competing methods.
Table 6Selected functions predicted by various methods
Categories Proteins FP-MPN Zhang DCS DSCP PON
BP YGL100W
(8 GO terms) GO:0006409GO:0006607
GO:0006913 GO:0006999 GO:0006406 GO:0006609 GO:0006611 GO:0006407 GO:0000973 GO:0000055 GO:0000723 GO:0006348 GO:0006355 GO:0051568
GO:0043161 GO:0043161 GO:0000001 GO:0000002 GO:0000027 GO:0000055 GO:0000082 GO:0000086 GO:0000122 GO:0000209 YNL262W (7 GO terms)
GO:0006272 GO:0006273 GO:0006289 GO:0006298 GO:0000084 GO:0006273 GO:0000084 GO:0006270 GO:0006273 GO:0000084 GO:0006270 GO:0006273 GO:0000084 GO:0006270 GO:0006272 GO:0006273 GO:0006289 GO:0000084 GO:0006260 GO:0006270 GO:0006284 YLR321C (6 GO terms)
GO:0006337 GO:0006368 GO:0043044 GO:0000086 GO:0006302 GO:0043044 GO:0006338 GO:0042766 GO:0045944 GO:0006302 GO:0043044 GO:0006338 GO:0042766 GO:0045944 GO:0006302 GO:0043044 GO:0006338 GO:0042766 GO:0045944 GO:0006302 GO:0043044 GO:0006338 GO:0042766 GO:0045944 YBR278W (5 GO terms)
GO:0006272 GO:0006273 GO:0006289 GO:0006298 GO:0006348 GO:0006303 GO:0007064 GO:0006348 GO:0000723 GO:0006281 GO:0007064 GO:0030466 GO:0006348 GO:0000723 GO:0006281 GO:0007064 GO:0030466 MF YBR114W
(3 GO terms)
GO:0004842 GO:0003684 GO:0008094
GO:0008094 GO:0008094 GO:0008094 GO:0000386 GO:0000990 GO:0001102
YJR052W (3 GO terms)
GO:0004842 GO:0003684 GO:0008094
GO:0008134 GO:0043130
YJR140C (3 GO terms)
GO:0003677 GO:0031491 GO:0003714 GO:0046933 GO:0046961 GO:0003677 GO:0031491 YBL021C (2 GO terms)
GO:0001077
GO:0000978 GO:0003713GO:0003714
GO:0003713 GO:0003714 GO:0003713 GO:0003714 GO:0003713 GO:0003714 CC YNL161W
(6 GO terms) GO:0005933GO:0005934
GO:0005935 GO:0043332
GO:0005935
GO:0005816 GO:0005935GO:0005816 GO:0005935GO:0005816 GO:0000131GO:0000139 GO:0000142 GO:0000307 GO:0000324 GO:0000329
YBR198C (3 GO terms)
GO:0000124 GO:0046695 GO:0005669
GO:0070210 GO:0070210 GO:0070210 GO:0000124 GO:0000139 GO:0000228
YDR167W (3 GO terms)
GO:0000124 GO:0046695 GO:0005669 GO:0005666 GO:0000124 GO:0046695 YNL273W (3 GO terms)
GO:0031298 GO:0000228 GO:0043596
In addition, we continued to look for sources of func-tions predicted by various methods. For the protein YGL100W, the functions set predicted by the method of Zhang consists of GO:0000723, GO:0006348, GO:0006355, and GO:0051568, which were derived from the protein YAR003W. In this study, YAR003W is regarded as having the most similar domain to YGL100W among all the proteins. Unfortunately, these predicted functions are mis-matched by the real functions of YGL100W. As for DCS and DSCP, the protein YCL039W is considered to be the most similar in domain to YGL100W than the other known proteins. Similarly, the predicted functions of GO:0043161, which were derived from YCL039W, created errors in predicted functions for YAR003W. Predicted functions by PON were GO:0000001, GO:0000002, GO:0000027, GO:0000055, GO:0000082, GO:0000086, GO:0000122, and GO:0000209, which were derived from YBR234C, YJL112W, YKL021C, YDR267C, YDR364C, YFL009W, YLR055C, and YIL046W, respectively. All of these proteins have at least one domain with YGL100W. So, we can draw a conclusion that we cannot predict func-tions for the protein YGL100W based on domain informa-tion only. Our FP-MPN predicts ten funcinforma-tions, in which eight are matched and two are mismatched. These matched functions were derived from protein YDL116W, which is located in the transcription factor TFIID complex with the YGL100W protein. FP-MPN successfully matched eight functions for the protein YGL100W, with the help of protein complexes information. The results suggest that complexes information improves the accuracy of protein function prediction. However, protein complexes data is also used in the DSCP methods, which has a different pre-dictor results compared to that of FP-MPN. This could be due to the difference in how the data is used between the two methods. For the protein YNL262W, the methods of Zhang, DCS, and DSCP created the same function lists, consisting of GO:0006273, GO:0000084, and GO:0006270. These three functions are derived from the protein YNL102W, which has common domains with the pro-tein YNL262W. In the predicted functions list, only GO:0006273 is correct as a function for the protein YNL102W. Compared to the methods of Zhang, DCS, and DSCP, PON can identify two other correct functions GO:0006273 and GO:0006289 from another protein YDL102W, which shares domains with the protein YNL102W. The result suggests that annotating proteins according to multiple known proteins is more reliable than predicting functions from a single protein. Besides the three matched functions identified by other methods, FP-MPN identifies a new correct function GO:0006298. In this example, FP-MPN predicts more matched func-tions compared to other methods, due to the domain and complexes information being used. This phenomenon suggests that proper use of multiple heterogeneous
biological data can effectively improve the performance of function prediction algorithms. The analysis for the rest of the ten proteins described above is consistent with that of YGL100W and YNL262W.
Efficiency analysis
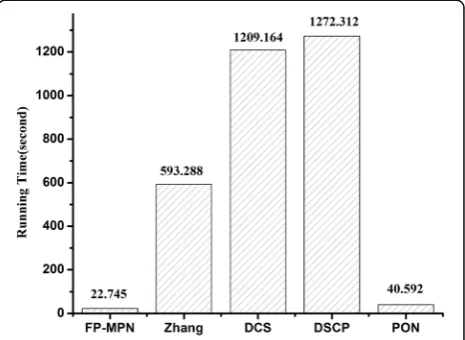
To compare the efficiency of these methods, we ran FP-MPN and competing methods under the same conditions and looked at their running time. All methods in this paper were run on a notebook computer with Inter(R) Core(TM) i5-4300M 2.6 GHz CPU and 4 GB RAM. Figure 9 illustrates a comparison of the running time of FP-MPN and the other four methods used for predicting protein functions. The methods of Zhang, DCS, and DSCP are all based on combined number computation. So, they have the disadvantage of being time consuming. From Fig. 9, it can be seen that FP-MPN is extremely fast, 25, 52, 55, and 0.8 times faster than the methods of Zhang, DCS, DSCP, and PON, respectively. As protein-protein interactions are accumulating, FP-MPN can be used in larger scale PPI networks.
Conclusions
Different types of interactions or connections play differ-ent roles in protein function prediction. Combining mul-tiple interactions or connections between two proteins could reduce the impact of false negatives and increase the number of correct predicted functions. However, there appears to be more false functions identified compared to positive functions, thus the overall performance of func-tion predicfunc-tion would not be improved greatly. In this paper, multilayer protein networks (MPN) are constructed based on topological characteristics, protein domain infor-mation, and protein complex inforinfor-mation, with each layer given various priorities. Based on the constructed net-works, we proposed a new method, named FP-MPN, to predict the functions of a particular protein. The proposed
method is based around visiting each layer of the MPN in turn and forming a set of candidate neighbors with known functions. The set of predicted functions is then formed and all of these functions are scored and sorted. Each layer contributes differently to the predicted functions in the un-annotated protein. The experimental results indicate that it is an effective method to predict protein functions.
Additional file
Additional file 1:Supplementary Data are available, including Complexes.txt: The CYC2008 dataset, which consists of 408 protein complexes involving 1492 proteins in the yeast PPI network.
DIP141001.txt: The DIP dataset, updated to Oct.1, 2014, consists of 5017 proteins and 23115 interactions among the proteins. Domain.txt: The domain data derived from Pfam database, including 1107 different types of domains among 3056 proteins. FP-MPN.exe: The FP-MPN algorithm. FPMPN.txt: The predicted results by FP-MPN. GO_C.txt, GO_F.txt and GO_P.txt: Represents cellular component (CC), molecular function (MF) and biological process (BP), respectively. (ZIP 437 kb)
Acknowledgements
Not applicable
Funding
This work is supported in part by the National Natural Science Foundation of China under Grant No. 11501054; the Science and Technology Plan Project of Hunan Province, China No. 2015GK3072; the Natural Science Foundation of Hunan Province, China No. 2016JJ3016; the National Scientific Research Foundation of Hunan Province Education Department, China No. 16A020, 16B028, No. 16C0133, No. 16C0137; and the Education Scientific Planning Project of Hunan Province, China No. XJK016BGD078.
Availability of data and materials
Additional file 1: Supplementary Data are available, including the FP-MPN method (FP-MPN.exe), protein complexes information (complexes.txt), DIP PPI networks (DIP141001.txt), protein domain information (domain.txt), and GO profiles (GO_P.txt, GO_C.txt, GO_F.txt).
Authors’contributions
BHZ and SH obtained the protein-protein interaction data, gene ontology annotation data, protein complex data, and domain data. BHZ and SH de-signed the new method, FP-MPN, and analyzed the results. BHZ, XYL, and SH drafted the manuscript together. FZ, QLT, and WYN participated in revising the draft. All authors have read and approved the manuscript.
Competing interests
The authors declare that they have no competing interests.
Consent for publication
Not applicable.
Ethics approval and consent to participate
Not applicable.
Received: 18 July 2016 Accepted: 14 September 2016
References
1. Liu B, Fang L, Liu F, Wang X, Chen J, Chou K-C. Identification of real MicroRNA precursors with a pseudo structure status composition approach. PLoS One. 2015;10(3):e0121501.
2. Ito T, Chiba T, Ozawa R, et al. A comprehensive two-hybrid analysis to explore the yeast protein interactome. Proc Natl Acad Sci. 2001;98(8):4569–74. 3. Uetz P, Giot L, Cagney G, et al. A comprehensive analysis of protein–protein
interactions in Saccharomyces cerevisiae. Nature. 2000;403(6770):623–7.
4. Gavin AC, et al. Functional organization of the yeast proteome by systematic analysis of protein complexes. Nature. 2002;415(6868):141–7. 5. Enright AJ, Van Dongen S, Ouzounis CA. An efficient algorithm for
large-scale detection of protein families. Nucleic Acids Res. 2002;30(7):1575–84. 6. Schwikowski B, Uetz P, Fields S. A network of protein–protein interactions in
yeast. Nat Biotechnol. 2000;18(12):1257–61.
7. Hishigaki H, Nakai K, Ono T, et al. Assessment of prediction accuracy of protein function from protein–protein interaction data. Yeast. 2001;18(6):523–31. 8. Chua HN, Sung WK, Wong L. Exploiting indirect neighbours and topological
weight to predict protein function from protein–protein interactions. Bioinformatics. 2006;22(13):1623–30.
9. Cao M, Zhang H, Park J, et al. Going the distance for protein function prediction: a new distance metric for protein interaction networks. PLoS One. 2013;8(10):e76339.
10. Nabieva E, Jim K, Agarwal A, et al. Whole-proteome prediction of protein function via graph-theoretic analysis of interaction maps. Bioinformatics. 2005;21 suppl 1:i302–10.
11. Chi X, Hou J. An iterative approach of protein function prediction. BMC Bioinformatics. 2011;12(1):437.
12. Wu Z, Zhao X, Chen L. Identifying responsive functional modules from protein-protein interaction network. Mol Cells. 2009;27(3):271–7. 13. Lee J, Gross SP, Lee J. Improved network community structure improves
function prediction. Sci Rep. 2013;3:2197.
14. Cozzetto D, Buchan DWA, Bryson K, et al. Protein function prediction by massive integration of evolutionary analyses and multiple data sources. BMC Bioinformatics. 2013;14 Suppl 3:S1.
15. Zhang S, Chen H, Liu K, et al. Inferring protein function by domain context similarities in protein-protein interaction networks. BMC Bioinformatics. 2009;10(1):395.
16. Peng W, Wang J, Cai J, et al. Improving protein function prediction using domain and protein complexes in PPI networks. BMC Syst Biol. 2014;8(1):35. 17. Liang S, Zheng D, Standley DM, et al. A novel function prediction approach
using protein overlap networks. BMC Syst Biol. 2013;7(1):61.
18. Gong Q, Ning W, Tian W. GoFDR: a sequence alignment based method for predicting protein functions. Methods. 2016;93:3-14.
19. Kumar DS, Reddy PK. Improved approach for protein function prediction by exploiting prominent proteins: IEEE International Conference on Data Science and Advanced Analytics (DSAA). 2015. p. 1–7.
20. Yu G, Rangwala H, Domeniconi C, et al. Predicting Protein Function Using Multiple Kernels. IEEE/ACM Trans Comput Biol Bioinform. 2015;12(1):219–33. 21. Wu M, Li X, Kwoh CK, et al. A core-attachment based method to detect
protein complexes in PPI networks. BMC Bioinformatics. 2009;10(1):169. 22. Wang J, Peng X, Li M, et al. Construction and application of dynamic
protein interaction network based on time course gene expression data. Proteomics. 2013;13(2):301–12.
23. Zhao BH, Wang JX, Li XY, et al. Essential Protein Discovery based on a Combination of modularity and conservatism. Methods. 2016. doi:10.1016/j. ymeth.2016.07.005.
24. Liu W, Li D, Zhu Y, et al. Reconstruction of signalling network from protein interactions based on function annotations. IEEE/ACM Trans Comput Biol Bioinform. 2013;10(2):514–21.
25. Zhao BH, Wang JX, Li M, et al. A new method for predicting protein functions from dynamic weighted interactome networks. IEEE Trans NanoBioscience. 2016;15(2):415–24.
26. Zhao BH, Wang JX, Li M, et al. Prediction of essential proteins based on overlapping essential modules. IEEE Trans NanoBioscience. 2014;13(4):415–24. 27. Peng W, Wang J, Zhao B, et al. Identification of protein complexes using
weighted PageRank-Nibble algorithm and core-attachment structure. IEEE/ ACM Trans Comput Biol Bioinform. 2015;12(1):179–92.
28. Zhao B, Wang J, Li M, et al. Detecting protein complexes based on uncertain graph model. IEEE/ACM Trans Comput Biol Bioinform. 2014;11:486–97. 29. Xenarios X, et al. DIP: the database of interacting proteins. Nucleic Acids
Res. 2000;28:289–91.
30. Ashburner M, Ball CA, Blake JA, et al. Gene ontology: tool for the unification of biology. Nat Genet. 2000;25(1):25–9.
31. Bateman A, Coin L, Durbin R, et al. The Pfam protein families database. Nucleic Acids Res. 2004;32 suppl 1:D138–41.