Heritable patterns of tooth decay in the
permanent dentition: principal components and
factor analyses
Shaffer
et al.
R E S E A R C H A R T I C L E
Open Access
Heritable patterns of tooth decay in the
permanent dentition: principal components and
factor analyses
John R Shaffer
1,2,3,12*, Eleanor Feingold
1,2,3,5, Xiaojing Wang
2,3,4,6, Karen TCuenco
2,3,4,6,7, Daniel E Weeks
1,5,
Rebecca S DeSensi
2,3,4,6, Deborah E Polk
2,3,7,8, Steve Wendell
2,3,4,6, Robert J Weyant
2,7, Richard Crout
2,9,
Daniel W McNeil
10and Mary L Marazita
1,2,3,4,6,11Abstract
Background:Dental caries is the result of a complex interplay among environmental, behavioral, and genetic factors, with distinct patterns of decay likely due to specific etiologies. Therefore, global measures of decay, such as the DMFS index, may not be optimal for identifying risk factors that manifest as specific decay patterns, especially if the risk factors such as genetic susceptibility loci have small individual effects. We used two methods to extract patterns of decay from surface-level caries data in order to generate novel phenotypes with which to explore the genetic regulation of caries.
Methods:The 128 tooth surfaces of the permanent dentition were scored as carious or not by intra-oral
examination for 1,068 participants aged 18 to 75 years from 664 biological families. Principal components analysis (PCA) and factor analysis (FA), two methods of identifying underlying patterns withouta priorisurface
classifications, were applied to our data.
Results:The three strongest caries patterns identified by PCA recaptured variation represented by DMFS index (correlation, r = 0.97), pit and fissure surface caries (r = 0.95), and smooth surface caries (r = 0.89). However, together, these three patterns explained only 37% of the variability in the data, indicating thata prioricaries measures are insufficient for fully quantifying caries variation. In comparison, the first pattern identified by FA was strongly correlated with pit and fissure surface caries (r = 0.81), but other identified patterns, including a second pattern representing caries of the maxillary incisors, were not representative of any previously defined caries indices. Some patterns identified by PCA and FA were heritable (h2= 30-65%, p = 0.043-0.006), whereas other patterns were not, indicating both genetic and non-genetic etiologies of individual decay patterns.
Conclusions:This study demonstrates the use of decay patterns as novel phenotypes to assist in understanding the multifactorial nature of dental caries.
Keywords:Dental caries genetics, Heritability, Permanent dentition, Pit and fissure surfaces, Smooth surfaces, Tooth surfaces, Principal components analysis, Factor analysis, Patterns of tooth decay, Patterns of dental caries
Background
Dental caries is a disease affecting most adults and caused by the complex interplay of numerous environ-mental, behavioral [1,2], and genetic risk factors [3-12]. The etiology of dental caries is further complicated by
the non-uniform risk across tooth surfaces of the full dentition leading to distinct patterns of dental decay, as previously described [13-25]. Patterns of decay have been used to explore caries etiology under the assump-tion that different risk factors lead to distinct caries pat-terns. A well-known example is the maxillary anterior pattern of decay (i.e.,“baby bottle”caries) in young chil-dren due in part to feeding behaviors [20,24]. Despite prevailing evidence of the importance of caries patterns,
* Correspondence: [email protected]
1
Department of Human Genetics, Graduate School of Public Health, University of Pittsburgh, Pittsburgh, PA 15261, USA
Full list of author information is available at the end of the article
the most common indices used for studying the epide-miology of caries are DMFT and DMFS (i.e., counts of the number of decayed, missing, or filled teeth/surfaces), which do not assess specific decay patterns. As global measures of tooth decay, DMFT and DMFS indices may not be optimal for investigating genetic and environ-mental factors that manifest as specific patterns of caries across the dentition. Separating the global level of caries into components or patterns with distinct etiologies may be critical for identifying risk factors of modest effect sizes, such as specific genetic loci contributing to tooth decay.
Previous descriptions of caries patterns have usually assumed and compared a prioriclassifications of tooth surfaces [14-22,25], which often differed among studies, leading to inconsistencies that demonstrate the limited utility of a priorisurface classifications. A few studies have modeled the patterns of childhood tooth decay withouta prioriassumptions and have identified distinct patterns reflecting caries of the maxillary incisor sur-faces and pit and fissure sursur-faces, among others [13,23,24].
To our knowledge, no assessment of permanent denti-tion caries patterns in adults without a priori surface classifications has previously been performed. In this study we utilized two related analytic methodologies for identifying the underlying patterns within our dataset: principal components analysis (PCA) and factor analysis (FA). Three specific purposes of this study were (1) to identify the patterns of dental caries in the permanent dentition of adults without a priori assumptions about tooth surface classifications; (2) to determine the rela-tionship between identified patterns of decay and a
priori measures of decay such as DMFS index, decay of pit and fissure surfaces, and decay of smooth surfaces; and (3) to assess the heritability of identified patterns of decay.
Methods
Recruitment and data collection
The Center for Oral Health Research in Appalachia (COHRA) was created to identify the community-, family-, and individual-level predictors of oral health outcomes in the Appalachian population [26], a vulner-able subpopulation with poorer oral health compared to the greater US population [27-29]. COHRA participants were recruited by household as previously described [6,7,26], whereby eligible households were required to include at least one biological parent-offspring pair with the child being 1 to 18 years of age. All members of eli-gible households were invited to participate without regard to their oral health status, demography, or biolo-gical or legal relationships. Written informed consent was provided by all adult participants. Assent with
parent or guardian written consent was provided on behalf of all child participants. The study was approved by the COHRA research committee and the Institutional Review Boards of the University of Pittsburgh and West Virginia University.
In total, 732 households were recruited, which com-prised 2,663 individuals from 740 biological kinships of 1 to 20 family members (mean = 4.72 members). Some kinships spanned multiple households, whereas other households contained multiple kinships. Reported famil-ial relationships were validated using panels of ancestry-informative [30] and whole-genome [31] genetic marker data provided by the Center for Inherited Disease Research at Johns Hopkins University and quality checked jointly by study investigators and the Coordi-nating Center for the NIH Genes and Environment Initiative (GENEVA; [32]).
Dental caries was assessed via visual inspection with a dental explorer during intra-oral dental examinations conducted by dentists or research dental hygienists calibrated with respect to a reference dentist at least once per year. Inter- and intra-examiner concordances of caries assessments were high [7,26]. Each tooth sur-face was scored as sound, pre-cavitated, decayed, filled, missing due to decay, or missing due to reasons other than decay, in accordance with the World Health Organization DMFS/dfs scale and in accordance with the NIH/NIDCR-approved protocol for assessing den-tal caries for research purposes [33]. This method of caries assessment is compatible with that recom-mended by the PhenX Toolkit (http://www.phenx-toolkit.org; designed to facilitate combining data across studies), and the National Center for Health Statistics Dental Examiners Procedures Manual (See Section 4.9.1.3) [34]. Third molars were excluded from caries assessment. Edentulous individuals were recruited into the study but were excluded from caries assessment and analysis.
Statistical analysis
The analytic goal of the present study was to explore patterns of dental caries of the permanent dentition in adults. Therefore we excluded children by restricting our study sample to the 1,068 participants aged 18 to 75 years. For each participant, surface-level caries data on 128 surfaces (i.e., 4 surfaces for each incisor and canine, and 5 surfaces for each premolar and molar) were coded as 0 for sound or missing due to reasons other than decay, or coded as 1 for pre-cavitated, decayed, missing due to decay, or filled/restored. Thus, we gener-ated a matrix of 1,068 participants by 128 indicators of surface-level caries affection status. This matrix was used as input for two related methods of extracting pat-terns within the data: PCA and FA [35].
Shafferet al.BMC Oral Health2012,12:7 http://www.biomedcentral.com/1472-6831/12/7
PCA uses singular value decomposition of the data matrix to extract a set of uncorrelated variables (called principal components scores, PCs) where the first PC (i. e., PC1) explains the greatest possible amount of varia-bility in the data in a single dimension, and the second PC (i.e., PC2) explains the greatest possible amount of remaining variability in the data in a single dimension orthogonal to PC1, and so on. The result is a number of orthogonal PCs equal to the number of original vari-ables (in our data, 128), with successive PCs each explaining less and less of the data variability. Each PC can be defined as a linear combination of the original variables weighted by their loadings. The first several PCs may represent important patterns in the data, essentially assessing underlying signals from a greater number of correlated phenotype measurements. The loadings provide a way of interpreting the PCs in terms of the original variables. In other words, the loadings describe the pattern of carious lesions across the perma-nent dentition for a given PC, whereas the actual PCs indicate the extent/severity of caries of that decay pattern.
FA is similar to PCA in that it is used to extract latent variables called factor scores (FACs) from an original data matrix. Like PCs, FACs are calculated as linear combinations of the original variables weighted by their loadings, except that the number of FACs used to model the patterns in the data is chosen a priori, and the FACs are not constrained to be orthogonal. In this study, we modeled the caries data matrix using 10 fac-tors. Like PCA, the goal of FA is to generate FACs representing underlying signals in the data matrix that can then be used as phenotypes, in this case, to identify the risk factors for dental caries.
In practice, FA and PCA often perform similarly. However the two methods take opposite perspectives in extracting patterns from a data matrix: PCA assumes that the observed variables provide the basis for the pat-terns, whereas FA assumes that latent patterns provide the basis for the observed variables. In this way, PCA is often used for dimension reduction, i.e., summarizing the information from a large number of variables with a few variables, whereas FA may better represent underly-ing“endophenotypes”, i.e., unmeasured phenotypes that manifest as the observed variables. For both PCA and FA, the loadings define the patterns of decay and the PCs and FACs describe the severity of disease for their corresponding patterns.
For comparison to the PCs and FACs, we also gener-ated threea prioricaries phenotypes: the DMFS index, pit and fissure surface caries (PFS), and smooth surface caries (SMS). Thesea prioriphenotypes are commonly used in the caries literature. DMFS was calculated as the number of pre-cavitated, decayed, missing due to decay,
or filled/restored surfaces. PFS and SMS were calculated in the same way as DMFS except that counts were lim-ited to pit and fissure surfaces and smooth surfaces, respectively. Occlusal surfaces of the premolars and molars, buccal surfaces of the maxillary molars, and lin-gual surfaces of the mandibular molars were considered pit and fissure surfaces. All other tooth surfaces were considered smooth surfaces.
In order to assess the stability of patterns identified by PCA and FA, we performed a sensitivity analysis by repeating PCA and FA on ten random subsets of the data comprised of 80% of the full sample. We compared the PCs and FACs obtained from random subsets to those from the full sample using the Pearson correlation coefficient, r. PCs 1-4 were extremely stable (r = 0.98 to 1.00), PCs 5-9 were stable (r = 0.86 to 0.95), and PC 10 was moderately stable (r = 0.77) across random subsets. FACs 1-6 were stable (r = 0.86 to 0.99), and FACs 7-10 were moderately stable (r = 0.69 to 0.82) across random subsets. Likewise, we assessed the effect of relatives on PCA and FA by repeating these methods in the maximal subset of unrelated individuals. PCs 1-10 and FACs 1-8 from the unrelated sample were highly correlated (r > 0.95) with those from the full sample, whereas FAC9 and FAC10 were moderately correlated (r = 0.57, and 0.81, respectively). Altogether, these results suggest that caries patterns were generally stable and robust to the inclusion of relatives among the sample.
Heritability estimates of PCs and FACs were calcu-lated using the variance components approach. This method models phenotype correlations among all types of relatives as a function of the expected degree of genetic sharing (i.e. that parents and offspring share 50% of their genome, siblings share 50%, half-siblings share 25%, unrelated individuals share 0%, etc.). Details for this method as applied to our study sample have pre-viously been reported [6,36]. The heritability estimate is interpreted as the proportion of phenotype variance attributable to the cumulative effect of all genes.
All statistical analyses were performed in the R soft-ware package (R Foundation for Statistical Computing, Vienna, AU), except heritability estimates which were obtained from genetic modeling performed in SOLAR [37]. Principal components analysis was performed using theprcompfunction with default parameters. Fac-tor analysis was performed using thefactanalfunction with the Thomson’s regression-based scores option, 10 factors, and other default parameters. Prevalences, corre-lations, and figures were all generated in R.
Results
Caries prevalences by surface
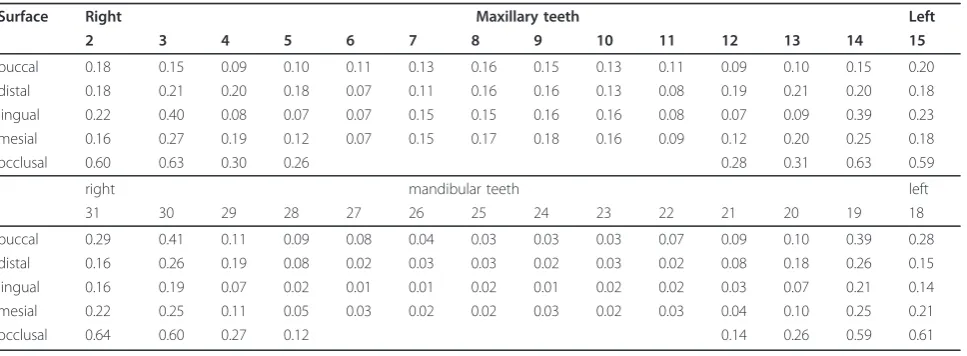
self-reported white) across 128 tooth surfaces were col-lected. Tooth surfaces that exhibited evidence of pre-cavitated lesions or decay, were missing due to decay, or had been filled/restored, were considered carious. Tooth surfaces that were sound or missing due to reasons other than decay were considered non-carious. Caries prevalences per surface (i.e. the proportion of the sam-ple exhibiting caries on a particular tooth surface) are shown in Table 1. Surfaces of the anterior maxillary teeth (i.e., incisor and canines) exhibited greater caries prevalences than anterior mandibular teeth; whereas posterior maxillary teeth (i.e., premolars and molars) exhibited lower pravelences rates than posterior man-dibular teeth.
Principal components analysis
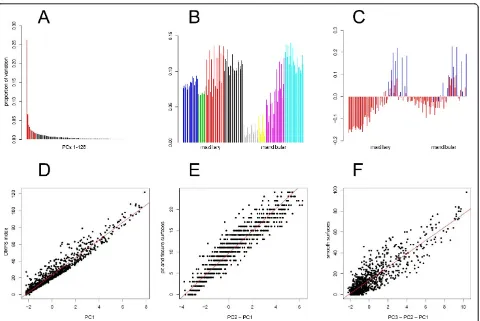
PCA was performed on the surface-level data in order to extract the underlying patterns of caries. PC1 explained 26.3% of the variability in the data, PC2 explained 6.7%, and all other PCs explained < 5% (Fig-ure 1A). Loadings show that except for anterior mandib-ular surfaces, all other surfaces contribute similarly to PC1 (Figure 1B) representing a near-global pattern/ extent of decay. Loadings for PC2 show opposite contri-butions of smooth surfaces and pit and fissure surfaces (Figure 1C). Loadings for PC3 show opposite contribu-tions of premolar vs. other surfaces and loadings for PC4 show opposite contributions of maxillary vs. man-dibular surfaces (see Additional file 1). Loadings for all other PCs show complex patterns of contributions from tooth surfaces that are not easily discernible in the con-text of PCs 1 to 4, however, general descriptions of the contributing surfaces are summarized in Table 2.
PC1 was nearly identical to DMFS index (r = 0.969; p-value < 10-250[i.e., the minimum p-value reported using the statistics software]; Figure 1D) indicating that the strongest pattern of caries in the data distinguished
individuals by global level of decay. PFS, the count of carious pit and fissure surfaces, was very highly corre-lated with PC2 after subtracting out PC1 (r = 0.947; p-value < 10-250; Figure 1E). SMS, the count of carious smooth surfaces, was highly correlated with PC3 after subtracting out PC2 and PC1 (r = 0.894; p-value < 10
-250
; Figure 1E). These correlations show that PC1, PC2, and PC3 capture the patterns of dental decay corre-sponding to a priori phenotypes, DMFS index, excess PFS (for a given DFMS), and excess SMS (for given DMFS and PFS), respectively.
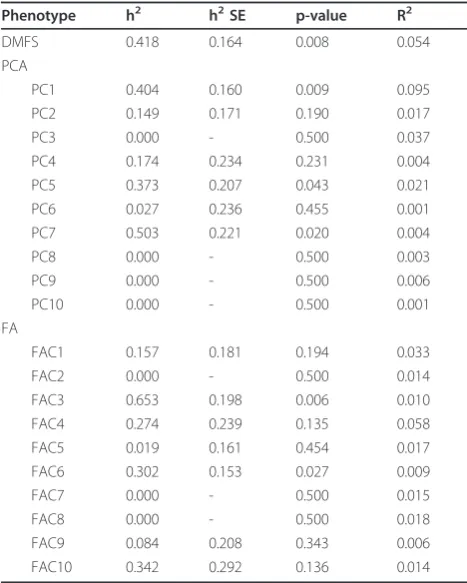
The heritability (h2) of DMFS index and PCs 1-10 were calculated while simultaneously adjusting for the effects of age, age2, and sex (Table 3). DMFS index, PC1, PC5, and PC7 were all strongly heritable (h2 = 37% to 50%; p-values = 0.043 to 0.008) indicating that some patterns of dental decay were due to genetic etiologies. Other PCs were not heritable indicating that some pat-terns of dental decay were not due to genetics. Covari-ates age, age2, and sex explained about 10% of variation in PC1 and very little variation for the remaining PCs.
Factor analysis
FA was also performed on the surface-level data to iden-tify latent patterns of dental decay (Table 2). 10 factors were extracted which cumulatively explained 44.7% of the variability of the data. FAC1 was primarily due to the contributions of molar surfaces, and to a lesser degree, premolar surfaces (see loadings, Figure 2A). FAC1 was moderately correlated with DMFS index (r = 0.593; p-value < 10-250), and strongly correlated with PFS (r = 0.815, p-value < 10-250; Figure 2B). Loadings showed that maxillary incisor surfaces, and to a lesser degree, maxillary canine surfaces, contribute to FAC2 (Figure 2C). FAC2 was moderately correlated with SMS (r = 0.523; p-value < 10-250) and DMFS index (r = 0.453; p-value < 10-250). See Additional file 1 for loadings of all
Table 1 Caries prevalences per surface across the permanent dentition (N = 1,068)
Surface Right Maxillary teeth Left
2 3 4 5 6 7 8 9 10 11 12 13 14 15
buccal 0.18 0.15 0.09 0.10 0.11 0.13 0.16 0.15 0.13 0.11 0.09 0.10 0.15 0.20
distal 0.18 0.21 0.20 0.18 0.07 0.11 0.16 0.16 0.13 0.08 0.19 0.21 0.20 0.18
lingual 0.22 0.40 0.08 0.07 0.07 0.15 0.15 0.16 0.16 0.08 0.07 0.09 0.39 0.23
mesial 0.16 0.27 0.19 0.12 0.07 0.15 0.17 0.18 0.16 0.09 0.12 0.20 0.25 0.18
occlusal 0.60 0.63 0.30 0.26 0.28 0.31 0.63 0.59
right mandibular teeth left
31 30 29 28 27 26 25 24 23 22 21 20 19 18
buccal 0.29 0.41 0.11 0.09 0.08 0.04 0.03 0.03 0.03 0.07 0.09 0.10 0.39 0.28
distal 0.16 0.26 0.19 0.08 0.02 0.03 0.03 0.02 0.03 0.02 0.08 0.18 0.26 0.15
lingual 0.16 0.19 0.07 0.02 0.01 0.01 0.02 0.01 0.02 0.02 0.03 0.07 0.21 0.14
mesial 0.22 0.25 0.11 0.05 0.03 0.02 0.02 0.03 0.02 0.03 0.04 0.10 0.25 0.21
occlusal 0.64 0.60 0.27 0.12 0.14 0.26 0.59 0.61
Shafferet al.BMC Oral Health2012,12:7 http://www.biomedcentral.com/1472-6831/12/7
other factors. In general, most FACs showed low corre-lations with PCs, indicating that the two methods extracted different patterns from the data. Compared with the PCs, which represented contributions from many teeth, a number of FACs primarily represented contributions of individual teeth (e.g., tooth 20 for FAC7, tooth 29 for FAC8, tooth 13 for FAC10).
The heritability estimates of FACs 1-10 are also shown in Table 3. FAC3 and FAC6 were strongly heritable (h2 = 65.3 and 30.2%; p-value = 0.006 and 0.027, respec-tively), whereas all other FACs were not heritable. These results echo the PCA results, showing that some caries patterns are due to genetic etiologies, whereas others are not. Significance levels for heritability estimates did not meet Bonferroni adjustment (for 20 models, requir-ing p-values < 0.0025 for family-wise significance); although, correct adjustment for multiple testing is not clear given the prior significant heritability of DMFS, PFS, and SMS indices reported for this sample [6,36].
Discussion
We used two related methods of extracting caries pat-terns in the permanent dentition from surface-level car-ies data. PCA yielded many moderate-to-weak patterns, possibly indicating a high degree of noise or sporadic (non-patterned) occurrence of dental caries. Moreover, PCs 1-3 closely recaptured the DMFT, PFS, and SMS indices, an observation that suggests thesea prioricaries phenotypes may reflect the predominant patterns of decay in the permanent dentition, although cumulatively they account for only 37% of the variability. Some PCs were heritable, whereas many were not, which suggests that genetic patterns of decay may be separable from non-genetic patterns. Unlike PCA, FA did not yield fac-tors that clearly recaptured a priori phenotypes, with the exception that FAC1 was correlated with PFS. Max-illary incisors contributed heavily to FAC2, which is consistent with previous studies that used multidimen-sional scaling [24] and cluster analysis [23] to explore
caries patterns in the primary dentition and showed maxillary incisors formed the second cluster (after other smooth surfaces). Ten factors were insufficient to explain the variability of the data, cumulatively account-ing for approximately 45%.
Like PCA, FA yielded some factors that were highly heritable indicating that certain caries patterns may be due to genetic etiologies while others may be due to non-genetic etiologies. Because the caries patterns pre-sented in this manuscript are more precisely and agnos-tically defined than a priori phenotypes, we conservatively conclude that specific patterns repre-sented by FAC3 and FAC6 are heritable, rather than generalizing to broader surface categories such as SMS. Interestingly, the strongest genetic contribution identi-fied was for FAC3, which was 65.3% heritable (com-pared to 41.8% for D1MFS index) which suggests that FAC3 may be a better phenotype for gene discovery thana priori caries phenotypes. A similar conclusion can be made for PC7 (50.3% heritable). These results are generally consistent with a previous study comparing PCA and FA that showed FA may better capture under-lying genetic signals from correlated phenotype mea-surements (although both methods perform quite similarly) [35]. Non-heritable PCs and FACs, presumably due to effects of non-genetic risk factors, may be
preferred phenotypes for future epidemiological studies of environmental risk factors for dental caries.
The severity of caries significantly increased with age (or age2) for most patterns (results not shown). Herit-ability estimates were calculated while simultaneously modeling age, age2
, and sex, although very similar herit-ability estimates were obtained in unadjusted models for all patterns except PC1 which exhibited decreased herit-ability when covariates were omitted (results not shown). These results are sensible given that altogether, age, age2 and sex accounted for about 10% of variance in PC1, but very little variance for the other PCs and FACs.
One of the challenges of using agnostic methods such as PCA and FA to identify underlying patterns of dental decay (devoid of a priori surface classifications) is in interpreting the findings. While some patterns, such as PC1 (defined by near-uniform loadings across most tooth surfaces and therefore representing global extent of decay), and FACs 7, 8 and 10 (each defined by contri-butions of a single pre-molar), are readily interpretable, other PCs and FACs may be difficult to relate back to the original variables. Moreover, there is no clear method of distinguishing biologically relevant patterns attributable to distinct risk factors from sporadic pat-terns due to noise. Sensitivity analysis showed that
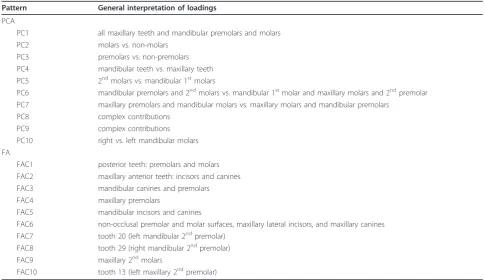
Table 2 General interpretations of PCA and FA loadings.
Pattern General interpretation of loadings
PCA
PC1 all maxillary teeth and mandibular premolars and molars
PC2 molars vs. non-molars
PC3 premolars vs. non-premolars
PC4 mandibular teeth vs. maxillary teeth PC5 2ndmolars vs. mandibular 1stmolars
PC6 mandibular premolars and 2ndmolars vs. mandibular 1stmolar and maxillary molars and 2ndpremolar PC7 maxillary premolars and mandibular molars vs. maxillary molars and mandibular premolars
PC8 complex contributions
PC9 complex contributions
PC10 right vs. left mandibular molars FA
FAC1 posterior teeth: premolars and molars FAC2 maxillary anterior teeth: incisors and canines FAC3 mandibular canines and premolars
FAC4 maxillary premolars
FAC5 mandibular incisors and canines
FAC6 non-occlusal premolar and molar surfaces, maxillary lateral incisors, and maxillary canines FAC7 tooth 20 (left mandibular 2ndpremolar)
FAC8 tooth 29 (right mandibular 2ndpremolar)
FAC9 maxillary 2ndmolars
FAC10 tooth 13 (left maxillary 2ndpremolar)
See Additional file 1 for full details Shafferet al.BMC Oral Health2012,12:7 http://www.biomedcentral.com/1472-6831/12/7
patterns represented by PCs 1-9 and FACs 1-6 were stable, whereas PC10 and FACs 7-10 were moderately stable. The overall stability lends credence to the notion that PCs and FACs considered in this study are not due to chance alone.
This study benefits from the large sample of related individuals with detailed surface-level caries assessment, which facilitated caries pattern extraction and heritabil-ity estimation. An additional strength of the analysis was using two different but related methods of extracting caries patterns from the data, which, most importantly, did not usea prioripattern definitions.
Despite these strengths, several limitations of this study warrant discussion, including inherent limitations to assigning tooth surfaces as carious or not. First, caries assessment by visual inspection, though suitable for obtaining data on large numbers of individuals and of sufficient quality for research purposes, may under-represent the true level of disease. Moreover, teeth miss-ing due to decay, for which all surfaces count as carious, and approximal lesions which are often treated by two-surface restorations (leading to filled occlusal two-surfaces despite absence of decay) may cause caries assessment errors. Likewise, the quality of caries assessment may not be uniform across surfaces of the permanent denti-tion, which may have caused additional “noise” in the caries measurement. Lastly, prophylactic restorations may inflate caries assessment. These limitations are una-voidable for cross-sectional (i.e., single time point) study designs of dental caries. However, appropriate modeling techniques, such as methods of pattern extraction
Table 3 Heritability estimates for DMFS index, PCs, and FACs
Phenotype h2 h2SE p-value R2
DMFS 0.418 0.164 0.008 0.054
PCA
PC1 0.404 0.160 0.009 0.095
PC2 0.149 0.171 0.190 0.017
PC3 0.000 - 0.500 0.037
PC4 0.174 0.234 0.231 0.004
PC5 0.373 0.207 0.043 0.021
PC6 0.027 0.236 0.455 0.001
PC7 0.503 0.221 0.020 0.004
PC8 0.000 - 0.500 0.003
PC9 0.000 - 0.500 0.006
PC10 0.000 - 0.500 0.001
FA
FAC1 0.157 0.181 0.194 0.033
FAC2 0.000 - 0.500 0.014
FAC3 0.653 0.198 0.006 0.010
FAC4 0.274 0.239 0.135 0.058
FAC5 0.019 0.161 0.454 0.017
FAC6 0.302 0.153 0.027 0.009
FAC7 0.000 - 0.500 0.015
FAC8 0.000 - 0.500 0.018
FAC9 0.084 0.208 0.343 0.006
FAC10 0.342 0.292 0.136 0.014
h2
= heritability estimate (i.e., proportion of phenotype variation attributable to genetics)
h2SE = standard error of the heritability estimate
R2= proportion of phenotype variation attributable to the cumulative effects of age, age2
, and sex
including PCA and FA, may aid in overcoming theses limitations of the caries assessment.
Conclusions
To our knowledge, this study is the first exploration of caries patterns in the permanent dentition in adults without relying ona prioriassumptions or surface clas-sifications. Overall, this study demonstrates the utility of methods for extracting caries patterns from surface-level data and reinforces the complexity of dental caries etiol-ogy. Because risk factors that manifest as specific decay patterns may otherwise go unobserved with respect to global or other a priori caries phenotypes, the use of patterns as novel phenotypes may assist in understand-ing the multifactorial nature of dental caries. This study is one of few but much needed efforts to use decay pat-terns to define new phenotypes for studying dental caries.
Additional material
Additional file 1: Provides graphs of loadings for PCs 1-10 and FACs 1-10.
Abbreviations
DMFS: Decay missing filled surfaces; DMFT: Decay missing filled teeth; PCA: Principal components analysis; FA: Factor analysis; PC: Principal components score; FAC: Factor score; PFS: Pit and fissure surface caries; SMS: Smooth surface caries.
Acknowledgements
The Center for Oral Health Research in Appalachia would like to thank the staff of the following heath care organizations for their efforts toward data collection: University of Pittsburgh, Bradford, Center for Rural Health Practice, Bradford, PA; McKean County Dental Center, Bradford, PA; Cornerstone Care Community Medical and Dental Center, Burgettstown, PA; UPMC Braddock Hospital, Braddock, PA; Camden-on-Gauley Medical Center, WV; Community Health Clinic of Nicholas County, WV; Richwood Area Community Hospital, WV; Summersville Memorial Hospital, WV; and the Webster County Memorial Hospital, WV. We would also like to thank the following organizations for their contributions: the GORGE Connection Rural Health Education Partnership Board, the Webster-Nicholas Rural Health Education Consortium Board, the West Virginia Rural Health Education Partnerships program, the Nicholas and Webster Boards of Education, and the UPMC Braddock Community Advisory Board. We would also like to acknowledge Kai Yu and Paula Trevilatto for their thoughtful comments on this work. Most importantly, we would like to thank the participating families for their contribution toward our goals of understanding and bettering the oral health of rural Appalachian communities.
Support for this study was provided by the National Institute of Dental and Craniofacial Research, including grants R03-DE021425, R01-DE014899 and U01-DE018903, as part of the NIH Genes and Environment Initiative (GENEVA), and by U01-HG004446 for data cleaning by the GENEVA Coordinating Center. Genotyping was provided by the NIDCR through a federal contract from the National Institutes of Health to The Johns Hopkins University, Center for Inherited Disease Research, NIH contract number HHSN268200782096C. Additional support was provided by the University of Pittsburgh School of Dental Medicine, the West Virginia University School of Dentistry and Eberly College of Arts and Sciences. The content presented herein is solely the responsibility of the authors and does not necessarily represent the official views of the National Institute of Dental and Craniofacial Research, nor the National Institutes of Health. The funding
sources had no role in study design, data collection and analysis, decision to publish, or preparation of the manuscript.
Author details
1
Department of Human Genetics, Graduate School of Public Health, University of Pittsburgh, Pittsburgh, PA 15261, USA.2Center for Oral Health
Research in Appalachia, University of Pittsburgh, Pittsburgh, PA 15261, USA.
3West Virginia University, Morgantown, WV 26506, USA.4Center for
Craniofacial and Dental Genetics, School of Dental Medicine, University of Pittsburgh, Pittsburgh, PA 15219, USA.5Department of Biostatistics, Graduate
School of Public Health, University of Pittsburgh, Pittsburgh, PA 15261, USA.
6Department of Oral Biology, School of Dental Medicine, University of
Pittsburgh, Pittsburgh, PA 15261, USA.7Department of Dental Public Health
and Information Management, University of Pittsburgh, School of Dental Medicine, Pittsburgh, PA 15261, USA.8Department of Behavioral and
Community Health Sciences, Graduate School of Public Health, University of Pittsburgh, Pittsburgh, PA 15261, USA.9Department of Periodontics, West
Virginia University School of Dentistry, Morgantown, WV 26506, USA.
10Dental Practice and Rural Health, West Virginia University of Dentistry,
Morgantown, WV 26506, USA.11Clinical and Translational Science Institute,
and Department of Psychiatry, School of Medicine, University of Pittsburgh, Pittsburgh, PA, USA.12Department of Human Genetics, Graduate School of
Public Health, University of Pittsburgh, 130 DeSoto St., Pittsburgh, PA 15261, USA.
Authors’contributions
JRS conceived and designed this study; RJW, RC, DWM, and MLM conceived and designed the COHRA initiative; JRS analyzed the data; JRS, EF, WX, KT, DEW, RSD, and MLM managed, cleaned and quality checked the data; JRS, EF, WX, KT, DEW, RSD, DEP, SW, RJW, RC, DWM, and MLM interpreted the results; JRS wrote the manuscript; JRS, EF, XW, KT, DEW, RSD, DEP, SW, RJW, RC, DWM, and MLM read, revised and approved the manuscript.
Competing interests
The authors declare that they have no competing interests.
Received: 16 July 2011 Accepted: 9 March 2012 Published: 9 March 2012
References
1. Hunter PB:Risk factors in dental caries.Int Dent J1988,38(4):211-217. 2. Anderson M:Risk assessment and epidemiology of dental caries: review
of the literature.Pediatric Dentistry2002,24(5):377-385.
3. Shuler CF:Inherited risks for susceptibility to dental caries.J Dent Educ 2001,65(10):1038-1045.
4. Slayton RL, Cooper ME, Marazita ML:Tuftelin, mutans streptococci, and dental caries susceptibility.J Dent Res2005,84(8):711-714.
5. Vieira AR, Marazita ML, Goldstein-McHenry T:Genome-wide scan finds suggestive caries loci.J Dent Res2008,87(5):435-439.
6. Wang X, Shaffer JR, Weyant RJ, Cuenco KT, Desensi RS, Crout R, McNeil DW, Marazita ML:Genes and their effects on dental caries may differ between primary and permanent dentitions.Caries Res2010, 44(3):277-284.
7. Wendell S, Wang X, Brown M, Cooper ME, DeSensi RS, Weyant RJ, Crout R, McNeil DW, Marazita ML:Taste genes associated with dental caries.J Dent Res2010,89(11):1198-1202.
8. Boraas JC, Messer LB, Till MJ:A genetic contribution to dental caries, occlusion, and morphology as demonstrated by twins reared apart.J Dent Res1988,67(9):1150-1155.
9. Bretz WA, Corby PM, Hart TC, Costa S, Coelho MQ, Weyant RJ, Robinson M, Schork NJ:Dental caries and microbial acid production in twins.Caries Res2005,39(3):168-172.
10. Bretz WA, Corby PM, Melo MR, Coelho MQ, Costa SM, Robinson M, Schork NJ, Drewnowski A, Hart TC:Heritability estimates for dental caries and sucrose sweetness preference.Arch Oral Biol2006,51(12):1156-1160. 11. Bretz WA, Corby PM, Schork NJ, Robinson MT, Coelho M, Costa S, Melo
Filho MR, Weyant RJ, Hart TC:Longitudinal analysis of heritability for dental caries traits.J Dent Res2005,84(11):1047-1051.
12. Werneck RI, Lazaro FP, Cobat A, Grant AV, Xavier MB, Abel L, Alcais A, Trevilatto PC, Mira MT:A major gene effect controls resistance to caries.J Dent Res2011,90(6):735-739.
Shafferet al.BMC Oral Health2012,12:7 http://www.biomedcentral.com/1472-6831/12/7
13. Batchelor PA, Sheiham A:Grouping of tooth surfaces by susceptibility to caries: a study in 5-16 year-old children.BMC Oral Health2004,4(1):2. 14. Douglass JM, Yi W, Xue ZB, Tinanoff N:Dental caries in preschool Beijing
and Connecticut children as described by a new caries analysis system. Community Dent Oral Epidemiol1994,22(2):94-99.
15. Greenwell AL, Johnsen D, DiSantis TA, Gerstenmaier J, Limbert N: Longitudinal evaluation of caries patterns form the primary to the mixed dentition.Pediatr Dent1990,12(5):278-282.
16. Johnsen DC:Dental caries patterns in preschool children.Dent Clin North Am1984,28(1):3-20.
17. Johnsen DC, Bhat M, Kim MT, Hagman FT, Allee LM, Creedon RL, Easley MW:Caries levels and patterns in head start children in fluoridated and non-fluoridated, urban and non-urban sites in Ohio, USA.Community Dent Oral Epidemiol1986,14(4):206-210.
18. Johnsen DC, Schechner TG, Gerstenmaier JH:Proportional changes in caries patterns from early to late primary dentition.J Public Health Dent 1987,47(1):5-9.
19. Johnsen DC, Schubot D, Bhat M, Jones PK:Caries pattern identification in primary dentition: a comparison of clinician assignment and clinical analysis groupings.Pediatr Dent1993,15(2):113-115.
20. Johnsen DC, Schultz DW, Schubot DB, Easley MW:Caries patterns in Head Start children in a fluoridated community.J Public Health Dent1984, 44(2):61-66.
21. O’Sullivan DM, Tinanoff N:Maxillary anterior caries associated with increased caries risk in other primary teeth.J Dent Res1993, 72(12):1577-1580.
22. O’Sullivan DM, Tinanoff N:The association of early dental caries patterns with caries incidence in preschool children.J Public Health Dent1996, 56(2):81-83.
23. Psoter WJ, Pendrys DG, Morse DE, Zhang HP, Mayne ST:Caries patterns in the primary dentition: cluster analysis of a sample of 5169 Arizona children 5-59 months of age.Int J Oral Sci2009,1(4):189-195. 24. Psoter WJ, Zhang H, Pendrys DG, Morse DE, Mayne ST:Classification of
dental caries patterns in the primary dentition: a multidimensional scaling analysis.Community Dent Oral Epidemiol2003,31(3):231-238. 25. Douglass JM, Tinanoff N, Tang JM, Altman DS:Dental caries patterns and
oral health behaviors in Arizona infants and toddlers.Community Dent Oral Epidemiol2001,29(1):14-22.
26. Polk DE, Weyant RJ, Crout RJ, McNeil DW, Tarter RE, Thomas JG, Marazita ML:Study protocol of the Center for Oral Health Research in Appalachia (COHRA) etiology study.BMC Oral Health2008,8:18. 27. From the Centers for Disease Control and Prevention. Total tooth loss
among persons aged > or = 65 years-selected states, 1995-1997. JAMA 1999,281(14):1264-1266.
28. Public health and aging: retention of natural teeth among older adults– United States, 2002. MMWR Morb Mortal Wkly Rep2003,52(50):1226-1229. 29. Purnell LDCM:Appalachians.InTranscultural Health Care: A Culturally
Competent Approac.Edited by: Purnell LD PB. Philadelphia: F. A. Davis; 1998:. 30. Marosy B, Romm J, Hetrick K, Doheny K, Pugh E, Tsai Y:Development of a
low cost SNP barcode panel [abstract #2653 F].Presented at the American Society of Human Genetics 57th Annual MeetingSan Diego, CA; 2007. 31. Cornelis MC, Agrawal A, Cole JW, Hansel NN, Barnes KC, Beaty TH,
Bennett SN, Bierut LJ, Boerwinkle E, Doheny KF,et al:The Gene, environment association studies consortium (GENEVA): maximizing the knowledge obtained from GWAS by collaboration across studies of multiple conditions.Genet Epidemiol2010,34(4):364-372.
32. Laurie CC, Doheny KF, Mirel DB, Pugh EW, Bierut LJ, Bhangale T, Boehm F, Caporaso NE, Cornelis MC, Edenberg HJ,et al:Quality control and quality assurance in genotypic data for genome-wide association studies.Genet Epidemiol2010,34(6):591-602.
33. Drury TF, Horowitz AM, Ismail AI, Maertens MP, Rozier RG, Selwitz RH: Diagnosing and reporting early childhood caries for research purposes. A report of a workshop sponsored by the National Institute of Dental and Craniofacial Research, the Health Resources and Services Administration, and the Health Care Financing Administration.J Public Health Dent1999,59(3):192-197.
34. National Center for Health Statistics National Health and Nutrition Examination Survey Dental Examiners Procedures Manual. 2001. 35. Wang X, Kammerer CM, Anderson S, Lu J, Feingold E:A comparison of
principal component analysis and factor analysis strategies for uncovering pleiotropic factors.Genet Epidemiol2009,33(4):325-331.
36. Shaffer JR, Wang X, DeSensi RS, Wendell S, Weyant RJ, T.Cuenco K, Crout R, McNeil DW, Marazita ML:Genetic susceptibility to dental caries on pit and fissure and smooth surfaces.Caries Res2012,46:38-46. 37. Almasy L, Blangero J:Multipoint quantitative-trait linkage analysis in
general pedigrees.Am J Hum Genet1998,62(5):1198-1211.
Pre-publication history
The pre-publication history for this paper can be accessed here: http://www.biomedcentral.com/1472-6831/12/7/prepub
doi:10.1186/1472-6831-12-7
Cite this article as:Shafferet al.:Heritable patterns of tooth decay in the permanent dentition: principal components and factor analyses.
BMC Oral Health201212:7.
Submit your next manuscript to BioMed Central and take full advantage of:
• Convenient online submission
• Thorough peer review
• No space constraints or color figure charges
• Immediate publication on acceptance
• Inclusion in PubMed, CAS, Scopus and Google Scholar
• Research which is freely available for redistribution