www.the-cryosphere.net/5/525/2011/ doi:10.5194/tc-5-525-2011
© Author(s) 2011. CC Attribution 3.0 License.
The Cryosphere
A comparison of glacier melt on debris-covered glaciers in the
northern and southern Caucasus
A. Lambrecht1, C. Mayer2, W. Hagg3, V. Popovnin4, A. Rezepkin4, N. Lomidze5, and D. Svanadze5
1Institute of Meteorology and Geophysics, University of Innsbruck, Innrain 52, 6020 Innsbruck, Austria 2Commission for Geodesy and Glaciology, Bavarian Academy of Sciences and Humanities,
Alfons Goppel Str. 16, 80539 Munich, Germany
3Geography Department, Ludwig-Maximilians-University, Luisenstr. 37, 80333 Munich, Germany 4Department of Cryolithology and Glaciology, Geographical Faculty, Moscow State University,
Leninskiye Gory, 119992-Moscow, Russia
5Vakhushti Bagrationi State Institute of Geography, Tbilisi, Georgia
Received: 14 December 2010 – Published in The Cryosphere Discuss.: 1 February 2011 Revised: 20 June 2011 – Accepted: 23 June 2011 – Published: 4 July 2011
Abstract. The glacier coverage in the Caucasus Mountains underwent considerable changes during the last decades. In some regions, the observed reduction in glacier area is com-parable to those in the European Alps and the extent of supra-glacial debris increased on many glaciers. Only a few glaciers in the Caucasus are monitored on a regular basis, while for most areas no continuous field measurements are available. In this study, regional differences of the conditions for glacier melt with a special focus on debris covered glacier tongues in the well-studied Adyl-su basin on the northern slope of the Caucasus Mountains (Russia) is compared with the Zopkhito basin which has similar characteristics but is located on the southern slope in Georgia. The paper focuses on the effect of supra-glacial debris cover on glacier summer melt. There are systematic differences in the distribution and increase of the debris cover on the glaciers of the two basins. In the Adyl-su basin an extensive debris cover on the glacier tongues is common, however, only those glacier tongues that are positioned at the lowest elevations in the Zopkhito basin show a considerable extent of supra-glacial debris. The ob-served increase in debris cover is considerably stronger in the north. Field experiments show that thermal resistance of the debris cover in both basins is somewhat higher than in other glaciated regions of the world, but there is also a significant difference between the two regions. A simple ablation model accounting for the effect of debris cover on ice melt shows that melt rates are considerably higher in the northern basin despite a wider debris distribution. This difference between
Correspondence to: A. Lambrecht
(astrid.lambrecht@uibk.ac.at)
the two regions can be attributed to different meteorological conditions which are characterised by more frequent cloud cover and precipitation in the south. Furthermore ablation is strongly influenced by the occurrence of supra-glacial debris cover in both basins, reducing the total amount of melt on the studied glaciers by about 25 %. This effect mitigates glacier retreat in the lower sectors of the ablation zones consider-ably. The sensitivity to moderate changes in the debris cover, however, is rather small which implies only gradual changes of the melt regime due to debris cover dynamics during the near future.
1 Introduction
Nicholson and Benn, 2006) highlighting important differ-ences between clear ice and sub-debris melt due to changes in individual terms of the energy balance. While net radiation is the main energy source for ice melt on debris-free glaciers, latent heat flux and conduction through the supra-glacial ma-terial determine the sub-debris melt rates (Takeuchi et al., 2000).
In addition to process studies, large scale mapping of de-bris cover is important for a realistic estimation of melt water production by debris covered glaciers (Taschner and Ranzi, 2002; Mihalcea et al., 2008a; Hagg et al., 2008). This is best achieved by the use of satellite imagery (Paul et al., 2004; Stokes et al., 2007) and an important aim of a num-ber of studies was the determination of supra-glacial debris thickness using remote sensing information (Mihalcea et al., 2008b; Foster, 2010). Several studies attempted to include debris cover into glacier melt parameterisations with a dif-ferent degree of sophistication (e.g. Kayashta et al., 2000; Konovalov, 2000; Reid et al., 2010). Here we attempt to in-tegrate field measurements, the analysis of remote sensing imagery and a simple ablation model for evaluating the role of the debris cover on the ice melt for two small basins in the Caucasus Mountains, located north and south of the main divide, where at least some glaciological and meteorological information is available for longer periods.
2 The Caucasus region
The Caucasus mountain range extends from the Black Sea to the Caspian Sea in a West-East direction with glaciers cov-ering an area of about 1600 km2(Stokes et al., 2006). The range creates a meteorological boundary between northern and southern slopes and, in general, larger glaciers are found in the north. The west-east climatic gradients are promi-nent especially on the southern slope, whereby the western sector is characterized by more humid conditions with an-nual precipitation reaching 3000 mm, while the east is semi-arid receiving as little as 200 mm yr−1(Volodicheva, 2002). As a result, water availability varies across the region. The Caucasus Mountains are the main source of runoff for the densely populated planes and snow and ice melt is crucial for water production in many parts of the region. A general glacier retreat is observed in the Caucasus and between 1985 and 2000, glaciers of the region lost 10 % of their surface area with more than 90 % of the glaciers retreating (Stokes et al. (2006).
Glacier melt in the Caucasus occurs mainly between June and August (JJA) (Shahgedanova et al., 2009a). The JJA mean temperatures were increasing at several weather sta-tions in the Caucasus during the last 40 years at a rate of 0.05◦C per year (Shahgedanova et al., 2009b). The last two decades have been the warmest during almost 80 years of observations and variations in precipitation do not compen-sate for enhanced ice melt in this period (Shahgedanova et
Fig. 1. CORONA image of the Adyl-su Valley from
Septem-ber 1971 with the boundaries of the selected glaciers (the Djankuat Glacier is at the far right) and the supra-glacial debris cover extent (orange).
al., 2009a). Furthermore model studies indicate that for the most likely groups of scenarios (A2 and B2) the air tem-perature will further increase, especially during the summer months (May–August, Shahgedanova et al., 2009a). There-fore glacier melt is expected to increase in the Caucasus (Stokes et al., 2006) and has already increased according to a negative trend of the annual mass balance of Djankuat glacier during the 30-year period from 1979 to 2009.
Although climatic conditions are different north and south of the Main Caucasus Ridge, the observed differences in glacier change in both regions have not been compared in detail due to the lack of ground based observations. After the end of the Soviet Union most glaciological observation programs have been dismissed, especially in the new, inde-pendent countries. The initiation of new monitoring sites is laborious and difficult.
3 Study sites
Our test regions for this comparative study are situated in the Greater Caucasus on both sides of the main divide, at a distance of only 64 km from each other. In both regions the drainage basin of a small river has been chosen for the investigations, allowing us to directly compare the relevance of the glaciers to the discharge conditions in the respective basin. Also this approach provides the opportunity to use the results for future run-off investigations.
Fig. 2. CORONA image from September 1971 for the Zopkhito
basin with the boundaries of all glaciers and the supra-glacial debris cover of the Zopkhito and Laboda Glaciers (orange).
lowest parts of all these glaciers are debris covered. In order to allow future comparisons with area precipitation and dis-charge, the basin was restricted to the Adyl-su valley down to the junction with the Baksan river (total area: 100.24 km2),
In the southern Caucasus, glaciers located in the Zopkhito valley, a part of the upper Rioni drainage basin (Fig. 2), were selected for investigation. Nine glaciers (with a to-tal area of 7.9 km2 in 2006) are situated in this part of the basin (total area: 49.35 km2), which correspond to a rela-tive glacier cover of 16 %. Only two of them, the Zopkhito Glacier and the Laboda Glacier, are partly debris-covered. These two glaciers are the only ones in the region with low reaching tongues (about 2475 m), where supra-glacial debris can accumulate. The other glaciers are debris-free cirque glaciers at higher elevations. Due to the much steeper relief south of the divide the potential areas which could be oc-cupied by glaciers are restricted and in general glaciation is much smaller on the southern slope (Dolgushin and Osipova, 1989).
Ablation underneath supra-glacial debris is very depen-dent on the local conditions and thus field measurements are required at least on some glaciers which are representative for the studied region. The field work conducted between 2007 and 2009 focused on the melt conditions of two partly debris-covered glaciers, namely the Djankuat Glacier (Rus-sia) in the north and the Zopkhito Glacier (Georgia) in the south. Apart from different aspects (NW and SE, respec-tively), the mean elevations of the debris-covered glacier tongues are comparable, with the Djankuat Glacier tongue located about 100 m higher than the tongue of the Zopkhito Glacier. On both glaciers debris covers about 10 % of the glacier area being concentrated in the lower part of the abla-tion zone.
In order to study sub-debris ice melt also information on the debris composition is required. In general the petrogra-phy of the Caucasus is relatively uniform, with the axial part composed by Jurassic igneous and metamorphic rocks
(gran-ites and gneisseous gran(gran-ites). The local petrography, how-ever, is much more diverse. In the Adyl-su basin, granitoides prevail and the glaciers are situated in the upper reaches of rift structures parallel to the main axis of the Greater Cau-casus. The southern test area is tectonically different, be-ing represented by upthrust and overthrust structures, with rock units in the north-south direction. Here the petrographi-cal composition is more complex with a combination of vol-canogenic origin (andesites, dolerites, pillow lavas) and fly-schoid strata (finely-dispersed argillo-arenaceous and marl deposits). Both pertographical units (volcanogenic and fly-schoid) are less resistant to erosion and denudation than granitoids. Together with the tectonic differences, this re-sults in more favourable conditions of debris accumulation on glaciers in the Southern test area (Zopkhito) than in the Northern one (Adyl-su) (Geologia SSR, 1964 and 1968).
4 Data collection
4.1 Glacier and debris cover mapping
Apart from the actual ablation conditions, it is also neces-sary to evaluate the evolution of the selected glaciers during the recent past, in order to allow conclusions about past and future glacier trends in the region. In the Caucasus, as in many other glacier covered regions, debris cover is an im-portant control for ice ablation (Mayer et al., 2010, Hagg et al., 2008) and thus the temporal changes of debris cover need also to be taken into account.
The glacier change investigations are based on a set of re-mote sensing images, which are used to delineate boundaries of the main glaciers within the two basins and the extent of debris cover for different years. By combining glacier maps with a digital elevation model, the area-elevation distribution of the glacier cover and the aspect of the glacier tongues have been determined. Combined use of these data makes it pos-sible to characterise changes in glacier area and proportion of glacier area covered by debris during the last 30–40 years in the selected regions.
In case of the Zopkhito basin a SPOT image from 8 June 2008 and Corona imagery from 20 September 1971 are the basis of the analysis. Additional information was used for 2006 based on a high resolution Digital Globe image (Google Earth) and for 2008 from Landsat ETM+, in order to obtain cloud free conditions for the entire glacier cover. The glacier boundaries and the debris cover were mapped manually on all images in order to obtain results of similar quality for all of the different image sources. The classification of debris cover on remote sensing imagery is not straightforward. Our approach was to map clean ice surfaces first. It is usually im-possible to resolve sub-pixel clean ice patches in otherwise debris covered areas and vice versa. The next step will be to manually map glacier margins, which in most cases is possi-ble by analyzing changes in slope, general surface roughness and obvious break lines on the images. With this approach, very dark ice and thin dust films on clean ice might be in-cluded in the debris cover class. An additional visual quality check will improve the results, but it does not guarantee a unique and correct solution. According to our observations in the field, the transition between clean ice and a clearly identifiable debris cover is usually not very large on the sam-pled glaciers and wrong classifications will be of an order of a few pixels. The results were also compared with de-bris cover maps which exist for Djankuat glacier (Popovnin and Rozova, 2002) and newer mapping results. Stokes et al. (2007) used a similar approach and achieved satisfactory results for the Djankuat glacier.
In addition, spatial distribution of the debris cover on the glacier tongue was mapped in detail in the field. This map was used to quantify the sub-debris melt rates on a spatially distributed basis and to validate the results from remote sens-ing analysis.
4.2 Ablation measurements
The field observations were carried out between 2007 and 2008 on Djankuat and between 2008 and 2009 on Zop-khito glaciers concentrating on the ice ablation on the glacier tongues and the mapping of supra-glacial debris cover. For the detailed observations of recent ablation conditions, net-works of 11 stakes each were installed in addition to the stan-dard mass balance stake network on the Djankuat Glacier in June 2007 (Fig. 3) and in the ablation area of the Zopkhito Glacier in June 2008 (Fig. 4), respectively. The elevation range of the sub-debris ablation network is about 250 m on both glaciers. Positions of the stakes were selected to repre-sent variations in debris cover thickness, elevation range and aspect.
Installation of the stake networks and subsequent moni-toring covered a period from 26/06/2007 until 27/09/2007 at the Djankuat Glacier, while thermistor information of de-bris temperatures is available until 01/07/2007. On Zopkhito Glacier, the stake network was installed at the end of June 2008, however, the stakes were reinstalled at the beginning
42°45'40"E 42°45'40"E
42°45'20"E 42°45'20"E
42°45'0"E 42°45'0"E
42°44'40"E 42°44'40"E
43
°1
2'
0"
N
43
°1
2'
0"
N
43
°1
1'
40
"N
43
°1
1'
40
"N
ablation stakes debris ice
A
B
C H
G F
D
E I K
0 130 260 520Meters Djankuat Glacier
Djankuat Glacier AWS
AWS
Fig. 3. Overview of Djankuat glacier including the mapped debris
cover, the position of the ablation stakes and the automatic weather stations (AWS).
Table 1. Details of the sensors used on Djankuat and Zopkhito glaciers for monitoring meteorological parameters.
Sensor Variable Height above the surface (m)
Temperature and humidity HMP45C Vaisala probe
Air temperature and relative humidity
2
CS100 SETRA barometric pressure sensor
Atmospheric pressure
A100R anemometer Wind speed 2.5
W200P-01 wind vane Wind direction 2.5
Kipp & Zonen CRN1 net radiometer
Incoming and reflected solar radiation; long-wave terrestrial and returned radiation
1.5
SR50A sonic ranging sensor Distance to the surface Variable
43°26'30"E 43°26'30"E
43°26'20"E 43°26'20"E
43°26'10"E 43°26'10"E
43°26'0"E 43°26'0"E
43°25'50"E 43°25'50"E
42
°5
2'
50
"N
42
°5
2'
50
"N
42
°5
2'
40
"N
42
°5
2'
40
"N
42
°5
2'
30
"N
42
°5
2'
30
"N
M5 M7
M10 M4
M2 M6 M8
M1
M11 M3
M9 L01
N06 N07
L06 L05
L04 L03
L02 N03 N04
N05 N12
N01 Zopkhito Glacier
Zopkhito Glacier
ablation stakes 2009 ablation stakes 2008 debris ice AWS
AWS
Fig. 4. Overview of Zopkhito glacier including the mapped debris
cover and the position of the ablation stakes in both ablation sea-sons, as well as the location of the AWS.
4.3 Meteorological Data
Campbell Scientific automatic weather stations (AWS) were installed on both glaciers between early June and early Oc-tober measuring a range of meteorological variables and dis-tance to the surface used in the calculation of glacier melt rates.
On Djankuat Glacier, two stations were installed at about 2960 m a.s.l., one over the clear ice and another over the de-bris covered surface (Fig. 3), close to the location where tem-perature gradients in the debris cover were recorded by sev-eral thermistors. On Zopkhito Glacier, an AWS was installed in the upper part of the ablation zone at about 2850 m a.s.l., just below a steep ice fall in 2008 (Fig. 4). This station was situated on clear ice. A simpler weather station (including air temperature, humidity and wind speed sensors) was installed
on a moraine ridge in the central part of the glacier tongue for the duration of the field campaign. The full-range Camp-bell Scientific AWS was removed in the autumn 2008 and re-installed at a lower elevation on the glacier in spring 2009, ensuring the coverage of meteorological conditions during the following ablation season. All sensors employed at the AWSs took measurements every 5 s and stored information averaged over 15 min intervals. The details are listed in Ta-ble 1. The AWS were visited every week to adjust their posi-tions and maintain the correct alignment of the instruments.
10 15 20 25 30
A
ir
T
e
m
p
eratu
re
(°C)
Ambrolauri Djankuat Zopkhito
0 5
16.Jun 26.Jun 06.Jul 16.Jul 26.Jul 05.Aug 15.Aug 25.Aug 04.Sep 14.Sep
Date
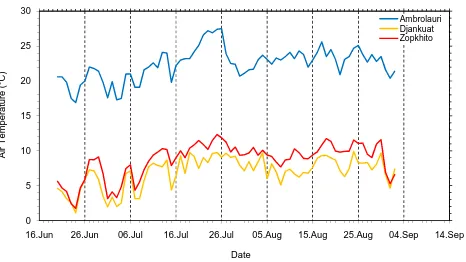
Fig. 5. Comparison of parallel daily mean air temperature
mea-surements (◦C) in 2008 on both sides of the Main Caucasus Ridge:
at Ambrolauri weather station (550 m a.s.l.) and on the Zopkhito Glacier (about 2700 m a.s.l.) on the southern slope and on the Djankuat Glacier (2960 m a.s.l.) on the northern slope.
was dry (and warm) at the lowland station. The observations showed that the southern site experienced higher cloudiness during summer due to the advection of humid air from the Black Sea generating the observed precipitation events. A comparison of air temperatures during the summer of 2008 (Fig. 5) shows, however, that air temperatures at both sites are rather similar if the vertical temperature gradient is ac-counted for. Air temperatures at Djankuat Glacier were about 0.5◦C lower than at Zopkhito at the comparable altitudes.
5 Analysis of glacier and debris cover evolution
The results of the temporal evolution of the glaciers in the two basins are mainly based on the remote sensing analy-sis, complemented by own observations. Glaciers are located between 2300 m to 4300 m in the Adyl-su basin and cover about 21 % of the area (Djankuat glacier accounts for about 3 % of the basin area). The ice cover reaches its maximum extent between 2900 m and 3700 m. The supra-glacial de-bris cover in the valley is limited to the elevations between 2350 m and 3200 m and there is no clear ice glacier sur-face within the lowest 150 m of this band (Fig. 6). Between 2500 m to 2800 m, the areas of debris-covered ice and clear ice are approximately the same. At higher elevations, the supra-glacial debris cover gradually declines and disappears at about 3200 m.
In the Zopkhito basin, the extent of the supra-glacial de-bris cover is more limited. Only a small proportion of the Zopkhito Glacier tongue is covered by debris. Apart from supra-glacial moraine ridges across the middle section of the tongue, the debris cover extends mainly over the lower-most part of the glacier. There, continuous and strong melt-ing throughout the summer increases the debris cover on the glacier surface by removing ice and adding intraglacial de-bris. The debris cover is rather thin on the steeper parts of the tongue, where the material usually is removed by small
2500 3000 3500 4000 4500
ele
v
at
ion (
m
)
debris cover ice catchment
1500 2000 2500
0 0.5 1 1.5 2 2.5 3 3.5 4 4.5
area (km²)
Fig. 6. Area elevation distribution for the six glaciers in the
Adyl-su basin in 2000 based on Stokes et al. (2006) and the STRM 90 m digital elevation model. The area distribution is divided into clean ice and debris covered fractions.
debris slides leaving only thin dust layers on the ice surface. In the flatter parts, the supra-glacial debris is composed of a wide variety of grain sizes, from very fine grained sand to big stones. Larger boulders, however, are few. Fig. 7 shows the area-elevation distribution of the Zopkhito and Laboda Glaciers for 2006 (based on elevations from SRTM in 2000). The other glaciers in the basin have no debris cover and are thus not included in this analysis.
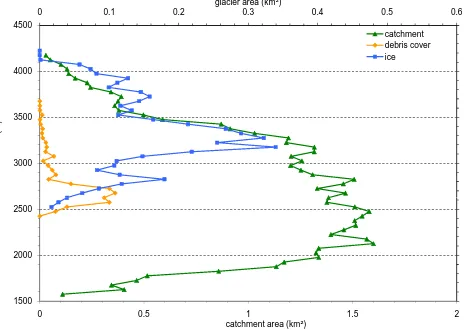
The hypsographic curve of the glaciers in the south is sim-ilar to that in the Adyl-su basin, but with the lower glacier margin about 100 m higher than in the north. Proportion of glaciated area reaches its maximum in a similar eleva-tion band while the relative area decrease with altitude starts at about 3400 m, which is 200 m lower than in the Adyl-su basin. Only the lowermost 300 m of the glacier cover (from 2450 m to 2750 m) exhibit a significant fraction of debris cover, while small debris covered areas are detected up to 3600 m.
In comparison to the Adyl-su basin, the proportion of ice free areas in the Zopkhito basin is considerably larger in lower elevation bands. Almost 40 % of the total area is down-stream of the lowest glacier tongue, while in the Adyl-su basin this is only a small fraction. The elevation bands show-ing the largest area in the Adyl-su basin are concentrated be-tween 3000 m and 3400 m. In the Zopkhito basin, the dis-tribution of these elevation bands stretches between 2100 m and 2800 m.
0 0.1 0.2 0.3 0.4 0.5 0.6
3000 3500 4000 4500
glacier area (km²)
ele
v
at
ion (
m
)
catchment debris cover ice
1500 2000 2500
0 0.5 1 1.5 2
catchment area (km²)
Fig. 7. Area elevation distribution for the Zopkhito and Laboda
Glaciers based on the manually delineated glacier boundaries for 2006 and the STRM 90 m digital elevation model. Note the differ-ent scales for the area of the glaciers and the catchmdiffer-ent (upper and lower x-axis).
increase in debris cover was not so pronounced (from 6.2 % to 8.1 %) and due to the lack of imagery, no information was available on the temporal pattern of change.
During the same period, melt on the glacier tongues ex-ceeded the compensating ice flux which resulted in area re-duction. For the glaciers in the Adyl-su basin (mean glacier size: 3.7 km2)this resulted in an area loss of 14.9 % for the 35 years between 1971 and 2006. In the Zopkhito basin, the resulting area loss was about 12.6 % for the same time span. The area change of the glaciers in the Zopkhito basin within a similar size class as in the Adylsu basin (these are Zopkhito glacier and Laboda glacier, mean area: 2.58 km2)is 13.3 %.
In the Alps, changes in glacier area were also observed during similar time periods. In the ¨Otztal (Austrian Alps), glaciers in the size class of 1–5 km2 lost 11.4 % between 1969 and 1997 and 19.1 % in the period 1969–2007 (Lam-brecht and Kuhn, 2007; Abermann et al., 2009). In Switzer-land, glaciers in the same size class lost 17.9 % between 1973 and 1999 (Paul et al., 2004). Therefore glaciers with a parable size lost somewhat less area in the Caucasus com-pared to the glaciers in the Alps.
6 Characteristics of sub-debris ice melt
It is important to note that the study will not determine the to-tal mass balance in the basins, because the existing data basis does not allow such calculations. Instead, the ice melt will be compared for individual elevation bands and thus the general conditions for melt water generation, including the local me-teorological situation and the influence of the supra-glacial debris cover are analysed. Based on the field work, sub-debris ablation was analysed in detail. In connection with
0 5 10 15 20 25
1965 1970 1975 1980 1985 1990 1995 2000 2005 2010
debr
is
co
v
e
r
(%
)
date
southern Caucasus northern Caucasus
Fig. 8. Relative debris covered area on the glaciers of the two
in-vestigated basins in the Caucasus for a time span of 35 years.
mass balance investigations restricted to the ablation zones and meteorological data, glacier melt was calculated for the respective ablation seasons.
As a first step, ablation rates and degree day factors (DDF) were determined as a function of debris thickness for the ab-lation season. A reab-lationship between daily mean air tem-peratures and the sub-debris ice melt could be established by assuming the validity of a simple degree day approach (ab-lation is linearly related to positive air temperatures; Braith-waite 1981, 1995; Hoinkes, 1955; Hoinkes and Steinacker, 1975). A critical investigation of temporal variability of ab-lation demonstrates that the established degree day reab-lation is not stable over time. Compared to the first week after in-stallation, melt rate is generally higher if longer time spans are considered. The main reason for this is probably consid-erable mobility of debris cover over time. After installation of a stake in the drill hole of the debris-covered glacier, the debris cover is reassembled as close to natural conditions as possible. This is, however, only possible to a certain extent and leads to a re-organization of the debris layer over time. At the same time, ongoing ice melt changes the ice bed un-derneath the debris cover leading to the re-structuring of the debris cover. Therefore temporal consolidation and probably also removal of fine grained debris material by melt water at some locations leads to thinning and compaction of the debris cover. Both processes are linked to higher melt rates due to lesser insulation and improved heat conduction. In addition, ablation records at some stakes appear to be spuri-ous. At one location with an initial debris thickness of 12 cm, for example, the degree day factor (melt per degree of pos-itive meain daily air temperature: DD) in 2008 varied from 0.26 mm/DD to 0.84 mm/DD, a value close to the one for clean ice conditions. This is very probably due to a total removal of debris cover by water flow or slumping. Such ob-servations demonstrate that ablation measurements need to be carefully analysed, if they are used for quantifying sub-debris melt conditions.
0 2 4 6 8 10 12
0 5 10 15 20 25 30
degre
e
day
f
a
c
tor
(m
m
/(d*k))
debris thickness (cm)
2009 first week 2008 first week
Fig. 9. Degree day factor versus debris thicknesses for the stakes
with approved ablation measurements on the Zopkhito Glacier dur-ing the observation periods. The maximum ablation is reached for very thin debris layers.
measurements were checked for temporal stability. Frequent observations of ablation especially during the first phase of the measurements in both seasons allowed us to calculate melt rates for short time periods (between half a day and a few days). Only ablation measurements which show stable conditions over several observation periods are selected for further analysis. In addition, photographs of stakes for dif-ferent dates were checked for stability of the debris cover. The finally selected measurements of ablation and conse-quently degree day factors as a function of debris thickness are displayed in Fig. 9. The remaining variability of the DDFs is due to local changes in debris cover composition (e.g. grain size, stratigraphy, water content) and is in the or-der of 1 mm/DD.
Because the degree day factors as a function of debris thickness are characteristic for specific sites, this relationship is shown in Fig. 10 for several investigated regions. Such a comparison provides information about the effect of debris cover on ice melt in different regions. Even if the extent of glaciation varies between the regions, local ablation rates and thus melt water production can be evaluated. Glacier melt is stronger compared to clear ice melt for a very thin debris cover on both Djankuat and Zopkhito Glaciers. Sim-ilar observations were made in other, longer measurements (e.g. Mihalcea et al., 2006; Konovalov, 2000). After a maxi-mum in melt, the melt rate decreases and reaches the same magnitude as for clear ice at the critical debris thickness of about 2 cm for Zopkhito glacier and 3 cm for Djankuat glacier. The melt rate continues to decrease rapidly with in-creasing debris thickness, so that about 50 % of the clear ice value is reached at debris thicknesses of about 6 cm at Zop-khito glacier and 10 cm at Djankuat glacier (Fig. 10). This thickness for a 50 % melt reduction is somewhat lower than previously derived values from ablation modelling (Bozhin-skiy et al., 1986). In general ice melt is stronger at Djankuat glacier for debris thicknesses between 2 and 13 cm,
com-0 2 4 6 8 10 12
0 10 20 30 40 50 60 70
de
gr
ee
da
y
fa
cto
r (
m
m
/[d*
K
])
debris thickness (cm)
Djankuat Glacier - Caucaus, this study
Maliy Aktru Glacier - Altay Baltoro Glacier - Karakoram S. Inylchek Glacier - Tian Shan Zopkhito Glacier - Caucasus, this study
degree day function Zopkhito degree day function Djankuat
Fig. 10. Degree day factors from different regions (Southern
In-ylchek, Hagg et al., 2008, Baltoro; Mihalcea et al., 2006; Maliy Aktru, Mayer et al., 2011), including the manually derived degree day functions for Djankuat glacier and Zopkhito glacier.
pared to the conditions at Zopkhito glacier. However, sub-debris melt varies considerably depending on the local sub-debris layer conditions (grain size, grain size distribution, humidity, etc). Based on our stake observations, however, the strong reduction of ice melt for debris layer thicknesses between 2 cm and 10 cm, compared to thicker debris covers seems well documented for both glaciers.
In order to include physical properties of the debris layer in melt calculations, a simple approach based on conduction as the major process of heat transfer from the surface to the ice is used. Furthermore, under the assumption of uniform debris conditions over larger areas (similar grain size distri-bution, similar lithology, similar water content), heat transfer is governed by thermal resistance. For daily observations, a linear vertical temperature gradient within the debris col-umn can be expected (Nicholson and Benn, 2006) and it can be assumed that energy transferred through the debris cover depends on the temperature gradient dT/dz and its thermal resistance R only (Nakawo and Takahashi, 1982):
Qm=
1
R dT
dz, (1)
where thermal resistance of the debris cover is defined as a ratio between surface temperatureTs and ablation ratea in dependence of latent heat of fusion Ls and ice density ρi, if the mean ice surface temperature is assumed to be at the freezing point
R= Ts
Ls·ρi·a
. (2)
Table 2. Thermal conductivity for different rock types (Gupta,
2003) and the derived thermal resistance for a 10 cm thick layer of the respective material.
rock Thermal Thermal resistance
conductivity (K m2W−1)
(W m−1K−1) (for 10 cm
debris thickness)
Granite 3.32 0.0301
Basalt 2.09 0.0478
Slate 2.09 0.0478
Limestone 2.00 0.0500
Quartz Sandstone 5.02 0.0199
layer can be deduced. One basic assumption for this ap-proach is a characteristic and constant debris composition across the glacier. Even though the debris composition shows some variability, it is possible to choose measurement loca-tions which are representative of the mean condiloca-tions of a certain debris cover thickness.
The accuracy of the thermistors used in the experiments is ±0.2◦C, while daily ablation can be determined with
an accuracy of less than 1 cm. Using a mean daily verti-cal temperature gradient in the debris cover, the resulting mean uncertainty for the derived thermal resistance is±0.02 (K m2W−1). This value is in the same order as thermal re-sistance for very thin debris cover (less than a few cm).
Thermal resistance of the debris cover has been calculated as an independent parameter, in order to allow a comparison between different regions. This parameter is independent of the glacier area-elevation distribution and thus general mass balance and topographical conditions. Therefore, local abla-tion condiabla-tions can be compared between different meteoro-logical situations, surface geometry and supra-glacial debris properties.
Thermal resistance is known for different rock types based on their thermal conductivity (Table 2, Gupta, 2003). Ther-mal resistance of a debris layer, however, is a combination of properties of the rock, the air filling void space and water sit-uated especially in the lower parts of the debris layer (Brock et al., 2007). The thermal resistance of air (3.85 K m2W−1 for a 10 cm layer, Young, 1992) is much larger than for typi-cal rock types and water (thermal resistance of a 10 cm water layer: 0.19 K m2W−1) shows somewhat higher values. Vari-ability of thermal resistance across several regions (Fig. 11) is of the same order as variability between different rocks (Table 2). The considerable difference between Djankuat glacier and other regions is probably due to a different grain size distribution (air content) and water saturation.
5 10 15 20
ebris
thi
c
k
nes
s
(c
m
)
Djankuat, this study Z khit thi t d
0 5
0 0.02 0.04 0.06 0.08 0.1 0.12 0.14 0.16
d
thermal resistance (°C m²/W)
Zopkhito, this study Baltoro Maliy Aktru
Fig. 11. Thermal resistance for the glaciers in the Caucasus and
Altai and compared with results from former field measurements in the Karakoram.
7 Model simulations of sub-debris ablation
One of the major goals of this study is to show that a sim-ple approach is suitable for providing reliable estimates of melt water generation in basins with poor data availability. Frequently, daily air temperature is either measured close to glaciers or can be obtained from local meteorological stations in the vicinity. Also precipitation (cumulative values for pe-riods of weeks and months) can be derived from station data in the region. Both air temperature and radiation budget in-fluence the sub-debris ice melt and it would be desirable to use an energy balance model for the calculation of ice melt. In most situations, however, the required input data are not available, especially at high temporal resolution which is re-quired for energy balance models. This is the major motiva-tion for adapting a simple degree day model to determine the cumulated ice melt across the ablation zone of debris covered glaciers with a poor data coverage.
The temporal development of glacier change and the influ-ence of the debris cover can only be described with a combi-nation of an appropriate mass balance model (including the effect of supra-glacial debris) and an associated model of glacier evolution. One of the key components is the treat-ment of mass loss from the ablation zone and, in the case of debris covered glaciers, the implementation of the sub-debris melt mechanisms. Field measurements can only be carried out on a finite number of sample glaciers and transition from local field results to calculations for larger areas requires the usage of the above mentioned models.
7.1 The ablation model
In our approach, ablationa is calculated for 50 m elevation bands, with an appropriate degree day sumDs for the
indi-vidual bands. The total glacier areaAand the supraglacial debris cover areaAdneed to be distributed on the elevation bands together with the mean debris thicknessh for a cor-rect melt calculation (Mayer et al., 2011). The required areas are determined from field investigations and glacier mapping using remote sensing. The debris thickness is extrapolated from field measurements, which is only justified for small basins with similar glacier morphology. Finally, ablation is determined on the basis of the glacier maps, debris distribu-tion and the degree day funcdistribu-tions:
a=(A−Ad)
A Dsdf(i)+
Ad
ADsdd(h) (3)
For clear ice and debris cover ablation, the simple and widely accepted degree day approach (e.g. Braithwaite, 1995) is used because the energy balance terms change strongly across debris covered glaciers and measurements are usu-ally not available in remote basins. The degree day factor for ice df(i) and the degree day factors function in depen-dence off different debris thicknesses dd(h) are calculated from the field data. The degree day factor function in depen-dence of debris thickness cannot be derived as a single and at the same time easy to use mathematical function. There-fore, we delineate the function manually as a best fit to the stake measurements (Fig. 10). The comparison of the stake measurements with the corresponding values of the manually derived function shows, however, good correlation. For Zop-khito glacier, the coefficient of determination (r2)is 0.8, for Djankuat glacier it is 0.96. This analysis shows that the mod-elled degree day functions are suitable to calculate sub-debris melt for the observed range of debris thicknesses.
Information on distribution of debris thickness with alti-tude is required for this calculation. A wide range of ob-servations on different glaciers shows that in general debris thickness increases with decreasing altitude. For individual glaciers, a mean debris thickness function with elevation can be derived and included in the calculations. The summa-tion of the resulting mean ablasumma-tion rate for the individual elevation bands gives the total ablation for the entire abla-tion zone. The debris cover thickness for the glaciers in the region was extrapolated from the local thickness measure-ments, assuming similar thickness/elevation distributions on the neighbouring glaciers. As geological and hypsometric conditions are similar at individual glaciers in the respective basins, this assumption is justified. For larger basins, the relation between debris thickness and elevation needs to be determined for smaller, consistent units. The spatial debris cover distribution for all glaciers is based on classification of optical remote sensing images. The debris thickness is then assigned to mapped debris cover according to the corre-sponding elevation difference from the glacier snout as on the
200 300 400 500 600 700
me
lt
(
c
m)
debris melt mean melt ice melt
0 100
2300 2400 2500 2600 2700 2800 2900 3000 3100 3200 3300 elevation (m)
a
0 100 200 300 400 500 600 700
2300 2400 2500 2600 2700 2800 2900 3000 3100 3200 3300
me
lt
(
c
m)
elevation (m)
debris melt mean melt ice melt
b
Fig. 12. Model results of net ablation for the two glacier basins
and the sample year 2008. (a) Northern test basin (b) Southern test basin, based on a degree day approach and including the effect of supra-glacial debris. For the sub-debris melt, the specific condi-tions documented by our field measurements are used for the entire basin. Temperature information is provided by the glacier AWS on the Djankuat Glacier and a weather station at Ambrolauri in Georgia for the Zopkhito basin respectively.
glaciers with measured debris thicknesses. For the glaciers in the Adyl-su basin, the thickness measurements on Djankuat Glacier from 2008 could be complemented by detailed de-bris mapping on this glacier in earlier years (Popovnin and Rozova, 2002). In the Zopkhito basin, the measurements of 2008 and 2009 have been the only ground truth source.
In our experiments, the winter snow pack is assumed to be evenly distributed over the ablation area and is melted first using a mean degree day factor for snow (0.54 cm/DD, mean value for similar conditions in Hock, 2003). The amount of snow on the glacier at the end of the winter is derived from precipitation temperature records, which allow discrimina-tion between liquid and solid precipitadiscrimina-tion. As we are only interested in the effect of the debris cover on the ice ablation, mean values for the end of the winter snow pack are used for calculating snow melt and the start of ice ablation. Sum-mer snow events are very rare on the glacier tongues in both regions and are thus not included in the model experiments. 7.2 Model results
Table 3. Results from sensitivity experiments of the ablation model for the Adyl-su basin. In experiment 1 the natural debris thickness
distribution is varied across the glacier. For experiment 2 the natural debris cover is used, but the thickness is set to constant values. In
experiment 3 the winter snow cover is changed by±20 %. In addition to the resulting melt volume also the relation to the ablation for a
debris free glacier is presented.
experiment 1
real debris real−10 % real +10 % real +20 %
total melt volume (m3) 2 773 602 2 810 788 2 763 769 2 738 032
clean glacier ratio (%) 73.7 74.7 73.4 72.7
experiment 2
real debris 2 cm debris 5 cm debris 10 cm debris 15 cm debris
total melt volume (m3) 2 773 602 3 348 247 2 909 847 2 734 487 2 646 808
clean glacier ratio ( %) 73.7 88.9 77.3 72.6 70.3
experiment 3
initial snow initial−20 % initial +20 %
total melt volume (m3) 2 773 602 4 265 021 1 847 831
clean glacier ratio (%) 73.7 77.9 70.4
Table 4. Results from sensitivity experiments of the ablation model for the Zopkhito basin. The experiments are identical to the ones in
Table 3.
experiment 1
real debris real−10 % real +10 % real +20 %
total melt volume (m3) 17 876 838 1 604 183 17 771 961 17 323 313
clean glacier ratio (%) 73.7 76.7 73.2 71.4
experiment 2
real debris 2 cm debris 5 cm debris 10 cm debris 15 cm debris
total melt volume (m3) 17 876 838 25 743 291 19 417 301 16 886 905 15 305 407
clean glacier ratio (%) 73.7 106.1 80.0 69.6 63.1
experiment 3
initial snow initial−20 % initial +20 %
total melt volume (m3) 17 876 838 29 605 310 9 882 082
clean glacier ratio (%) 73.7 77.7 69.5
For both regions, the calculated equilibrium line altitude (ELA) is in the same range, but lower in the south (about 3100 m in the Zopkhito basin) than in the north (3300 m in the Adyl-su basin). The clean ice ablation, however, shows a larger gradient in the north. One possible reason could be the observed higher cloudiness on the southern slope of the Cau-casus which results in smaller values of the incoming short wave radiation and, therefore, lower air temperature under otherwise similar meteorological conditions. Another reason could be the different aspect of the glaciers, where the south-facing glaciers receive more energy but also more precipita-tion. This radiation conditions, however, do not result in a lower position of the glacier terminus. This effect is proba-bly linked to the mean orientation of the glaciers (north-west
in the north and south-east/south/south-west in the south) and a difference in the precipitation regime with large ac-cumulation amounts on the northern slopes of the Caucasus (Popovnin, 1999). Compared to the northern glaciers, the lower limit of the glaciers in the Zopkhito region is about 150 m higher, while the total clear ice ablation at 2450 m el-evation is 120 cm or 20 % less for the sample year.
altitude is rather different, with a more gradual decrease of debris cover in the northern basin.
For both regions the total amount of melt water was determined for the ablation season 2008, resulting in 2.77×10⁶m3for the Zopkhito basin and 17.88×10⁶m3for the Adyl-su basin. This corresponds to additional 56 mm discharge in the Zopkhito basin and 180 mm in the Adyl-su basin. Unfortunately mass balance measurements are only available for Djankuat glacier. Therefore, a direct compar-ison is only possible for this glacier. In the mass balance year 2007/08, Djankuat glacier had a positive mass balance of 100 mm. The mean ice melt across the ablation area was 2470 mm which was more than compensated by the large ac-cumulation amounts. If the mean ablation of the model result for 2008 is scaled with the ablation area of Djankuat glacier, the ice melt results in 2580 mm, which is in a good agree-ment with the measureagree-ments. In the case of a debris-free glacier, ice melt would be enhanced by 26.3 %, resulting in a mean ice melt of 3345 mm in the ablation area and an es-timated mass balance of−290 mm. This compares well to results by Pelto (2000), who identified that annual ablation was significantly reduced by 25–30 % on debris-covered ice, with summer ablation (once all snow cover has been lost) 30–40 % less under debris-covered regions.
In order to assess the significance of these results, addi-tional experiments have been performed with different pa-rameter sets (Tables 3 and 4). Compared to the results for the actual debris cover thickness, a thickness change of 10 % results in rather small variations (up to 1 %) of the effect of the debris cover on ice melt for the Zopkhito basin. A 10 % increase of the debris cover thickness reduces the ice melt by about 10 000 m3, or 0.35 %, while a corresponding thick-ness decrease enhances ice melt by 37 000 m3, or 1.3 %. In the Adyl-su basin, the effect of thickness change is higher. If the debris cover thickness is reduced, the influence of the debris cover on ice melt increases by 3 %. The melt water production is 1.8×10⁶m3, or 10 % higher. For an increase of the debris thickness of 10 %, the reduction of melt water production is 105 000 m3, or 0.6 %. This strong difference in sensitivity is due to the fact that the mean debris thickness of about 8 cm in the Adyl-su basin is close to the strong slope of the derived degree day function (Fig. 10), resulting in strong changes for small debris thickness changes. For a similar mean debris thickness in the Zopkhito basin the correspond-ing degree day function is already rather flat and ablation is less sensitive to thickness changes. This is also confirmed by experiments with constant debris thicknesses across the glaciers. The variation of the debris cover thickness between 5 cm and 15 cm for the Zopkhito basin produces only moder-ate changes in the total melt wmoder-ater production, while the vari-ation between 5 cm and 2 cm increases the ice melt consid-erably more. In the Adyl-su basin, the corresponding experi-ments show that the melt water production for a mean debris thickness of 2 cm is higher than for clear glaciers (106 %), while changes in debris thickness between 10 cm and 15 cm
show only a minor effect. These differences in ice melt sen-sitivity to debris thickness variations can be explained by the observed debris thickness distribution in the basins and the characteristic degree day functions for the two basins.
A variation in winter accumulation (±20 %) has a strong effect on the total melt water production, but the effect on the role of the debris cover for ice melt is restricted (about 4 %).
8 Discussion and conclusions
This study compares the conditions of glacier melt on both sides of the main divide of the Caucasus Range. In both re-gions, debris cover has a moderate effect on the melt water production. The altitudes below 2800 m a.s.l. are affected by an increasing debris cover in thickness and in areal extent. This trend will continue if the climate evolves along the cur-rent trends due to continuous strong ice melt and accumula-tion of supra-glacial debris on the glacier tongues. Therefore any investigation of glacier melt in this region needs to take debris cover into account.
A comparison of derived degree day factors as a func-tion of supraglacial debris thickness for different glaciated regions (Fig. 10) shows that the measurements in the Cau-casus provide factors in a similar range as in the Karako-ram (Mihalcea et al., 2006) and the Tian Shan (Hagg et al., 2008). For thin debris layers, however, the variation of the factors is large and between the regions, melt rates can vary by a factor three. This is mainly due to geographical con-ditions (latitude, elevation), local geology (defining debris surface albedo and thermal resistance) and meteorological conditions (cloudiness). In the Caucasus, the relation be-tween degree day factors and debris thickness is similar in the northern and the southern parts as documented by our investigations.
Ice ablation will be smaller at the Djankuat Glacier in the Caucasus for a given debris surface temperature, compared to similar ablation values at the Baltoro Glacier and the Maliy Aktru Glaciers (Fig. 11). For the Zopkhito Glacier, thermal resistance is smaller than for the Djankuat Glacier and just slightly higher than for the Baltoro and Maliy Aktru Glaciers. Given the mean uncertainty of thermal resistance of 0.02 (K m2W−1), the results for Zopkhito glacier are significantly different from those for Djankuat glacier. This difference in thermal resistance is probably due to different geological conditions in the two basins. Melting is thus enhanced on the Zopkhito Glacier in comparison to its northern counterpart for the same boundary conditions and glaciers in the Adyl-su basin are less sensitive to changes in the debris cover.
also show that within this comparison melt is most effec-tive on the Southern Inylchek Glacier in the Tian Shan. This might be due to regular rainfall in this region, which provides a very effective energy transport by advection in addition to conduction, especially through small debris thicknesses.
Our analysis indicates also that the debris cover increases more rapidly in the north than in the south. Due to the cli-matic and topographic conditions, the investigated glaciers south of the divide have almost the same size compared to their northern counterparts, although smaller glaciers exist as well in high cirques. The southern aspect allows higher radi-ation input and thus more intensive ice melt, which is more than compensated by the general cloud distribution. On the other hand, higher cloudiness results in higher precipitation in the south than in the north. This is reflected in the mod-eling results, which show that for the same time period the effective glacier melt is about 20 % less in the south.
Both regions experienced a strong glacier area loss dur-ing the last decades and the gradual increase in debris cover only has a moderating effect on the lower 300 m–400 m of the glacier tongues. There the mass loss is reduced by 20–30 % which slows down the retreat rates of the glaciers and lowers the total discharge by about a quarter. Moderate thickness changes of the debris cover, as can be expected for the near future, have only a small influence on the resulting melt vol-ume. This indicates that the effect of the debris cover on the total melt water production is rather stable and will gradually change with an increasing supra-glacial debris cover.
Acknowledgements. We gratefully acknowledge the financial
support by the EU-INTAS project “Modelling Climate Change, Glacier Dynamics, and Water Availability in the Caucasus”, and the “EGREW” project of the Austrian Academy of Sciences. Research on the Djankuat Glacier was also funded by project 3271.2010.5 of Federal Program “Leading Scientific Schools of Russia” and grant No. 09-05-01182a of Russian Foundation of Basic Research. We thank all our Georgian and Russian colleagues for their valuable help during the time at the glaciers. M. Shahgedanova strongly improved the manuscript by correcting the language and identifying inconsistencies. Two anonymous reviewers provided useful sugges-tions and comments which clearly enhanced the quality of the paper.
Edited by: J. O. Hagen
References
Abermann, J., Lambrecht, A., Fischer, A., and Kuhn, M.: Quanti-fying changes and trends in glacier area and volume in the
Aus-trian ¨Otztal Alps (1969–1997–2006), The Cryosphere, 3, 205–
215, doi:10.5194/tc-3-205-2009, 2009.
Bozhinskiy, A. N., Krass, M. S., and Popovnin, V. V.: Role of de-bris cover in the thermal physics of glaciers, J. Glaciol., 32(111), 255–266, 1986.
Braithwaite, R. J.: On glacier energy balance, ablation and air tem-perature, J. Glaciol., 27(97), 381–391, 1981.
Braithwaite, R. J.: Positive degree-day factors for ablation on the Greenland ice sheet studied by energy-balance modelling, J. Glaciol., 41(137), 153–160, 1995.
Braun, L. N. and Aellen, M.: Modelling discharge of glacierized basins assisted by direct measurements of glacier mass balance, in Hydrology in Mountainous Regions, IAHS Publ., 193, 99-106, 1990.
Brock, B. Rivera, A., Casassa, G., Bown, F., and Acuna, C.: The surface energy balance of an active ice-covered volcano: Villar-rica Volcano, Southern Chile, Ann. Glaciol., 45, 104–114, 2007. Dolgushin, L. D. and Osipova, G. B.: Glaciers, Moscow, Misl
Pub-lishing, 447, 1989, (in Russian).
Foster, L. A.: Utilisation of remote sensing for the study of debris-covered glaciers: development and testing of techniques on Mi-age Glacier, Italian Alps, School of Social and Environmental Science, University of Dundee, Theses, 272 pp, 2010.
Fujii, Y.: Experiment on glacier ablation under a layer of debris cover, J. Japan. Soc. Snow fee (Seppyo), 39, 20–21, 1977. Geologia SSSR (USSR Geology), Vol. IX “Northern Caucasus”,
1968, and Vol. X “Georgian SSR”, 1964.
Gupta, R. P.: Remote Sensing Geology, Springer, New York, 656 pp, 2003.
Hagg, W., Mayer, C., Lambrecht, A., and Helm, A.: Sub-debris melt on Southern Inylchek glacier, central Tien Shan, Geogr. Ann., 90, 55–63, 2008.
Hock, R.: Temperature index melt modelling in mountain areas, J. Hydrol., 282, 104–115, 2003.
Hoinkes, H. C.: Measurements of ablation and heat balance on Alpine glaciers, J. Glaciol., 2(17), 497–501, 1955.
Hoinkes, H. C. and Steinacker, R.: Zur Parametrisierung der Beziehung Klima-Gletscher, Rivista Italiana di Geofisica e Scienze Affini, Vol. I (Speciale), 97–104, 1975.
Kayastha, R. B., Takeuchi, Y., Nakawo, M., and Ageta, Y.: Practi-cal prediction of ice melting beneath various thickness of debris cover on Khumbu Glacier, Nepal, using a positive degree-day factor, IAHS Publ., 264, 71–81, 2000.
Konovalov, V.: Computations of melting under moraine as a part of a regional modelling of glacier runoff, IAHS Publ., 264, 109– 118, 2000.
Kuhn, M. and Batlogg, N.: Glacier runoff in Alpine headwaters in a changing climate, IAHS Publ., 248, 79–88. 1998.
Lambrecht, A. and Kuhn, M.: Glacier changes in the Austrian Alps during the last three decades, derived from the new Austrian glacier inventory, Ann. Glaciol., 46, 177–184, 2007
Mattson, L. E., Gardner, J. S., and Young, G. J.: Ablation on devris covered glaciers: an example from the Rakhiot Glacier, Panjab, Himalaya, IAHS Publ., 218, 289–296, 1993.
Mayer, C., Lambrecht, A., Mihalcea, C., Bel´o, M., Diolaiuti, G., Smiraglia, C., and Bashir, F.: Analysis of Glacial Meltwater in Bagrot Valley, Karakoram Based on Short-term Ablation and Debris Cover Observations on Hinarche Glacier, Mt. Res. Dev., 30(2), 169–177, 2010.
Mayer, C., Lambrecht, A., Hagg, W., and Narozhny, Y.: Glacial debris cover and melt water production for glaciers in the Altay, Russia, The Cryosphere Discuss., 5, 401–430, doi:10.5194/tcd-5-401-2011, 2011.
Mihalcea, C., Brock, B. W., Diolaiuti, G., D’Agata, C., Cit-terio, M., Kirkbride, M. P., Cutler, M. E. J., and
Smi-raglia, C.: Using ASTER satellite and ground-based
sur-face temperature measurements to derive supraglacial debris cover and thickness patterns on Miage Glacier (Mont Blanc Massif, Italy), Cold Reg. Sci. Technology, 52(3), 341–354, doi:10.1016/j.coldregions.2007.03.004, 2008a.
Mihalcea, C., Mayer, C., Diolaiuti, G., D’Agata, C., Smiraglia, C., Lambrecht, A., Vuillermoz, E., and Tartari, G.: Spatial distri-bution of debris thickness and melting from remote-sensing and meteorological data, at debris-covered Baltoro glacier, Pakistan, Ann. Glaciol., 48, 49–57, 2008b.
Nakawo, M. and Young, G.: Field Experiments to determine the Effect of a Debris Layer on ablation of Glacier Ice, Ann. Glaciol., 2, 85–91, 1981.
Nakawo, M., and Takahashi, S.: A simplified model for estimating glacier ablation under a debris layer, IAHS Publ. 138, 137–145, 1982.
Nicholson, L. D. and Benn, I.: Calculating ice melt beneath a debris layer using meteorological data, J. Glaciol., 52(178), 463–470, 2006.
Østrem, G. : Ice melting under a thin layer of moraine, and the ex-istence of ice cores in moraine ridges. Geogr. Ann., 41(4), 228– 230, 1959.
Paul, F., K¨a¨ab, A., Maisch, M., Kellenberger, T. W., and
Haeberli, W.: Rapid disintegration of Alpine glaciers
ob-served with satellite data, Geophys. Res. Lett., 31, L21402, doi:10.1029/2004GL020816, 2004.
Pelto, M.: Mass balance of adjacent debris-covered and clean glacier ice in the North Cascades, Washington, IAHS Publ., 264, 35–42, 2000.
Popovnin, V. V.: Annual mass-balance series of a temperate glacier in the Caucasus, reconstructed from an ice core, Geografiska An-naler, Series A, 81(4), 713–724, 1999.
Popovnin, V. V. and Rozova, A. V.: Influence of sub-debris thawing on ablation and runoff of the Djankuat Glacier in the Caucasus, Nord. Hydrol., 33(1), 75–94, 2002.
Rabus, B., Eineder, M., Roth, A., and Bamler, R.: The shuttle radar topography mission – a new class of digital elevation models acquired by spaceborne radar, ISPRS J. Photogr. Remote Sens., 57(4), 241–262, 2003.
Reid, T. and Brock, B. W.: An energy-balance model
for debris-covered glaciers including heat conduction
through the debris layer, J. Glaciol., 56(199), 903–916, doi:10.3189/002214310794457218, 2010.
Scherler, D., Bookhagen, B. and Strecker, M. R.: Spatially variable response of Himalayan glaciers to climate change affected by debris cover, Nat. Geosci., 4, 156–159, doi:10.1038/ngeo1068, 2011.
Shahgedanova, M., Hagg, W., Hassell, D., Stokes, C. R., and Popovnin, V.: Climate Change, Glacier Retreat, and Water Avail-ability in the Caucasus Region, in: Threats to Global Water Se-curity, edited by: Jones, J. A. A., Vardanian, T., and Hakopian, C., Proceedings of the NATO Advanced Research Workshop on Natural Disasters and Water Security: Risk Assessment, Emer-gency Response and Environmental Management, 13–18 Octo-ber 2007, Armenia, Yerevan, 131–143, 2009a.
Shahgedanova, M., Hagg, W., Zacio, M., and Popovnin, V.: An As-sessment of the Recent Past and Future Climate Change, Glacier Retreat, and Runoff in the Caucasus Region Using Dynamical and Statistical Downscaling and HBV-ETH Hydrological Model, in: Regional Aspects of Climate-terrestrial-Hydrologic Interac-tions in Non-boreal Eastern Europe, edited by: Groisman, P. Ya. and Ivanov, S., Springer Science and Business Media B.V., 63– 72, 2009b.
Stokes, C. R., Gurney, S. D., Shahgedanova, M., and Popovnin, V.: Late-20th-century changes in glacier extent in the Caucasus Mountains, Russia/Georgia, J. Glaciol., 52(176), 99–109, 2006. Stokes, C. R., Popovnin, V., Aleynikov, A., and Shahgedanova,
M.: Recent glacier retreat in the Caucasus Mountains, Rus-sia, and associated changes in supraglacial debris cover and supra/proglacial lake development, Ann. Glaciol., 46, 196–203, 2007.
Taschner, S. and Ranzi, R.: Comparing the Opportunities of
LANSAT-TM and ASTER Data for Monitoring a Debris Cov-ered Glacier in the Italian Alps within GLIMS Project, Interna-tional Geoscience and Remote Sensing Symposium (IGARSS), 2, 1044–1046, 2002.
Takeuchi, Y., K. R. B. and Nakawo, M.: Characteristics of ab-lation and heat balance in debris-free and debris-covered areas on Khumbu Glacier, Nepal Himalayas, IAHS Publ., 264, 53–61, 2000.
Volodicheva, N. A.: The Caucasus, in: The Physical Geography of Northern Eurasia, edited by: Shahgedanova, M., Oxford Univer-sity Press, 284–313, 2002.
WGMS: Glacier mass balance bulletin No. 10 (2006–2007), edited by: Haeberli, W., G¨artner-Roer, I., Hoelzle, M., Paul, F., and Zemp, M., ICSU(WDS)/IUGG(IACS)/UNEP/UNESCO/WMO, World Glacier Monitoring Service, Z¨urich, 96 pp., 2002. Young, Hugh D.: University Physics, 7 Edn., Addison Wesley,