INTRODUCTION
Kidney transplantation is the treatment of choice for patients with end-stage renal disease. However, despite the sig-nificant survival benefit, poor long-term outcomes and insufficient number of donor organs remain the major problems in organ transplantation (1,2). This result has lead to the increasing pressure to use kidneys of potentially inferior quality with likely compromised short- and
long-term function. Hence, reliable kidney quality and outcome markers are needed.
A wide number of publications have studied and suggested single as well as combinations of clinical- and
histopathology-based variables and de-rived algorithms to assess organ tissue quality and to predict short- and long-term outcomes. However, none of these biomarkers have so far been proven to be useful in routine clinical decision-making
for the individual donor organ and recip-ient (3,4). This result is partly due to the multitude of factors affecting donor organ quality, such as nephron supply, pre- and peritransplant insults and post-transplant immunologic and nonim-munologic variables (4). In addition, the lack of robust outcome measures further prevents the identification of predictive markers (5). Traditionally, the occurrence of delayed graft function (DGF) is used as a reference marker for poor organ quality and associated impaired short-and long-term outcome.
However, a major problem with DGF is the multitude of definitions itself, usu-ally incorporating the need for hemodial-ysis during the first week after trans-plantation (6). The indication for dialysis,
with Delayed Graft Function Those with Poorer Quality and
Outcome
Valeria R Mas,
1,2*Mariano J Scian,
1,2*Kellie J Archer,
3Jihee L Suh,
1,2Krystle G David,
1,2Qing Ren,
1,2Todd WB Gehr,
4Anne L King,
1,4Marc P Posner,
1Thomas F Mueller,
5and Daniel G Maluf
1,21Department of Surgery, Hume-Lee Transplant Center, Virginia Commonwealth University, Richmond, Virginia, United States of America; 2Molecular Transplant Research Laboratory, Richmond, Virginia, United States of America; 3Department of Biostatistics, Virginia Commonwealth University, Richmond, Virginia, United States of America; 4Internal Medicine, Virginia Commonwealth University, Richmond, Virginia, United States of America; and 5Department of Medicine, University of Alberta, Edmonton, Canada
Robust biomarkers are needed to identify donor kidneys with poor quality associated with inferior early and longer-term out-come. The occurrence of delayed graft function (DGF) is most often used as a clinical outcome marker to capture poor kidney quality. Gene expression profiles of 92 preimplantation biopsies were evaluated in relation to DGF and estimated glomerular fil-tration rate (eGFR) to identify preoperative gene transcript changes associated with short-term function. Patients were stratified into those who required dialysis during the first week (DGF group) versus those without (noDGF group) and subclassified accord-ing to 1-month eGFR of >45 mL/min (eGFRhi) versus eGFR of ≤45 mL/min (eGFRlo). The groups and subgroups were compared in relation to clinical donor and recipient variables and transcriptome-associated biological pathways. A validation set was used to confirm target genes. Donor and recipient characteristics were similar between the DGF versus noDGF groups. A total of 206 probe sets were significant between groups (P < 0.01), but the gene functional analyses failed to identify any significantly affected pathways. However, the subclassification of the DGF and noDGF groups identified 283 probe sets to be significant among groups and associated with biological pathways. Kidneys that developed postoperative DGF and sustained an impaired 1-month func-tion (DGFlogroup) showed a transcriptome profile of significant immune activation already preimplant. In addition, these kidneys maintained a poorer transplant function throughout the first-year posttransplant. In conclusion, DGF is a poor marker for organ quality and transplant outcome. In contrast, preimplant gene expression profiles identify “poor quality” grafts and may eventually improve organ allocation.
© 2011 The Feinstein Institute for Medical Research, www.feinsteininstitute.org Online address: http://www.molmed.org
doi: 10.2119/molmed.2011.00159
*VRM and MJS contributed equally to this work.
however, is subjective, and a number of factors such as postoperative hemody-namics independent of organ quality may affect the need for dialysis treat-ment. The lack of standardized defini-tions of DGF as well as the rather weak association between DGF and organ quality are reflected in the controversial results linking DGF with long-term allo-graft performance and contributes to the current paucity of biomarkers and thera-pies to affect early and long-term allo-graft outcome (3,7).
Recently, the value of molecular profiles in biopsies taken at time of transplantation to provide the missing information for a more complex under-standing and evaluation of organ qual-ity and long-term function have been re-viewed (4). Earlier studies have
investigated differences in gene expres-sion between living and deceased donors (8–10), the effects of donor age on gene expression patterns (11) and genes associated with DGF (8–12). The identified transcriptome profiles have significantly enriched our understand-ing of the pathomechanisms associated with ischemia-reperfusion injury. How-ever, none of these studies have so far produced a robust set of gene-associated transcripts applicable in the clinical routine to capture organ quality and outcome.
In the present study, a large patient cohort including a validation set are an-alyzed in regard to standard DGF diag-nosis and glomerular filtration rate (GFR)-based outcome measures to dis-cover new biomarkers in deceased donor biopsies associated with donor quality and short- and longer-term outcomes.
MATERIALS AND METHODS
Kidney Samples and Patient Enrollment
The study included 92 consecutive adult kidney transplant recipients of deceased donor kidneys (ages 17–70 years). The Institutional Review Board at Virginia Commonwealth University
(VCU-IRB Protocol #HM11454) ap-proved the study protocol. Written in-formed consent was obtained from all patients. No living donors, human im-munodeficiency virus (HIV)-positive patients or retransplantation patients were included in the study. Allograft biopsies from kidneys preserved using both cold preservation and pump per-fusion preservation were included. Kid-ney allograft tissue was obtained through an 18-gauge biopsy needle, and all samples were placed in RNAlater
(Ambion) immediately after collection. Biopsies were collected at preimplanta-tion time (post–cold ischemia time; n = 92). Estimated GFR (eGFR) was calcu-lated using the abbreviated Modifica-tion of Diet in Renal Disease formula (13). DGF was defined as the need of dialysis during the first 7 d after kidney transplantation. The patients were strat-ified into patients undergoing post-transplant DGF versus patients without DGF (DGF versus noDGF) and then further subdivided into patients with an eGFR >45 mL/min versus patients with an eGFR ≤45 mL/min (eGFRhi ver-sus eGFRlo) following the criteria de-scribed by Kainz et al. (14).
RNA Isolation, cDNA Synthesis and In Vitro Transcription for Labeled cRNA Probe
The sample preparation protocol fol-lows the Affymetrix GeneChip® Expres-sion Analysis Manual (Affymetrix, Santa Clara, CA, USA). Briefly, total RNA was reverse-transcribed using T7-polydT primer and converted into double-stranded cDNA (One-Cycle Target La-beling and Control Reagents;
Affymetrix), with templates being used for an in vitrotranscription reaction to yield biotin-labeled antisense cRNA. The labeled cRNA was chemically frag-mented and made into the hybridization cocktail according to the Affymetrix GeneChip protocol, which was then hy-bridized to HG-U133A 2.0 GeneChips. The array image was generated by the high-resolution GeneChip®Scanner 3000 by Affymetrix.
Microarray Data Processing
Gene expression microarray data for 92 preimplantation (PI) samples were available. Probe level data were read into the R programming environment using the affyBioconductor package, and the robust multiarray average method was used to obtain probe set expression sum-maries. Quality assessment of each GeneChip was performed by assessing the average background; scaling factor; percent present calls; the 3′:5′ratio for GAPDH, β-actin and signal transducer and activator of transcription 1 (STAT1); and the overall 3′:5′ratio with associated 95% confidence interval using the pub-licly available application (15,16). One microarray did not pass quality control, leaving a total of 91 arrays for the analy-sis. Probe level data were read into the R programming environment using the affy
Bioconductor package, and the robust multiarray average method was used to obtain probe set expression summaries (17,18). All control and probe sets de-clared absent for all samples were re-moved, leaving 17,529 probe sets for sta-tistical analysis of the PI biopsies.
Analysis of Differentially Expressed Genes among the Patient Groups
To identify genes differentially ex-pressed between transplant patients with and without dialysis during the first week after kidney transplantation, for each probe set, a two-sample ttest comparing the DGF versus noDGF groups was per-formed. Probe sets having a raw Pvalue <0.01 were considered significant.
Subjects were subsequently classified into two groups on the basis of their GFR at 1 month, individuals having eGFR >45 (GFRhi) and individuals hav-ing eGFR ≤45 (GFRlo). A moderated
ttest was used to compare the two groups using the limmapackage, and a
the response and group (noDGF with 1 month eGFR >45; noDGF with 1 month eGFR ≤45; DGF with 1 month eGFR >45; and DGF with 1 month eGFR ≤45) as the fixed effect of interest. A group means parameterization of group was included as the fixed-effect term to facil-itate extraction of linear contrasts of in-terest. Again, the limmapackage was used to fit the mixed-effects models using restricted maximum likelihood procedure, and an empirical Bayes method was applied to moderate probe set standard errors by borrowing infor-mation across the entire set of probe sets. To adjust for multiple comparisons, probe sets with a Pvalue from the over-all Ftest <0.01 were considered signifi-cant. Thereafter, among probe sets iden-tified as differentially expressed via the
Ftest, pair-wise comparisons of interest were performed. Specifically, we exam-ined the following four pair-wise com-parisons: (i) no DGF with 1 month eGFR ≤45 versus noDGF with 1 month eGFR >45, (ii) DGF with 1 month GFR ≤45 versus DGF with 1 month eGFR >45, (iii) DGF with 1 month eGFR ≤45 versus noDGF with 1 month GFR ≤45, and (iv) DGF with 1 month eGFR >45 versus noDGF with 1 month eGFR >45.
Biological and Functional Analysis Gene ontology and gene interaction analyses were executed using ToppGene (http://toppgene.cchmc.org) (19). Gene lists containing Entrez GeneID numbers were used as input. Identification of sig-nificant biological processes and path-ways was determined using the false dis-covery rate method (P< 0.01). The results obtained with ToppGene were confirmed using Ingenuity Pathway (IPA, www.ingenuity.com).
Validation of Five Genes in an Independent Set of Patients Using RT-qPCR
Initially, to validate our microarray findings, we carried out a reverse transcriptase–quantitative real-time poly-merase chain reaction (RT-qPCR) for
CCL5(chemokine [C-C motif] ligand 5),
ITGB2(integrin β2 [complement component
3, receptor 3 and 4 subunit]) and EGF
(epi-dermal growth factor) mRNAs from the
same RNA samples that were subjected to microarray study. Moreover, an inde-pendent set of samples (validation set) was tested for CCL5, ITGB2, EGF, VCAN
(versican) and CXCR4(chemokine [C-X-C
motif] receptor 4) mRNAs. The genes for
validation were selected based on the fol-lowing: (a) statistical differential expres-sion between DGFhiversus DGFlogroups and statistical differential expression be-tween eGFRhiversus eGFRloat 1 month posttransplantation, and (b) the genes were among the top scoring networks and pathways when using interaction networks and functional analysis for the different comparison analysis. Total RNA was subjected to reverse transcription using TaqMan®Reverse Transcription Reagents (Applied Biosystems, Foster City, CA, USA), according to the manu-facturer’s protocol. Real-time PCRs were then carried out in an ABI Prism 7700 Se-quence Detection System, using
TaqMan®Gene Expression Assays (Ap-plied Biosystems). Data were analyzed according to the comparative cycle threshold (Ct) method and were normal-ized with a housekeeping gene (GAPDH
[glyceraldehyde-3-phosphate
dehydroge-nase]). Pearson correlation coefficient (r) was calculated to examine the relation between microarray and real-time PCR results. P < 0.05 was considered significant.
All supplementary materials are available online at www.molmed.org.
RESULTS
Study Cohort Characteristics
A total of 92 patients were enrolled in the study. Patients were transplanted between January 2008 and March 2010. All patients received a deceased donor kidney transplant and had a minimum follow-up of at least 12 months. Of the kidney transplant recipients included in the analysis, only one graft was lost during the first year after kidney
trans-plant because of rapid progressive chronic allograft dysfunction with inter-stitial fibrosis and tubular atrophy. We first compared the two groups of DGF versus noDGF patients. The clinical def-inition of DGF used was the need for dialysis within the first week after kid-ney transplant (12). A total of 25 pa-tients developed post–kidney trans-plant DGF (27%) and 67 patients did not (73%). Within the DGF group, the period of dialysis before recovery for the individual patient showed a wide range (23 ± 36 d). The clinical indica-tions for dialysis in these 25 patients are described in Supplementary Table 1. For patients with DGF extended >3 wks, allograft biopsy was performed. In the vast majority of the performed biopsies, the histological diagnosis was acute tubular necrosis. Clinically, the two patient groups were similar regard-ing recipient and donor age, recipient and donor sex, last donor creatinine, cold ischemia time, warm ischemia time, incidence of acute rejection (AR) during the first year after kidney trans-plant or the use of pump perfusion preservation. A total of 57% of the donor kidneys underwent pump perfu-sion preservation, and 26.4% of the donors were extended criteria donors (including 13.2% non–heart-beating donors). The two groups only differed significantly in serum creatinine levels at 1 month post–kidney transplant and eGFR at 1-month and 1-year post–kidney transplant (Table 1 and Figure 1). The histology of the biopsies at preimplan-tation time is shown in Supplementary Table 2.
Gene Expression Profiling of DGF Versus noDGF Grafts in
Preimplantation Biopsies
One microarray failed our quality-con-trol assessment so that preimplantation gene expression microarray data were available for 91 patients from our cohort. Gene expression microarray analysis comparing DGF (n = 25) to noDGF (n = 66) patients identified 206 probe sets (P
How-ever, gene ontology analyses failed to identify any significantly affected bio-logical processes or pathways overrepre-sented by these genes (P< 0.01). Fur-thermore, unsupervised hierarchical clustering did not show any clear
sepa-ration between the DGF and noDGF preimplantation biopsies (not shown).
Gene expression microarray analysis comparing the two groups defined as 1 month eGFR >45 (GFRhi, N = 62) and 1 month eGFR ≤45 (GFRlo, N = 29)
iden-tified 208 differentially expressed probe sets (P< 0.01) (Supplementary Table 3). Expression for 80 probe sets was higher in the GFRhigroup, whereas expression for 128 probe sets was higher in the GFRlogroup. Core analysis was per-formed to interpret the data set in the context of biological processes, path-ways and molecular networks. From the analysis of the differentially ex-pressed genes, the top network associ-ated biological functions were cellular compromise; molecular transport; in-flammatory disease (network 1, score 38); and cell-to-cell signaling and inter-action, cell-mediated immune response and cellular development (network 2, score 29). Moreover, the top biological functions associated with the statistical differentially expressed genes were in-flammatory disease (P= 9.4E-10–9.5E-03) with overexpression of the follow-ing genes: ADA(adenosine deaminase)
CD28(T-cell-specific surface glycoprotein
CD28), CD48(CD48 antigen [B cell
mem-brane protein]), CCL5, CD2(T-cell surface
antigen CD2), CD27(T cell activation
antigen CD27) and CXCR4, among
oth-ers. Also, immune cell trafficking (P= 2.6E-08–9.5E-03) and cell-mediated im-mune response (P= 3.7E-08–9.3E-03) were among the top biological func-tions. The top canonical pathway asso-ciated with these genes was B-cell development.
Combination of DGF and eGFR Values Identifies Biologically Relevant Subgroups of Patients
The comparison between DGF and noDGF did not yield any robust differ-ence in gene expression profiles. In ad-dition, clinically, the DGF group showed a high degree of heterogeneity regard-ing severity of kidney injury, reflected by the wide range in recovery time needed (Figure 2). Thus, we further seg-regated the DGF and the noDGF patient groups each into two subgroups accord-ing to the degree of kidney function at 1 month after kidney transplant. These four patient subgroups were as follows: DGFhi, DGF patients with 1-month
Table 1.Demographic and relevant clinical information for the enrolled study patients separated according to DGF versus noDGF after transplantation.
DGF versus
DGF noDGF noDGF (P)
n 25 66
Recipient age 52.6 ± 11.2 49.6 ± 13.8 0.29
Recipient sex (n) [M (F)] 17 (8) 41 (25) 0.395
Recipient race (n)
Caucasian 2 17 <0.001
African American 22 45
Other 1 4
Recipient hepatitis C virus status (positive, n) 3 9 0.269
CMV disease (positive, n) 0 0 N/A
Recipient CMV status (positive, n) 18 46 0.144
Donor age (years) 42.8 ± 13.0 38.2 ± 15.0 0.150
Donor sex (n) [M (F)] 18 (7) 35 (30) 0.091
Donor race (n)
Caucasian 17 36 0.177
African American 5 23
Other 2 1
Donor hepatitis C virus antibody (positive, n) 3 8 0.278
Donor CMV status (positive, n) 15 33 0.139
Cold ischemia time (min) 1271 ± 530 1207 ± 532 0.607
Warm ischemia time/revascularization time (min) 29.6 ± 7.8 30.5 ± 7.7 0.647 Pump perfusion preservation time (min) 450 ± 508 488 ± 491 0.746 Last donor serum creatinine (mg/dL) 1.3 ± 0.6 1.0 ± 0.3 0.175
Acute rejection episodes (n) 4 90.275
HLA MM-A 1 ± 1 2 ± 1 0.067
HLA MM-B 2 ± 1 2 ± 1 0.889
HLA MM-DR 1 ± 1 1 ± 1 0.462
HLA MM total 4 ± 2 4 ± 2 0.200
Panel reactive antibodies at transplant–T cells (%) 43.3 ± 42.9 40.7 ± 34.9 0.782 Panel reactive antibodies at transplant–B cells (%) 17.8 ± 27.6 22.3 ± 32.1 0.510 Serum creatinine (mg/dL)
1 month 2.3 ± 1.7 1.4 ± 0.5 0.019
3 months 1.7 ± 0.8 1.4 ± 0.5 0.052
6 months 1.7 ± 0.7 1.4 ± 0.6 0.117
9 months 1.6 ± 0.6 1.6 ± 0.7 0.900
12 months 1.9 ± 1.0 1.4 ± 0.5 0.065
Average eGFR (mL/min)
1 month 48.4 ± 24.4 62.2 ± 21.5 0.017
3 months 55.1 ± 24.2 61.9 ± 18.9 0.229
6 months 55.7 ± 25.4 60.2 ± 18.4 0.448
9 months 57.3 ± 23.5 62.4 ± 20.1 0.408
12 months 50.7 ± 22.1 61.7 ± 18.5 0.064
CMV, cytomegalovirus; N/A, not applicable; MM, mismatch.
Data are averages ± standard deviation (SD) unless otherwise stated. eGFR was
eGFR >45 mL/min (rapid recovery); DGFlo, DGF patients with 1-month eGFR ≤45 mL/min (slow recovery); noDGFhi, noDGF patients with 1-month eGFR >45 mL/min (stable eGFR at 1 year); and noDGFlo, noDGF patients with 1-month eGFR ≤45 mL/min (de-clining eGFR at 1 year).
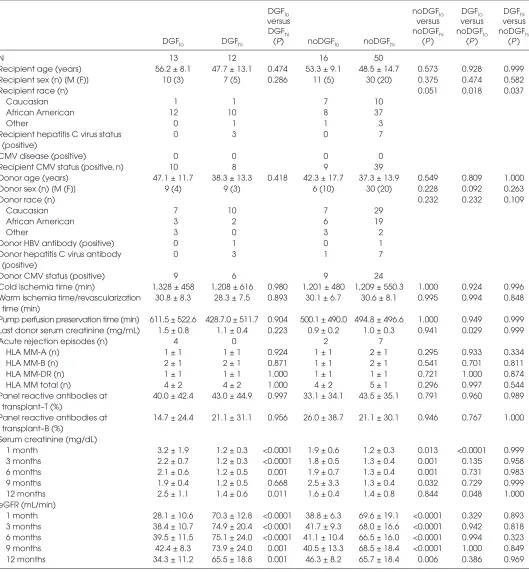
Figure 2 shows that each subgroup displays a persistent and stable trans-plant function for at least the first year; the subgroups within the DGF as well as within the noDGF patients remain statis-tically different at 3, 6, 9 and 12 months (Table 2). This supports the biological va-lidity of selecting the 1-month eGFR as the stratification variable.
The 1-month function is not associated with any of the clinical donor and recipi-ent variables (Table 2). In addition, 1-month transplant function is indepen-dent of the occurrence of DGF. Kidneys can have a high or low eGFR in the noDGF as well as in the DGF group, and longer-term function is not associated with early hemodialysis treatment or not. Function throughout the first year is not statistically different between DGFhiand noDGFhiallografts. DGFloversus noDGFlo kidneys again show overall no statistical difference during the first 12 posttrans-plant months; however, the 13 DGFlo allo-graft showed poorer early function recov-ery and worse 1-year function compared to the 16 noDGFlotransplants (Figure 2 and Table 2).
Gene Expression and Functional Analysis of DGF/GFR Subgroups
We next compared the gene expression profiles of the PI biopsies from the four subgroups to identify any potential dif-ferences associated with the observed segregation of samples. Four compar-isons were carried out: (i) DGFlo(n = 13) versus DGFhi(n = 12), (ii) noDGFlo(n = 16) versus noDGFhi(n = 50), (iii) DGFhi versus noDGFhi, and (iv) DGFloversus noDGFlo. Statistical analyses identified 155 probe sets differentially expressed between DGFhiand DGFlo; 79 probe sets between noDGFhiand noDGFlo; 32 probe sets between noDGFhiand DGFhi; and
130 probe sets between noDGFloand DGFlo(P< 0.01). A total of 27 genes iden-tified as differentially expressed among groups were also present in the GFRhi versus GFRlogene list. A complete list of the differentially expressed probe sets can be found in Supplementary Table 4.
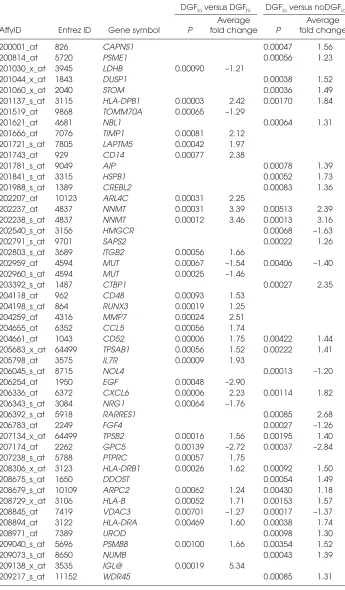
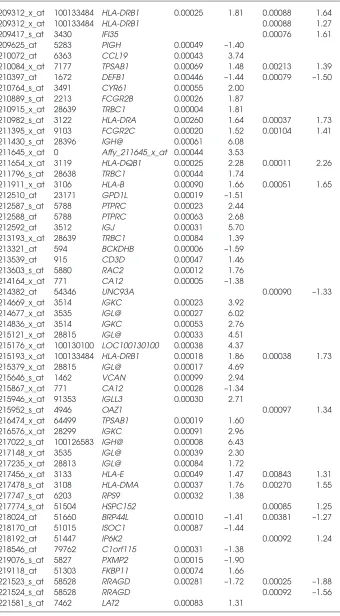
Functional analyses of genes differen-tially expressed between DGFhiand DGFloindicate that these genes are in-volved in antigen processing and presen-tation via major histocompatibility com-plex (MHC) class I/II, regulation of T-cell–mediated cytotoxicity and positive thymic T-cell selection (Supplementary Table 5). Moreover, biological pathways overrepresented by the affected genes in-cluded the allograft rejection/ graft versus host disease, antigen processing and presentation and cell adhesion mole-cules. Example genes identified in these categories included PSMB8, FCGR2B,
HLA-G, HLA-F, HLA-E, HLA-DRB1,
HLA-DRA, HLA-DPB1, HLA-DPA1,
HLA-DQB1, HLA-DQA1, HLA-B, HLA-DMA,
IL7R, PTPRC, CD3D, CXCL6, CCL19,
CCL5and LAT2(Table 3). Between noDGFhiand noDGFlo, intracellular transport and protein localization were identified as significant.
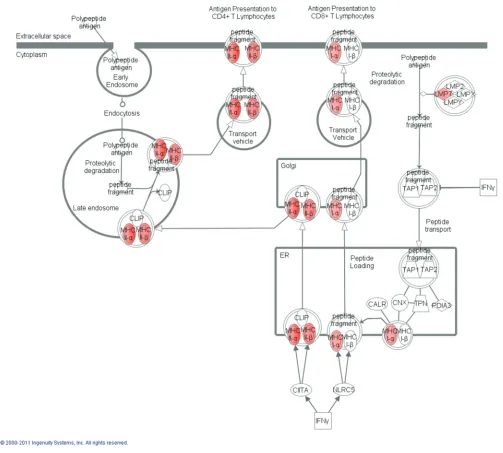
Finally, functional analyses between noDGFloand DGFloshowed that differ-entially expressed genes between these groups, similar to the comparison be-tween DGFloand DGFhi, are involved in antigen processing and presentation via MHC class I/II (Figure 3) and regulation of T-cell–mediated cytotoxicity, whereas biological pathways overrepresented by the affected genes included allograft rejection/graft versus host disease, anti-gen processing and presentation and cell adhesion molecules. Genes identified in-cluded HLA-G, HLA-E, HLA-DRB1,
HLA-DRA, HLA-DPB1, HLA-DPA1,
HLA-DQB1, HLA-DQA1, HLA-B, HLA-C,
HLA-DMA, PSMB8, PSME1, HSP90AB1,
and PRDX1(see Table 3). The
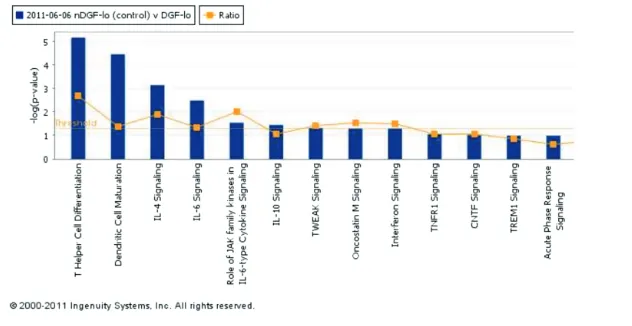
top-scor-ing network of interactions among the probe sets identified as significantly dif-ferentially expressed when comparing noDGFloversus DGFlois shown in Sup-plementary Figure 1. Also, from the anal-ysis of the canonical pathways, cytokine signaling involved in this comparison between groups is shown the Figure 4.
Microarray results were validated for a number of genes using the remaining stock RNA from samples used in the mi-croarray study. All genes tested showed a similar trend to that observed in the microarray data with a Pearson correla-tion of 0.928 (Supplementary Figure 2).
Markers Validation Using RT-qPCR Five genes were also validated in an independent group of patients including
DGFhi(n = 15) and DGFlo(n = 20) (vali-dation set). Supplementary Figure 3 shows that the significance of the identi-fied genes was validated in the indepen-dent set of patients.
DISCUSSION
To identify robust biomarkers capable of predicting graft outcome, a better un-derstanding of the mechanisms leading to DGF and its impact on long-term function is necessary, in particular as more and more marginal organs are ac-cepted to increase the donor pool (2123). The heterogeneity in the causes of DGF; the multitude of donor, recipient and procedural factors influencing early graft function; and the variety of definitions used for DGF reflect its limitations as a robust clinical end point and the failure to find reliable biomarkers of kidney
quality (4,6,7). In the present report, we evaluated in 91 consecutive deceased donor kidney transplants clinical vari-ables and gene expression profiles in re-lation to the development of DGF as well as transplant function throughout the first year.
The occurrence of DGF was neither associated with any of the tested clini-cal variables, including ischemia times, pump perfusion, donor and recipient sex, age and race or incidence of rejec-tions, nor with kidney function beyond 3 months after kidney transplant. In ad-dition, despite 206 probe sets differen-tially expressed in the preimplantation biopsies of kidneys that developed DGF versus those that did not, the functional analyses failed to identify any overrep-resented biological pathways from this list of probe sets separating DGF from noDGF. These findings corroborate the clinical experience that the DGF classifi-cation is subjective, lacks biological rel-evance for longer-term outcome and is as such not reflecting organ quality and a poor reference point to identify reli-able biomarkers (24).
However, the classifictaion of pa-tients in groups according with the eGFR at 1 month posttransplantation (GFRhiversus GFRlo) showed an impor-tant set of genes associated with inflam-mation and immune response differen-tially expressed between groups.
To better capture the “quality” of the kidneys and dissect the intrinsic hetero-geneity when using the DGF definition, we further subclassified the patient co-hort according to 1-month eGFR values. This however identified four subgroups of patients with distinct and persistent clinical 1-year transplant function. Pa-tients in the DGFloand noDGFlogroup remained statistically different from pa-tients in their counterpart group throughout the first year after transplan-tation. Furthermore, the DGFhiand noDGFhigroups were not statistically different post–kidney transplant, whereas the DGFloand noDGFlogroups were only statistically different from each other in serum creatinine at 1 month
Figure 2.Course of eGFR (top) and serum creatinine levels (bottom) for the four sub-groups of DGFhi, DGFlo, noDGFhiand noDGFloduring the first year after transplantation.
Table 2.Demographic and relevant clinical information for the 91 study patients when separated on the basis of DGF versus noDGF classification in combination with eGFR values at 1 month posttransplantation.
DGFlo noDGFlo DGFlo DGFhi
versus versus versus versus
DGFhi noDGFhi noDGFlo noDGFhi
DGFlo DGFhi (P) noDGFlo noDGFhi (P ) (P ) (P )
N 13 12 16 50
Recipient age (years) 56.2 ± 8.1 47.7 ± 13.1 0.474 53.3 ± 9.1 48.5 ± 14.7 0.573 0.928 0.999
Recipient sex (n) [M (F)] 10 (3) 7 (5) 0.286 11 (5) 30 (20) 0.375 0.474 0.582
Recipient race (n) 0.051 0.018 0.037
Caucasian 1 1 7 10
African American 12 10 8 37
Other 0 1 1 3
Recipient hepatitis C virus status 0 3 0 7
(positive)
CMV disease (positive) 0 0 0 0
Recipient CMV status (positive, n) 10 8 9 39
Donor age (years) 47.1 ± 11.7 38.3 ± 13.3 0.418 42.3 ± 17.7 37.3 ± 13.9 0.549 0.809 1.000
Donor sex (n) [M (F)] 9 (4) 9 (3) 6 (10) 30 (20) 0.228 0.092 0.263
Donor race (n) 0.232 0.232 0.109
Caucasian 7 10 7 29
African American 3 2 6 19
Other 3 0 3 2
Donor HBV antibody (positive) 0 1 0 1
Donor hepatitis C virus antibody 0 3 1 7
(positive)
Donor CMV status (positive) 9 6 9 24
Cold ischemia time (min) 1,328 ± 458 1,208 ± 616 0.980 1,201 ± 480 1,209 ± 550.3 1.000 0.924 0.996 Warm ischemia time/revascularization 30.8 ± 8.3 28.3 ± 7.5 0.893 30.1 ± 6.7 30.6 ± 8.1 0.995 0.994 0.848
time (min)
Pump perfusion preservation time (min) 611.5 ± 522.6 428.7.0 ± 511.7 0.904 500.1 ± 490.0 494.8 ± 496.6 1.000 0.949 0.999 Last donor serum creatinine (mg/mL) 1.5 ± 0.8 1.1 ± 0.4 0.223 0.9 ± 0.2 1.0 ± 0.3 0.941 0.029 0.999
Acute rejection episodes (n) 4 0 2 7
HLA MM-A (n) 1 ± 1 1 ± 1 0.924 1 ± 1 2 ± 1 0.295 0.933 0.334
HLA MM-B (n) 2 ± 1 2 ± 1 0.871 1 ± 1 2 ± 1 0.541 0.701 0.811
HLA MM-DR (n) 1 ± 1 1 ± 1 1.000 1 ± 1 1 ± 1 0.721 1.000 0.874
HLA MM total (n) 4 ± 2 4 ± 2 1.000 4 ± 2 5 ± 1 0.296 0.997 0.544
Panel reactive antibodies at 40.0 ± 42.4 43.0 ± 44.9 0.997 33.1 ± 34.1 43.5 ± 35.1 0.791 0.960 0.989 transplant–T (%)
Panel reactive antibodies at 14.7 ± 24.4 21.1 ± 31.1 0.956 26.0 ± 38.7 21.1 ± 30.1 0.946 0.767 1.000 transplant–B (%)
Serum creatinine (mg/dL)
1 month 3.2 ± 1.9 1.2 ± 0.3 <0.0001 1.9 ± 0.6 1.2 ± 0.3 0.013 <0.0001 0.999
3 months 2.2 ± 0.7 1.2 ± 0.3 <0.0001 1.8 ± 0.5 1.3 ± 0.4 0.001 0.135 0.958
6 months 2.1 ± 0.6 1.2 ± 0.5 0.001 1.9 ± 0.7 1.3 ± 0.4 0.001 0.731 0.983
9 months 1.9 ± 0.4 1.2 ± 0.5 0.668 2.5 ± 3.3 1.3 ± 0.4 0.032 0.729 0.999
12 months 2.5 ± 1.1 1.4 ± 0.6 0.011 1.6 ± 0.4 1.4 ± 0.8 0.844 0.048 1.000
eGFR (mL/min)
1 month 28.1 ± 10.6 70.3 ± 12.8 <0.0001 38.8 ± 6.3 69.6 ± 19.1 <0.0001 0.329 0.893 3 months 38.4 ± 10.7 74.9 ± 20.4 <0.0001 41.7 ± 9.3 68.0 ± 16.6 <0.0001 0.942 0.818 6 months 39.5 ± 11.5 75.1 ± 24.0 <0.0001 41.1 ± 10.4 66.5 ± 16.0 <0.0001 0.994 0.323
9 months 42.4 ± 8.3 73.9 ± 24.0 0.001 40.5 ± 13.3 68.5 ± 18.4 <0.0001 1.000 0.849
12 months 34.3 ± 11.2 65.5 ± 18.8 0.001 46.3 ± 8.2 65.7 ± 18.4 0.006 0.386 0.969
CMV, cytomegalovirus; HBV, hepatitis B virus; MM, mismatch.
posttransplantation. This analysis shows that grafts with DGF and fast recovery (DGFhi) behave clinically similar, at least for the first year, to grafts from the noDGF group.
These findings suggest that the occur-rence of DGF in kidneys with good quality has little or no clinical impact on long-term survival of the graft. This stratification further identified subsets of kidneys that have a poorer posttrans-plant function (DGFloand noDGFlo), in-dependent of whether they had experi-enced DGF or not. The clinical variables available before transplant did not iden-tify these groups of kidneys with better or poorer function during the first post-transplant year. Gene expression profil-ing obtained from preimplantation biop-sies identified the subset of grafts (DGFlo, n = 13) that developed DGF and continued to have a low GFR through-out the first year. Patients in this DGFlo group showed increased expression of a number of HLA and immune-related genes when compared with the other groups. Immune response genes have been shown to be overexpressed with renal ischemia in implantation biopsies (9,11). However, these studies included a mix of living and deceased donor biopsies in their profile analysis. Donor factors have been estimated to account for 35–45% of the variability in early al-lograft function (25). There is a high likelihood that the molecular mecha-nisms associated with reperfusion injury differ depending on the donor type, as suggested by the in-dependent segregation of the samples in the unsupervised cluster analysis pre-sented in the previously described arti-cles. Moreover, one study identified 132 transcripts including coagulation and complement genes that separated de-ceased and living donor kidneys (8). In concordance, Mueller et al.(10) identi-fied 3,718 probe sets differentially ex-pressed at an adjusted Pvalue of <0.01 from the comparison between deceased versus living donors kidneys, showing high differences between groups also after reperfusion.
Table 3.List of differentially expressed genes with corresponding average fold changes detected between DGFloand DGFhias well as DGFloand noDGFloby microarray gene expression analysis.
DGFloversus DGFhi DGFloversus noDGFlo
Average Average
AffyID Entrez ID Gene symbol P fold change P fold change
200001_at 826 CAPNS1 0.00047 1.56
200814_at 5720 PSME1 0.00056 1.23
201030_x_at 3945 LDHB 0.00090 –1.21
201044_x_at 1843 DUSP1 0.00038 1.52
201060_x_at 2040 STOM 0.00036 1.49
201137_s_at 3115 HLA-DPB1 0.00003 2.42 0.00170 1.84
201519_at 9868 TOMM70A 0.00065 –1.29
201621_at 4681 NBL1 0.00064 1.31
201666_at 7076 TIMP1 0.00081 2.12
201721_s_at 7805 LAPTM5 0.00042 1.97
201743_at 929 CD14 0.00077 2.38
201781_s_at 9049 AIP 0.00078 1.39
201841_s_at 3315 HSPB1 0.00052 1.73
201988_s_at 1389 CREBL2 0.00083 1.36
202207_at 10123 ARL4C 0.00031 2.25
202237_at 4837 NNMT 0.00031 3.39 0.00513 2.39
202238_s_at 4837 NNMT 0.00012 3.46 0.00013 3.16
202540_s_at 3156 HMGCR 0.00068 –1.63
202791_s_at 9701 SAPS2 0.00022 1.26
202803_s_at 3689 ITGB2 0.00056 1.66
202959_at 4594 MUT 0.00067 –1.54 0.00406 –1.40
202960_s_at 4594 MUT 0.00025 –1.46
203392_s_at 1487 CTBP1 0.00027 2.35
204118_at 962 CD48 0.00093 1.53
204198_s_at 864 RUNX3 0.00019 1.25
204259_at 4316 MMP7 0.00024 2.51
204655_at 6352 CCL5 0.00056 1.74
204661_at 1043 CD52 0.00006 1.75 0.00422 1.44
205683_x_at 64499 TPSAB1 0.00056 1.52 0.00222 1.41
205798_at 3575 IL7R 0.00009 1.93
206045_s_at 8715 NOL4 0.00013 –1.20
206254_at 1950 EGF 0.00048 –2.90
206336_at 6372 CXCL6 0.00006 2.23 0.00114 1.82
206343_s_at 3084 NRG1 0.00064 –1.76
206392_s_at 5918 RARRES1 0.00085 2.68
206783_at 2249 FGF4 0.00027 –1.26
207134_x_at 64499 TPSB2 0.00016 1.56 0.00195 1.40
207174_at 2262 GPC5 0.00139 –2.72 0.00037 –2.84
207238_s_at 5788 PTPRC 0.00057 1.75
208306_x_at 3123 HLA-DRB1 0.00026 1.62 0.00092 1.50
208675_s_at 1650 DDOST 0.00054 1.49
208679_s_at 10109 ARPC2 0.00062 1.24 0.00430 1.18
208729_x_at 3106 HLA-B 0.00052 1.71 0.00153 1.57
208845_at 7419 VDAC3 0.00701 –1.27 0.00017 –1.37
208894_at 3122 HLA-DRA 0.00469 1.60 0.00038 1.74
208971_at 7389 UROD 0.00098 1.30
209040_s_at 5696 PSMB8 0.00100 1.66 0.00354 1.52
209073_s_at 8650 NUMB 0.00043 1.39
209138_x_at 3535 IGL@ 0.00019 5.34
209217_s_at 11152 WDR45 0.00085 1.31
It is intriguing to find immune activa-tion already before implantaactiva-tion in kid-neys that will undergo DGF and will maintain a poor 1-year graft function (DGFlogroup). The biopsy time point excludes any impact of recipient factors on these transcriptome findings. The major difference between the two low GFR groups is the donor serum creati-nine (1.5 versus 0.9 in the DGFloversus noDGFlogroups, respectively; P= 0.034). Hence, the signature of immune activation might be reflecting increased injury to an older tissue with impaired repair capacity resulting in significantly poorer 1-month (serum creatinine 3.2 versus 1.9 or 1.2 mg/dL in DGFloversus noDGFloversus DGFhi, respectively) and 12-month graft function (serum creati-nine 2.5 versus 1.6 versus 1.4 mg/dL in DGFloversus noDGFloversus DGFhi, respectively).
These findings were further corrobo-rated by an analysis on the basis of the 1-month GFR alone. Kidneys with lower GFR again expressed genes associated with inflammation and immune re-sponse, overlapping with the identified genes and pathways associated with poorer outcomes in the analyses of the four subgroups.
Overall, these findings suggest that a subset of allografts may have increased expression of immune-related genes be-fore transplantation. It is possible that early immune activation within the grafts and possible prolonged upregula-tion of these and other immune-related genes may lead to long-term detrimental effects, an issue that needs to be further investigated.
It remains unclear why there is segre-gation between patients within the noDGF group. From the analysis of the differentially expressed genes in this group, most of these genes were down-regulated in the noDGFlogroup and were found to be involved in intracellular lo-calization and cellular transport. These gene changes may provide a biological explanation to what has been described in the literature as “slow graft function” (26–28). Finally, few differentially
ex-Table 3.Continued.
209312_x_at 100133484 HLA-DRB1 0.00025 1.81 0.00088 1.64
209312_x_at 100133484 HLA-DRB1 0.00088 1.27
209417_s_at 3430 IFI35 0.00076 1.61
209625_at 5283 PIGH 0.00049 –1.40
210072_at 6363 CCL19 0.00043 3.74
210084_x_at 7177 TPSAB1 0.00069 1.48 0.00213 1.39
210397_at 1672 DEFB1 0.00446 –1.44 0.00079 –1.50
210764_s_at 3491 CYR61 0.00055 2.00
210889_s_at 2213 FCGR2B 0.00026 1.87
210915_x_at 28639 TRBC1 0.00004 1.81
210982_s_at 3122 HLA-DRA 0.00260 1.64 0.00037 1.73
211395_x_at 9103 FCGR2C 0.00020 1.52 0.00104 1.41
211430_s_at 28396 IGH@ 0.00061 6.08
211645_x_at 0 Affy_211645_x_at 0.00044 3.53
211654_x_at 3119 HLA-DQB1 0.00025 2.28 0.00011 2.26
211796_s_at 28638 TRBC1 0.00044 1.74
211911_x_at 3106 HLA-B 0.00090 1.66 0.00051 1.65
212510_at 23171 GPD1L 0.00019 –1.51
212587_s_at 5788 PTPRC 0.00023 2.44
212588_at 5788 PTPRC 0.00063 2.68
212592_at 3512 IGJ 0.00031 5.70
213193_x_at 28639 TRBC1 0.00084 1.39
213321_at 594 BCKDHB 0.00006 –1.59
213539_at 915 CD3D 0.00047 1.46
213603_s_at 5880 RAC2 0.00012 1.76
214164_x_at 771 CA12 0.00005 –1.38
214382_at 54346 UNC93A 0.00090 –1.33
214669_x_at 3514 IGKC 0.00023 3.92
214677_x_at 3535 IGL@ 0.00027 6.02
214836_x_at 3514 IGKC 0.00053 2.76
215121_x_at 28815 IGL@ 0.00033 4.51
215176_x_at 100130100 LOC100130100 0.00038 4.37
215193_x_at 100133484 HLA-DRB1 0.00018 1.86 0.00038 1.73
215379_x_at 28815 IGL@ 0.00017 4.69
215646_s_at 1462 VCAN 0.00099 2.94
215867_x_at 771 CA12 0.00028 –1.34
215946_x_at 91353 IGLL3 0.00030 2.71
215952_s_at 4946 OAZ1 0.00097 1.34
216474_x_at 64499 TPSAB1 0.00019 1.60
216576_x_at 28299 IGKC 0.00091 2.96
217022_s_at 100126583 IGH@ 0.00008 6.43
217148_x_at 3535 IGL@ 0.00039 2.30
217235_x_at 28813 IGL@ 0.00084 1.72
217456_x_at 3133 HLA-E 0.00049 1.47 0.00843 1.31
217478_s_at 3108 HLA-DMA 0.00037 1.76 0.00270 1.55
217747_s_at 6203 RPS9 0.00032 1.38
217774_s_at 51504 HSPC152 0.00085 1.25
218024_at 51660 BRP44L 0.00010 –1.41 0.00381 –1.27
218170_at 51015 ISOC1 0.00087 –1.44
218192_at 51447 IP6K2 0.00092 1.24
218546_at 79762 C1orf115 0.00031 –1.38
219076_s_at 5827 PXMP2 0.00015 –1.90
219118_at 51303 FKBP11 0.00074 1.66
221523_s_at 58528 RRAGD 0.00281 –1.72 0.00025 –1.88
221524_s_at 58528 RRAGD 0.00092 –1.56
221581_s_at 7462 LAT2 0.00083 1.31
pressed probe sets were identified be-tween the DGFhiand noDGFhi sub-groups, indicating that transcriptionally these two groups of patients are very similar.
It is clear from the data presented (see Figure 2) that patients with 1-month
Table 3.Continued.
221651_x_at 3514 IGK@ 0.00036 3.84
221671_x_at 3514 IGK@ 0.00030 3.97
221875_x_at 3134 HLA-F 0.00075 1.55
34210_at 1043 CD52 0.00011 2.13 0.00918 1.59
217028_at 7852 CXCR4 0.00097 1.53
Only genes with a P value <0.001 in at least one of the comparisons are shown.
Figure 3.Graphic representation from canonical pathways using ingenuity pathways analysis of the antigen presentation signaling show-ing (in red) all the differentially expressed genes between noDGFloversus DGFlothat were overexpressed in noDGFlo. IFNγ, interfon-γ. LMP,
eGFR values ≤45 mL/min have a ten-dency to remain as such by 1 year post-transplantation and that eGFR may be in fact a more accurate clinical marker of short- and longer-term function than DGF (29,30). Further follow-up of these patients will reveal whether this ten-dency continues beyond the 1-year posttransplantation mark and whether the graft’s long-term function has been significantly affected by development of DGF or the persistent lower graft function.
In the present analyses, gene expres-sion changes effectively separated the DGFlogroup from the other three groups of patients. Upregulated genes differen-tially expressed in this group included various genes involved in T-cell activa-tion (DDOST, IL7R, CXCR4, ITGB2,
PTPRC, HLA-G, HLA-DQA1, CD48and
HLA-DMA) and/or chemotaxis (CXCL6,
CCL19, CCL5, CXCR4, ITGB2, RAC2and
VCAN).
The gene expression signals identi-fied in this subset of patients (DGFlo) suggest the presence of active donor antigen-presenting cells with the poten-tial of attracting and activating
recipi-ent T cells. Additionally, some of the gene signals identified may also sug-gest the presence of activated T cells al-ready present on the graft at preimplan-tation. These kidney grafts may
represent a set of real “poor-quality” grafts, reflected in the poorer medium-term graft function observed at 12 months after transplant. If such is the case, then these donor organs would re-quire early identification, ideally before implantation, to identify kidney trans-plant recipients at risk of lower long-term allograft function. Further investi-gation of these donor organs may eventually help improve organ alloca-tion and posttransplant management.
Kainz et al.(31) recently showed in a randomized control trial that steroid pretreatment of the deceased organ donor suppressed inflammation in the transplant organ but did not reduce the rate or duration of DGF. This study sought to elucidate those factors that caused DGF in the steroid-treated sub-jects. Genome-wide gene expression profiles were used from 20 pretreated donor organs and were analyzed on the level of regulatory
protein–protein interaction networks (32). A total of 63 significantly down-regulated sequences associated with DGF that could be functionally catego-rized according to Protein Analysis Through Evolutionary Relationships ontologies into two main biological processes (transport and metabolism) were identified. The recognized genes suggested hypoxia as the cause of DGF, which cannot be compensated by steroid treatment.
In summary, organ quality and clini-cal performance does not appear to be accurately captured by the DGF/noDGF classification. Stratification of patients on the basis of a combination of 1-month eGFR and DGF classification ap-pears to have more predictive value and be more relevant to medium-term (12-month) graft performance than DGF classification alone. Comparative GE profiling of preimplantation biopsies using this classification has identified a subgroup of DGF kidney transplant re-cipients with elevated expression of im-mune-related genes. A better under-standing of molecular pathways affected early on in the graft (that is, at preimplantation) may signal high risk for graft dysfunction, giving the chance for potential therapeutic approaches to be taken.
ACKNOWLEDGMENTS
The research results included in this report were supported by a National In-stitute of Diabetes and Digestive and Kidney Diseases grant (R01DK080074).
VR Mas, RF Mueller and DG Maluf participated in the research design. MJ Scian, JL Suh, KG David, AL King and TWB Gehr performed research. VR Mas, MJ Scian, KJ Archer and TF Mueller performed data analysis. VR Mas, MJ Scian, KJ Archer, MP Posner, TF Mueller and DG Maluf prepared the manuscript.
DISCLOSURE
The authors declare that they have no competing interests as defined by
Molec-ular Medicine, or other interests that
might be perceived to influence the re-sults and discussion reported in this paper.
REFERENCES
1. Veroux M, Corona D, Veroux P. (2009) Kidney transplantation: future challenges. Minerva Chir. 64:75–100.
2. Knoll G. (2008) Trends in kidney transplantation over the past decade. Drugs.68 Suppl 1:3–10. 3. Schold JD, Kaplan B. (2010) The elephant in the
room: failings of current clinical endpoints in kidney transplantation. Am. J. Transplant. 10:1163–6.
4. Mueller TF, Solez K, Mas V (2011). Assessment of kidney organ quality and prediction of outcome at time of transplantation. Semin. Immunopathol. 33:185–99.
5. Mas VR, Mueller TF, Archer KJ, Maluf DG. (2011) Identifying biomarkers as diagnostic tools in kid-ney transplantation. Expert Rev. Mol. Diagn. 11:183–96.
6. Yarlagadda SG, et al.(2008) Marked variation in the definition and diagnosis of delayed graft function: a systematic review. Nephrol. Dial. Transplant.23:2995–3003.
7. Moore J, et al.(2010) Assessing and comparing rival definitions of delayed renal allograft func-tion for predicting subsequent graft failure. Transplantation. 90:1113–6.
8. Hauser P, et al.(2004) Genome-wide gene-expres-sion patterns of donor kidney biopsies distin-guish primary allograft function. Lab. Invest. 84:353–61.
9. Kainz A, et al.(2004) Alterations in gene expres-sion in cadaveric vs. live donor kidneys suggest impaired tubular counterbalance of oxidative stress at implantation. Am. J. Transplant. 4:1595–6004.
10. Mueller TF, et al.(2008) The transcriptome of the implant biopsy identifies donor kidneys at in-creased risk of delayed graft function. Am. J. Transplant.8:78–85.
11. Melk A, et al.(2005) Transcriptional analysis of the molecular basis of human kidney aging using cDNA microarray profiling. Kidney Int. 68:2667–79.
12. Mas VR, et al.(2008) Gene expression patterns in deceased donor kidneys developing delayed graft function after kidney transplantation. Trans-plantation. 85:626–35.
13. Levey AS, et al.(1999) A more accurate method to estimate glomerular filtration rate from serum creatinine: a new prediction equation. Modifica-tion of Diet in Renal Disease Study Group. Ann. Intern. Med. 130:461–70.
14. Kainz A, et al.(2007) Gene-expression profiles and age of donor kidney biopsies obtained be-fore transplantation distinguish medium term graft function. Transplantation.83:1048–54. 15. Archer KJ, Dumur CI, Joel SE, Ramakrishnan V.
(2006) Assessing quality of hybridized RNA in
Affymetrix GeneChip experiments using mixed-effects models. Biostatistics.7:198–212.
16. Archer KJ, Guennel T. (2006) An application for as-sessing quality of RNA hybridized to Affymetrix GeneChips. Bioinformatics. 22:2699–701. 17. Gentleman RC, et al.(2004) Bioconductor: open
software development for computational biology and bioinformatics. Genome Biol.5:R80. 18. R Development Core Team. R: A language and
environment for statistical computing. R Founda-tion for Statistical Computing, Vienna, Austria, 2007.
19. Collini A, et al.(2006) Long-term outcome of renal transplantation from marginal donors. Transplant. Proc.38:3398–99.
20. Chen J, Bardes EE, Aronow BJ, Jegga AG. (2009) ToppGene Suite for gene list enrichment analysis and candidate gene prioritization. Nucleic Acids Res. 37 (Web Server issue):W305.
21. Fraser SM, et al.(2010) Acceptable outcome after kidney transplantation using “expanded criteria donor” grafts. Transplantation. 89:88–96. 22. Ciancio G, et al.(2010) Favorable outcomes with
machine perfusion and longer pump times in kidney transplantation: a single-center, observa-tional study. Transplantation. 90:882–90. 23. Mühlberger I, Perco P, Fechete R, Mayer B,
Ober-bauer R. (2009) Biomarkers in renal transplanta-tion ischemia reperfusion injury. Transplantation. 88 Suppl 3:S14–9.
24. Yarlagadda SG, Klein CL, Jani A. (2008) Long-term renal outcomes after delayed graft function. Adv. Chronic Kidney Dis.15:248–56.
25. Tyson M, et al.(2010) Early graft function after la-paroscopically procured living donor kidney transplantation. J. Urol.184:1434–9.
26. Suri D, Meyer TW. (1999) Influence of donor fac-tors on early function of graft kidneys. J. Am. Soc. Nephrol.10:1317–23.
27. Ciancio G, et al.(2010) Favorable outcomes with machine perfusion and longer pump times in kidney transplantation: a single-center, observa-tional study. Transplantation. 90:882–90. 28. Tyson M, et al.(2010) Early graft function after
la-paroscopically procured living donor kidney transplantation. J. Urol.184:1434–9. 29. Hawley CM, et al.(2007) Estimated donor
glomerular filtration rate is the most important donor characteristic predicting graft function in recipients of kidneys from live donors. Transpl. Int.20:64–72.
30. Johnston O, et al.(2006) Reduced graft function (with or without dialysis) vs. immediate graft function: a comparison of long-term renal allo-graft survival. Nephrol. Dial. Transplant. 21:2270–4.
31. Kainz A, et al.(2010) Steroid pretreatment of organ donors to prevent postischemic renal allo-graft failure: a randomized, controlled trial. Ann. Intern. Med.153:222–30.