www.clim-past.net/13/93/2017/ doi:10.5194/cp-13-93-2017
© Author(s) 2017. CC Attribution 3.0 License.
Temperature variability in the Iberian Range since 1602 inferred
from tree-ring records
Ernesto Tejedor1,2,3, Miguel Ángel Saz1,2, José María Cuadrat1,2, Jan Esper3, and Martín de Luis1,2 1University of Zaragoza, 50009 Zaragoza, Spain
2Environmental Sciences Institute of the University of Zaragoza, Zaragoza, Spain 3Department of Geography, Johannes Gutenberg University, 55099 Mainz, Germany
Correspondence to:Ernesto Tejedor ([email protected])
Received: 18 January 2016 – Discussion started: 2 February 2016
Revised: 26 December 2016 – Accepted: 18 January 2017 – Published: 9 February 2017
Abstract.Tree rings are an important proxy to understand the natural drivers of climate variability in the Mediterranean Basin and hence to improve future climate scenarios in a vul-nerable region. Here, we compile 316 tree-ring width series from 11 conifer sites in the western Iberian Range. We ap-ply a new standardization method based on the trunk basal area instead of the tree cambial age to develop a regional chronology which preserves high- to low-frequency variabil-ity. A new reconstruction for the 1602–2012 period correlates at−0.78 with observational September temperatures with a cumulative mean of the 21 previous months over the 1945– 2012 calibration period. The new IR2Tmax reconstruction is spatially representative for the Iberian Peninsula and captures the full range of past Iberian Range temperature variability. Reconstructed long-term temperature variations match rea-sonably well with solar irradiance changes since warm and cold phases correspond with high and low solar activity, re-spectively. In addition, some annual temperature downturns coincide with volcanic eruptions with a 3-year lag.
1 Introduction
The Intergovernmental Panel on Climate Change (IPCC, 2013) highlighted a likely increase in average global tem-peratures in the coming decades, pointing particularly to the Mediterranean Basin, and therefore also the Iberian Penin-sula (IP), as a region of substantial modeled temperature changes. The Mediterranean area is located in the transi-tional zone between tropical and extratropical climate sys-tems, characterized by complex topography and high
cli-matic variability (Hertig and Jacobeit, 2008). When taking into account these features, even relatively minor modifi-cations of the general circulation, i.e., a shift in the loca-tion of sub-tropical high pressure cells, can lead to substan-tial changes in Mediterranean climate (Giorgi and Lionello, 2008), making the study area a potentially vulnerable region to anthropogenic climatic changes by anthropogenic forces, i.e., increasing concentrations of greenhouse gases (Lionello et al., 2006a).
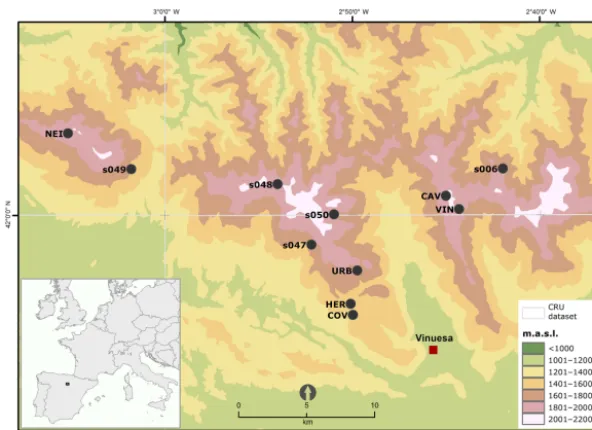
Figure 1.Map showing the tree-ring study sites and the climate data (CRU TS v.3.22) grid points in the western Iberian Range (Soria).
and temperature (Büntgen et al., 2008; Dorado Liñán et al., 2012, 2014; Esper et al., 2015a). Nevertheless, a temperature reconstruction for central Spain is still missing.
Several studies have been made to develop a tempera-ture reconstruction for the Iberian Range (IR; see Fig. 1) using Pinus uncinatatree-ring data (Creus and Puigdefab-reas, 1982; Ruiz, 1989). The results, in fact, showed a pro-nounced interannual- to century-scale chronology variability. However, their main result was a complex growth response function due to a mixed climate signal instead of a temper-ature reconstruction. Furthermore, Saz (2003) developed a 500-year temperature reconstruction for the Ebro Depression (north of Spain), but this chronology is based on a reduced number of cores and a standardized methodology that did not retain the medium- and low-frequency variance.
Here we present the first tree-ring dataset combining sam-ples from three different sources from the eastern IR extend-ing back from the Little Ice Age (1465) to present (2012). The aim of this study is to develop a temperature recon-struction representing the IR, and thereby fill the gap be-tween records located in the northern and southern IP. A new methodology, based on basal area instead of the cambial age, was applied to preserve high- to low-frequency variance in the resulting chronology. Furthermore, the relationship be-tween the tree-ring and climate data is reanalyzed by adding memory to the climate parameters, since memory effects on tree-ring data are much less acknowledged (Anchukaitis et al., 2012). This analysis is challenging because of the mix of tree species and their unidentified responses to climate. The resulting reconstruction of September maximum tem-peratures over the past four centuries is compared with latest findings from the Pyrenees and Cazorla as well as with the
relationship with solar and volcanic forcings at interannual to multi-decadal timescales.
2 Material and methods
2.1 Site description
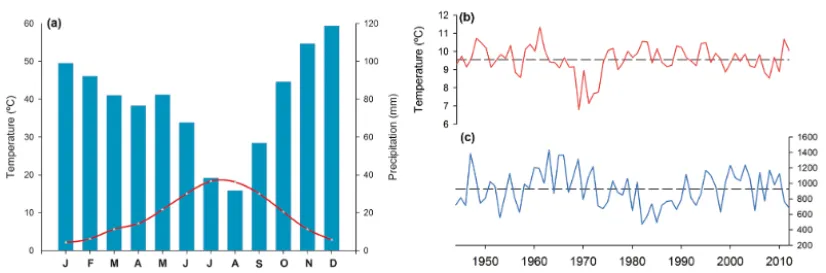
We compiled a tree-ring network from 11 different sites in the western IR (Table 1) in the province of Soria. Urbión is the most extensive forest of the IP including 120 000 ha between the Burgos and Soria provinces. It has a long for-est management tradition. Therefore, all sites are situated at high-elevation locations where forests are least exploited and maximum tree age is reached (Fig. 1). The altitude of the sampling sites ranges from 1500 to 1900 m above sea level (m a.s.l.) with a mean of 1758 m a.s.l. These forests belong to the continental bioclimatic belt (Guijarro, 2013), charac-terized by moderate mean temperatures (9.5◦C, Fig. 2b) and a large seasonal range including more than 90 frost days and summer heat exceeding 30◦C. Mean annual precipitation for the period 1944–2014 is 927 mm (CRU TS.3 v.23 dataset by Harris et al., 2014) and reaches its maximum during Decem-ber (Fig. 2a, c).
Table 1.Tree-ring sites’ characteristics.
Code Site Source Lat Long Elevation Species Tree no. Sample no. Tree rings Period s047 Urbión Covaleda ITRDB 41.98 −2.87 1750 PISY 15 31 6549 1567–1983 s048 Urbión Duruelo ITRDB 42.02 −2.90 1840 PISY 8 17 3590 1671–1983 s049 Urbión Quintenar ITRDB 42.03 −3.03 1840 PISY 12 27 4713 1593–1985 s050 Urbión Vinuesa ITRDB 42.00 −2.85 1750 PISY 4 8 1942 1681–1983 s006 Urbión ITRDB 42.03 −2.7 1634 PISY 11 22 2397 1842–1977 CAV Castillo de Vinuesa UNIZAR 42.01 −2.75 1900 PIUN 18 36 9236 1593–2012 COV Covaleda IPE-CSIC-UNIZAR 41.93 −2.83 1500 PISY 16 48 14 696 1568–1993 HER Barranco de las heridas IPE-CSIC-UNIZAR 41.94 −2.84 1500 PISY 25 32 9347 1562–1993 NEI Neila IPE-CSIC-UNIZAR 42.05 −3.08 1850 PISY 9 15 4822 1587–1992 URB Picos de Urbión UNIZAR 41.96 −2.82 1750 PISY 28 60 11 328 1733–2012 VIN Castillo de Vinuesa IPE-CSIC-UNIZAR 42.03 −2.73 1900 PIUN 13 20 7653 1465–1992
Total 159 316 76 273
UNIZAR, University of Zaragoza;IPE-CSIC, Spanish National Research Council;ITRDB, International Tree-Ring Data Bank.
Figure 2.Climate diagram(a), mean temperature(b), and mean precipitation(c)calculated using data from CRU TS v.3.22 over the period 1944–2012 (Harris et al., 2014).
2.2 Tree-ring chronology development
The new dataset is composed by 316 tree-ring width (TRW) series of Pinus uncinata(56) andPinus sylvestris(260) lo-cated in the western IR (Table 1, Fig. 1). The most recent samples were collected during the field campaign in 2013, including old dominant and co-dominant trees with healthy trunks and no sign of human interference. We extracted two core samples from each tree at breast height (1.3 m) when possible; otherwise, we tried to avoid compression wood due to steep slopes, compiling a set of 96 new samples from two sites, with the outermost ring being 2012. Core sam-ples were air-dried and glued onto wooden holders and sub-sequently sanded to ease growth ring identification (Stokes and Smiley, 1968). The samples were then scanned and syn-chronized using CoRecorder software (Larsson, 2012) (Cy-bis Dendrochronology, 2014) to identify the position and ex-act dating of each ring. The tree-ring width was measured, at 0.01 mm precision, using a LINTAB table (Rinn, 2005). Prior to detrending, COFECHA (Holmes, 1983) was used to assess the cross-dating of all measurement series.
An additional set of 95 samples from three sites was provided by the project CLI96-1862 (Creus et
al., 1992; Saz, 2003); the outermost rings range from 1992 to 1993. Finally, a set of 125 samples from five sites was downloaded from the International Tree Ring Data Bank (ITRDB, http://www.ncdc.noaa.gov/data-access/ paleoclimatology-data/datasets/tree-ring). These data were developed in the 1980s by K. Richter and collaborators; the outermost rings range from 1977 to 1985.
In order to attempt a climate reconstruction for the western IR from this tree-ring network, we perform an exploratory analysis of the 11 tree-ring sites by creating a correlation ma-trix of the raw TRW series for each site and the correlation with a composite regional chronology. Calculations are com-puted for the common period (1842–1977) and for the full period (1465–2012).
Standardization methods
most of the standardization methods a varying proportion of the low-frequency climatic information is also lost in the process (Grudd, 2008). When the aim is to use tree-ring chronologies as a proxy for climatic reconstructions, an ad-equate standardization is critical and the best method should preserve high- to low-frequency variations (Büntgen et al., 2004). It is common practice to calculate a mean value func-tion as the best estimate of the trees’ signal at a site (Frank et al., 2006).
We here applied four standardization methods to the 316 TRW measurement series to develop a single tree-ring in-dex chronology. (i) To emphasize interdecadal and higher-frequency variations, each ring width series was fitted with a cubic spline with a 50 % frequency response cut off at 67 % of the series length (Cook et al., 1990). A bi-weight robust mean was calculated to assemble the ArstanSTD re-gional chronology. (ii) A residual chronology (ArstanRES) is produced after removing first-order autoregression to em-phasize high-frequency variability. (iii) To preserve common interdecadal and lower-frequency variations, regional curve standardization (RCS) was applied (Mitchell, 1967; Briffa et al., 1992; Esper et al., 2003). RCS is an age-dependent com-posite method and involves dividing the size of each tree-ring by the value expected from its cambial age. To assem-ble the chronology, all the series are aligned by cambial age. A single growth function (regional curve, RC) smoothed us-ing a spline function of 10 % of the series length is fit to the mean of all age-aligned series. A biweight robust mean was applied to develop the RCS chronology (RCS). (iv) To pre-serve high- to low-frequency variance, we additionally ap-plied a novel standardization method based on the principles of RCS. However, instead of using the cambial age of the trees as the independent variable, we used their sizes, calcu-lated as the basal area of the tree in the year prior to ring for-mation. Then, a Poisson regression model was used to fit the individual tree-ring widths. Standardized indices were calcu-lated as the ratio between the observed and predicted values, and a biweight robust mean was used to develop the basal-area Poisson chronology (BasPois).
To evaluate uncertainty in the mean chronologies, run-ning interseries correlations (Rbar) and the express popula-tion signal (EPS) were calculated (Wigley et al., 1984). Rbar is a measure of the strength of the common growth “signal” within the chronology (Wigley et al., 1984; Briffa and Jones, 1990), here calculated in a 50-year window sliding along the chronology. EPS is an estimate of the chronology’s ability to represent the signal strength of a chronology on a theoreti-cally infinite population (Wigley et al., 1984).
2.3 Climatic data, calibration, and climate reconstruction Monthly temperature (mean, maximum, and minimum) and precipitation values from the gridded CRU TS v.3.22 dataset (0.5◦ resolution) dataset for the period 1945–2012 were used (Harris et al., 2014). The three grid points closest to
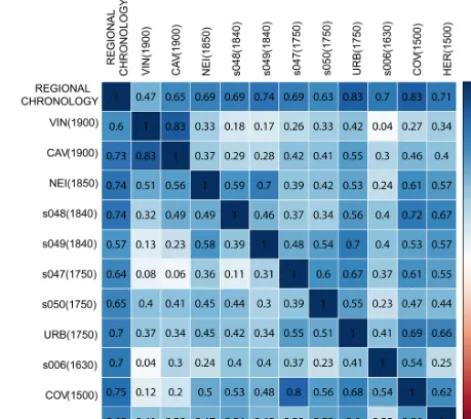
Figure 3.Correlation of the raw chronologies sorted by elevation. Top right shows the correlations calculated over the common period 1842–1977. Bottom left shows the correlation over the full period of overlap between pairs of chronologies
the tree-ring network were averaged to develop a regional time series (Fig. 1). In addition, we calculate a cumula-tive monthly mean for each of the four parameters (max., min., mean temperature, and monthly precipitation). The cu-mulative mean is calculated by adding the months gradu-ally. First the previous month is added, and then further months are included up to 36 previous months. For the cal-culations we take into account the current and the previ-ous year. To indicate the climate parameter an abbrevia-tion will be set as Temperaturemax, mean, or min_Cumulative months_Calendar month−1,for previous year. For instance, the maximum temperature of the previous year October with 20 months of cumulative monthly mean will be referred to asTmax_20_Oct−1.
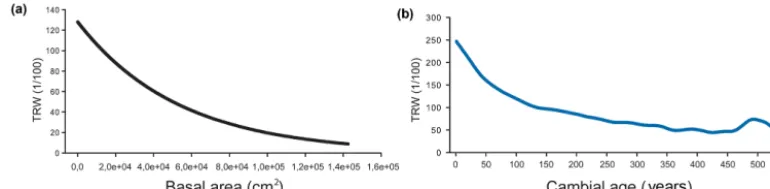
Figure 4.Panel(a)represents the model of the BasPois method, and(b)represents the regional curve of the RCS method.
A split calibration/verification approach was perform over the periods 1945–1978 and 1979–2012 to evaluate the accu-racy of the transfer model considering the following metrics; Pearson’s correlation (r), coefficient of determination (r2), reduction of error (RE), mean square error (MSE), the sign test (Cook et al., 1994), and the Durbin–Watson test (Durbin and Watson, 1951).Ris a measure of the linear correlation between the chronology and climatic variable. R2indicates how well the data fit a statistical model. Anr2of 1 indicates that the regression line perfectly fits the data; anr2of 0 in-dicates that there is not fit at all. RE compares the skill of the estimated values with that obtained by using the mean value of the calibration period for every year. It is particulary useful since it checks whether a proxy is able to follow the lower-frequency changes in climate between the calibration and verification periods (Wahl and Amman, 2007) and hence it provides a sensitive measure of the reliability of a recon-struction (Cook et al., 1994; Akkemik et al., 2005; Büntgen et al., 2008); it ranges from+1, indicating perfect agreement, to minus infinity. MSE estimates the difference between the modeled and measured while sign test compares the num-ber of agreeing and disagreeing interval trends, from year to year, between the observed and reconstructed series (Fritts et al., 1990; ˇCufar et al., 2008). To verify that there is no au-tocorrelation in the residuals we perform the Durbin–Watson test. Additionally, a superposed epoch analysis (SEA; Panof-sky and Brier, 1958) was performed using dendrochronol-ogy program library in R (dplR) (Bunn, 2008) to assess post-volcanic cooling signals in our reconstruction. The approach has been used in studies of volcanic effect on climate (Fis-cher et al., 2007; D’Arrigo et al., 2009; Esper et al., 2013a, b). The major volcanic events chosen for the analysis were those identified by Crowley (2000), in order of magnitude (1815, 1641, 1809, 1831, 1992, 1883, 1902, 1695, 1674, and 1783).
To transfer the TRW chronology into a temperature recon-struction a linear regression model was used. The tempera-ture was set as the dependent variable and the chronology as the independent variable, and then we used ordinary least squares assuming Gaussian independent errors to estimate the regression coefficient. The magnitude and the spatial ex-tent of the climate signal are evaluated considering the CRU TS v. 3.22 gridded dataset for Europe.
3 Results
The correlation matrix (Fig. 3) shows not only the high in-tercorrelation between sampling sites and tree species but also the high correlation between each chronology and the regional chronology. The highest correlation is found within Pinus uncinata(VIN and CAV) located at the highest alti-tude. On the other hand, the weakest correlation is found be-tween one of the lowest sites (s006) and the highest (VIN). The mean correlation among all sampling sites isr=0.51 over the common period (1842–1977) is 0.51, andr=0.46 over the full period of overlap, revealing a regionally com-mon, external forcing controlling tree growth and justifying the development of a single chronology integrating the data from this IP tree-ring network.
The model (regional curve) of the RCS method and the model of the BasPois method are presented in Fig. 4. The BasPois model (Fig. 4a) indicates a growth of 130 mm when the size of the basal area is near 0 and a growth of 8 mm when it reaches the maximum basal area. RCS model (Fig. 4b) presents values of 250 mm of growth when the cambial age is 0 with a gradual decline in the growth until the cambial age of 450. At cambial ages from 500 to 550, a slight increase in growth is observed that is most likely derived by low repli-cation regarding trees with these ages. The four chronologies after different detrending methods are shown in Fig. 6.
Calibration of the four differently detrended mean chronologies reveals a highly negative correlation with monthly mean of daily maximum temperatures (Fig. 5). The ArstanRES chronology shows moderate correlations with previous-year September (r= −0.39), and the Ar-stanSTD chronology correlates at r= −0.56 with both
Tmax_21_Sep−1 and Tmax_21_Oct−1. Considering the RCS chronology, the Tmax_21_Sep−1 signal increases to r= −0.57. Finally, the best correlation is revealed for the BasPois chronology reaching r= −0.78 with
Figure 5.Correlation between the monthly mean of daily maximum temperature (from January of the previous year to December of the cur-rent year with a cumulative monthly mean from 1 to 36 months) and the residual Arstan chronology(a), the standard Arstan chronology(b), the RCS standard chronology(c), and the basal-area Poisson standard chronology(d).
Figure 6.The four chronologies after different detrending methods for the EPS>0.85 period; BasPois chronology (in orange), RCS chronology (in green), ArstanSTD chronology (in yellow), Arstan-RES chronology (in blue), and number of samples (in black).
The final BasPois network chronology (Fig. 6) is based on 316 TRW series of Pinus uncinataandPinus sylvestris spanning the 1465–2012 period. Since this chronology is de-rived from only living trees, mean chronology age increases from 47 years in 1966 to 528 in 1465. The mean sensitivity is 0.21, the first-order autocorrelation is 0.83 and the inter-series correlation (Rbar) reaches 0.26. The network chronol-ogy’s signal-to-noise ratio is 48.52, and EPS exceeds 0.85 af-ter 1602, constraining the reconstruction period to 410 years until 2012.
The selection of the best climate parameter to develop the reconstruction is presented in the Fig. 7, where correlations between−0.54 and−0.86, representing only the most
signif-icant values, are shown. Four parameters reveal the highest correlations over the full calibration period: Tmax_22_Oct,
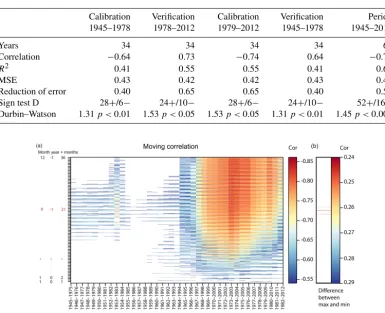
Table 2.Calibration/verification statistics of the IR2Tmax reconstruction.
Calibration Verification Calibration Verification Period
1945–1978 1978–2012 1979–2012 1945–1978 1945–2012
Years 34 34 34 34 68
Correlation −0.64 0.73 −0.74 0.64 −0.78
R2 0.41 0.55 0.55 0.41 0.61
MSE 0.43 0.42 0.42 0.43 0.43
Reduction of error 0.40 0.65 0.65 0.40 0.56
Sign test D 28+/6− 24+/10− 28+/6− 24+/10− 52+/16−
Durbin–Watson 1.31p <0.01 1.53p <0.05 1.53p <0.05 1.31p <0.01 1.45p <0.001
Figure 7.(a)Thirty-year moving correlation from 1945 to 2012 between the monthly mean of daily maximum temperature, from January of the current year (1, 0, 1) to December of the previous year (12,−1, 36) with a cumulative monthly mean from 1 to 36 months and the BasPois chronology. Red numbers indicate the chosen climatological parameter: 9, September,−1, previous year, 21, months used for the cumulative monthly mean.(b)The four best parameters are represented. The reddish line indicates the least difference between the maximum and minimum correlation in the correlation periods.
mean of 21 months (Eq. 1), denoted IR2Tmax:
IR2Tmax= −3.9759·BasPoisChron
+15.769(r2=0.61; p <0.0001). (1)
3.1 IR2Tmax reconstruction
IR2Tmax describes 410 years of maximum temperature of
Tmax_21_Sep−1, meaning it has memory of the last 2 years. Biennial temperature ranges from 13.52◦C (−2.13◦C with respect to the mean) in 1603 to 17.64◦C (+1.94◦C with re-spect to the mean) in 2005 (Fig. 9). It is remarkable that, from 1602, 12 of the 25 warmest biennial periods happen during the 20th and 21st centuries. IR2Tmax covers a part of the Little Ice Age (Grove, 1998) from 1602 to the end of the 19th century. The temperature variability is 3.92◦C in the 17th century, 2.89◦C in the 18th century, 3.17◦C in the 19th century and 3.07◦C in the 20th century. The 17th and 18th centuries were the coldest of the reconstruction with 73 and
80 % of the biennials with temperatures below the long-term mean, respectively. On the other hand, the 19th and the 20th centuries were the warmest, with 66 and 78 % of the biennial periods exceeding the mean.
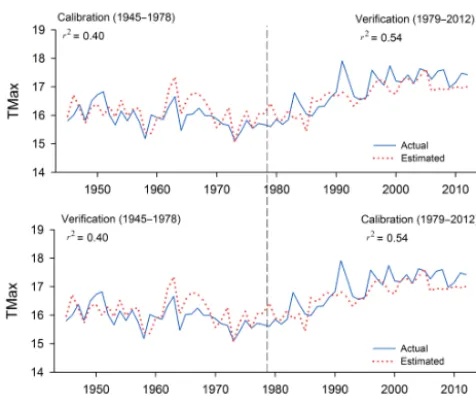
Figure 8.Calibration and verification results of the CRU data-based
Tmax_21_Sep−1reconstruction.
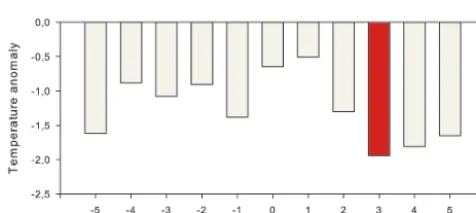
The SEA (Fig. 10) indicates some impact of volcanic erup-tions on the short-term temperature variability within the re-construction. It shows significance (p <0.05) decrease in September’s temperature with a lag of 3 years.
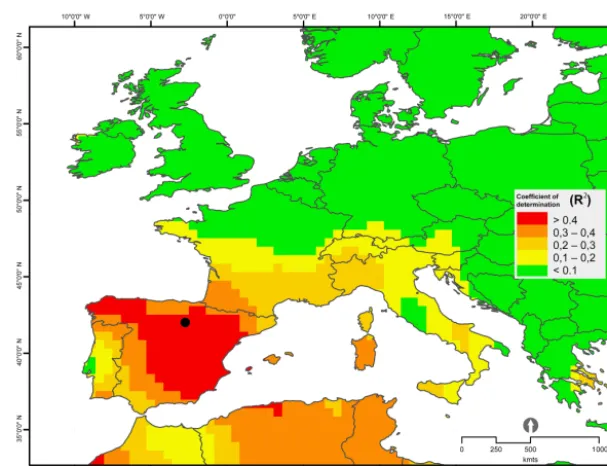
Figure 11 shows the spatial correlation between the re-construction and the CRU TS v.3.22 for Europe and north-ern Africa. A high coefficient of determination (r2>0.4,
p <0.0001) indicates a robust agreement and spatial extent of the reconstruction over the Iberian Peninsula (IP), espe-cially for the central and Mediterranean Spain. The spatial correlation, however, decreases towards the southwest of the IP and the north of Europe.
4 Discussion and conclusion
A novel detrending approach, considering a basal-area Pois-son model (BasPois) instead of the traditional regional curve (Esper et al., 2003), has certainly improved the skill of the reconstruction and enabled retaining high- to low-frequency climate variance. The traditional approach of using RCS with the mean TRW curve of the age-aligned data only reached correlations with theTmax_21_Sep−1up tor= −0.57, while with the new approach reachedr= −0.78.
Observed improvements in the reconstruction’s skills as-sociated to the BasPois detrending approach need to be determined in other species and environmental conditions. However, several theoretical and practical advantages can be highlighted: (1) similarly to RCS, BasPois used all indi-vidual tree-ring measurements to complete a single detrend-ing. High but also medium- and low-frequency variability is then successfully preserved in the chronology in a similar way as has been described for the RCS method. (2) Remov-ing biological trends from raw tree-rRemov-ing measurements
rep-resents the key objective of the detrending processes. How-ever, it is usually difficult to determine the extent to which the effects of environmental factors on tree growth depend on age (genetic control) and/or on size (physiological control). Recent investigations suggest that key functional processes (and therefore potential physiological constraints) on trees are more dependent on their size than on their age (Men-cuccini et al., 2005; Peñuelas, 2005). Climate growth rela-tionships have indeed demonstrated to be strongly depen-dent on the size of the trees, with the differences between size classes even greater than the differences found amongst age classes or even between different species (de Luis et al., 2009). Hence, the size-based standardization considered in the BasPois approach could represent a suitable alternative to age-based standardization processes (such as RCS) in order to isolate the evidence of external, climatically driven forc-ing of tree growth. (3) By usforc-ing standard dendrochronolog-ical samples, it is usually not possible to exactly determine the age of the trees and subsequently the cambial age of each individual tree ring. As a consequence, age-based standard-ization processes should be often based on age estimations instead of directly measured values. However, the diameter at breast height (DBH) is a parameter that is routinely obtained during the dendrochronological sampling, and then the size of each tree prior to the formation of any tree ring can be directly and unequivocally determined. (4) Finally, a clear additional advantage is related to the possibility to design a sampling strategy including trees of different size classes in order to obtain a more unbiased distribution of tree rings in relation to the independent variable used for the detrend-ing. To the best of our knowledge, size-based standardization processes as tested for our database have not been applied elsewhere. Further research is needed to generalize the ad-vantages of such an approach.
According to the previously discussed novel detrending approach and based on a coherent network of 11 tree-ring sites in the IR including 316 TRW series, we developed a 410-year maximum September temperature reconstruction. This record is the first climate reconstruction for the IR fill-ing the gap between the temperature reconstructions devel-oped for the north IP (Büntgen et al., 2008; Dorado Liñán et al., 2012; Esper et al., 2015a) and for the southern IP (Do-rado Liñán et al., 2014). The IR2Tmax has been achieved us-ing TRW, which is the same parameter used for the southern IP (Dorado Liñán et al., 2014). However, for the Pyrenees, maximum latewood density (MXD) (Büntgen et al., 2008; Dorado Liñán et al., 2012) or stable isotopes (Esper et al., 2015a) are needed to get skillful records for a temperature reconstruction.
informa-Figure 9.IR2Tmax reconstruction since AD 1602 for the Iberian Range. The bold red curve is an 11-year running mean, and grey shading indicates the mean square error based on the calibration period correlation. Yellow shading at the bottom shows solar forcing and bars on top indicate volcanic forcings (Crowley, 2000).
Figure 10.Superposed epoch analysis with a back and forward lag of 5 years. Significance (p <0.05) at 3 years after the extreme vol-canic events identified in Crowley (2000).
tion in the chronology. The mean correlation between sites for the common period (r=0.51, Fig. 3) reveals substan-tial agreement between the sites and species. Correlation is strongest among high-elevation sites, including the sites VIN and CAV, which are both derived fromPinus uncinata. The regional climate variability was retained quite accurately by the mean chronology (including 48.52 of signal to noise), which highlights the beauty of regional averages (Briffa et al., 1998).
The original, raw chronology extended over the 1465– 2012 period, some 150 years longer than the final reconstruc-tion. However, due to low EPS values prior to 1602, which is related to the low number of samples, the final reconstruction was developed for the period 1602–2012.
In this study, we detected a maximum temperature corre-lation withTmax_21_Sep−1of−0.78. Nonetheless, the nega-tive temperature correlation is already shown for the previous September (r= −0.56, with BasPoisChron) without any cu-mulative monthly mean. That would mean that, within the environment in which trees are growing and with respect to the mean, they will grow more in cold than in hot years.
This negative temperature correlation has been reported in numerous dendroclimatic studies (i.e., Büntgen et al., 2007; van der Werf et al., 2007), including the most recently devel-oped climatic reconstruction for the Iberian Peninsula by Do-rado Liñán et al. (2014) showing a negative correlation with previous summer temperatures. One of the strengths of the results is adding the cumulative monthly mean to the climate variables, which maximizes the correlation tor= −0.78.
The development of climate parameters retaining temper-ature information of the past 2 years is certainly unusual and distinctive. However, memory effects in TRW data can arise from physiological processes already suggested by Schul-man (1956) and Matalas (1962). Moreover, it is well known that TRW growth is conditioned by the storage of starch and sugar in parenchyma ray tissue and the remobilization of car-bohydrates from root structures that were storage in previous growing seasons (Pallardy, 2010).
In addition, radial growth of trees is strongly conditioned by total needle biomass available in trees at the start of the growing season (Wang et al., 2012). In pine species, mean needle age ranges from 2 to 4 years (Pensa and Jalkanen, 2005) and the amount of needles formed is also controlled by temperature variations during the years of formation. As a consequence, effects of temperature variability occurred several years before tree-ring formation may have played an important role in secondary growth (radial increment) indi-rectly through their direct effect in primary production (nee-dle formation). Further research and specific experiments are however needed to confirm such influences and determine the physiological mechanisms behind a climate signal that extends back up to 21 months.
Figure 11.Map showing the spatial correlation patterns of the BasPois chronology with the griddedTmax_21_Sep−1. Correlation values
are significant atp <0.0001.
2015b). Thus, developing the 2-year memory IR2Tmax al-lowed us to maintain not only the low-frequency signal, high-lighting the warm and cold phases, which may be explained by the high correlation with solar activity during 410 years (0.34, p <0.001), but also the high-frequency signal, em-phasizing the memory effects of the volcanic eruptions in TRW, already studied by Briffa et al. (1998) and recently by Esper et al. (2015b). According to the SEA (Fig. 9), the volcanic eruptions have a significance reduction (95 % con-fidence) of September’s temperature (−1.98◦C) with a 3-year lag. However, the IR2Tmax already considers the two previous years’ temperature, which means the temperature decrease occurred the year after the extreme volcanic event, in consistency with Frank et al. (2007). The stability of the signal was assessed by a 30-year moving correlation from 1945 to 2012, which shows a better correlation for the period 1979–2012 in agreement with the rise in temperatures ob-served for last decades which may be limiting TRW growth and therefore magnifying the climate signal. However, the relationship between the chronology and the climate param-eter chosen never drops below−0.54 within the calibration period 1945–2012. The negative correlation with maximum temperature of previous September is in agreement with the values detected in Cazorla by Dorado Liñán et al. (2014). Presumably, a continuous rise in temperatures, as suggested by the IPCC (2013), would also cause a continuous decrease in tree-ring growth.
Even though the CRU dataset spans the 1901–2013 pe-riod, the distribution of meteorological observatories in the Iberian Range of Spain did not begin until the mid-20th cen-tury (González-Hidalgo et al., 2011). In fact, the closest
in-strumental weather station, located in Vinuesa (Fig. 1), be-gan in 1945. However, due to the large amount of gaps in the time series, the CRU dataset was used instead for the split calibration/verification approach for the period 1945–2012. The advantages of regional climatic averages have already been addressed by Blasing et al. (1981), who stated that the average climatic record of the gridded dataset over the study area is representative of the regional climatic conditions and does not reflect microclimate conditions which may be char-acteristic of the climatic record at a single station. Tree-ring data might therefore have more variance in common with the regionally averaged climatic record than with the climatic record of the nearest weather station. Generally, studies have shown that the measurements of MXD produce chronolo-gies with an improved climatic signal (Briffa et al., 2002) as it was revealed for summer temperature reconstructions (Hughes et al., 1984; Büntgen et al., 2008; Matskovsky and Helama, 2014). However, based on a TRW chronology, the high correlation coefficient is remarkable for the full calibra-tion period and the CRU dataset (r= −0.78).
al-though it is not present in the Pyrenees or in the Alps (Dorado Liñán et al., 2014).
Through the spatial extent and magnitude of the IR2Tmax reconstruction over Europe, it can be acknowledged that the reconstruction is effective and usable for most of the Spanish Iberian Peninsula and works especially well for the central and Mediterranean Iberian Peninsula, with a very high coef-ficient of determination (r2>0.4).
5 Data availability
The data used for this study can be downloaded at http://www.dendroteam.com/#download-data (Tejedor et al., 2017).
Competing interests. The authors declare that they have no con-flict of interest.
Acknowledgements. This study was supported by the Span-ish government through the projects “CGL2011-28255” and “CGL2015-69985” and by the government of Aragon through the program of research groups (group Clima, Cambio Global y Sistemas Naturales, BOA 147 of 18-12-2002) and FEDER funds. Ernesto Tejedor is supported by the government of Aragon with a PhD grant. Fieldwork was carried out in the province of Soria; we are most grateful to its authorities for supporting the sampling campaign. We are thankful to Klemen Novak, Edurne Martinez, Luis Alberto Longares, and Roberto Serrano for help during field-work. We would also like to thank the anonymous reviewers for their insightful comments, as these comments led to improvements in our work.
Edited by: V. Rath
Reviewed by: four anonymous referees
References
Akkemik, Ü., Da deviren, N., and Aras, A.: A preliminary recon-struction (A.D. 1635–2000) of spring precipitation using oak tree rings in the western Black Sea region of Turkey, Int. J. Biomete-orol., 49, 297–302, 2005.
Anchukaitis, K. J., Breitenmoser, P., Briffa, K. R., Buchwal, A., Büntgen, U., Cook, E. R., D’Arrigo, R. D., Esper, J., Evans, M. N., Frank, D., Grudd, H., Gunnarson, B. E., Hughes, M. K., Kirdyanov, A. V., Körner, C., Krusic, P. J., Luckman, B., Melvin, T. M., Salzer, M. W., Shashkin, A. V., Timmreck, C., Vaganov, E. A., and Wilson, R. J. S.: Tree rings and volcanic cooling, Nat. Geosci., 5, 836–837, 2012.
Barriendos, M.: Climatic variations in the Iberian Peninsula during the late Maunder minimum (AD 1675–1715): An analysis of data from rogation ceremonies, Holocene, 7, 105–111, 1997. Blasing, T. J., Duvick, D. N., and West, D. C.: Dendroclimatic
cali-bration and verification using regionally averaged and single sta-tion precipitasta-tion data, Tree-Ring Bull., 41, 37–43, 1981.
Briffa, K. R. and Jones, P. D.: Basic chronology statistics and as-sessment, in: Methods of Dendrochronology: Applications in the Environmental Sciences, edited by: Cook, E. R. and Kairiukstis, L. A., 137–152, International Institute for Applied Systems Anal-ysis (IIASA), Kluwer Academic Publishers, Dordrecht, 1990. Briffa, K. R., Jones, P. D., Bartholin, T. S., Eckstein, D.,
Schwe-ingruber, F. H., Karlén, W., Zetterberg, P., and Eronen, M.: Fennoscandian summers from ad 500: temperature changes on short and long timescales, Clim. Dynam., 7, 111–119, 1992. Briffa, K. R., Jones, P. D., Schweingruber, F. H., and Osborn, T. J.:
Influence of volcanic eruptions on Northern Hemisphere summer temperature over the past 600 years, Nature, 393, 450–455, 1998. Briffa, K. R., Osborn, T. J., Schweingruber, F. H., Jones, P. D., Shiy-atov, S. G., and Vaganov, E. A.: Tree-ring width and density data around the Northern Hemisphere: Part 1, local and regional cli-mate signals, Holocene, 12, 737–757, 2002.
Bunn, A. G.: A dendrochronology program library in R (dplR), Dendrochronologia, 26, 115–124, 2008.
Büntgen, U., Esper, J., Schmidhalter, M., Frank, D. C., Treydte, K., Neuwirth, B., and Winiger, M.: Using recent and historical larch wood to build a 1300-year Valais-chronology, edited by: Gärtner, H., Esper, J., and Schleser, G., TRACE, 2, 85–92, 2004. Büntgen, U., Esper, J., Frank, D. C., Nicolussi, K., and
Schmidhal-ter, M.: A 1052-year tree-ring proxy for Alpine summer temper-atures, Clim. Dynam., 25, 141–153, 2005.
Büntgen, U., Frank, D. C., Kaczka, R. J., Verstege, A., Zwijacz-Kozica, T., and Esper, J.: Growth/climate response of a multi-species tree-ring network in the Western Carpathian Tatra Moun-tains, Poland and Slovakia, Tree Physiol., 27, 689–702, 2007. Büntgen, U., Frank, D., Grudd, H., and Esper, J.: Long-term
sum-mer temperature variations in the Pyrenees, Clim. Dynam., 31, 615–631, 2008.
Camuffo, D., Bertolin, C., Barriendos, M., Dominguez-Castro, F., Cocheo, C., Enzi, S., Sghedoni, M., della Valle, A., Garnier, E., Alcoforado, M. J., Xoplaki, E., Luterbacher, J., Diodato, N., Maugeri, M., Nunes, M. F., and Rodriguez, R.: 500-Year temper-ature reconstruction in the Mediterranean Basin by means of doc-umentary data and instrumental observations, Climatic Change, 101, 169–199, 2010.
Cook, E. R., Briffa, K., Shiyatov, S., and Mazepa, V.: Tree-ring standardization and growth trend estimation, in: Methods of dendrochronology: applications in the environmental sciences, edited by: Cook, E. R. and Kairiukstis, L. A., Kluwer Academic Publishers, Dordrecht, 104–162, 1990.
Cook, E. R., Briffa, K. R., and Jones, P. D.: Spatial regression meth-ods in dendroclimatology: a review and comparison of two tech-niques, Int. J. Climatol., 14, 379–402, 1994.
Creus, J. and Puigdefabregas, J.: Climatología histórica y dendro-cronología dePinus uncinataR, Cuad. Investig. Geográfica, 2, 17–30, 1982.
Creus, J., Génova, M., Fernandez-Cancio, A., and Perez-Antelo, A.: New dendrochronologies for Spanish Mediterranean Zone, Lundqua Report, 34, 76–78, 1992.
Crowley, T. J.: Causes of climate change over the past 1000 years, Science, 289, 270–277, 2000.
ˇ
D’Arrigo, R., Wilson, R., and Tudhope, A.: The impact of volcanic forcing on tropical temperatures during the past four centuries, Nat. Geosci., 2, 51–56, 2009.
D’Arrigo, R., Wilson, R., and Anchukaitis, K. J.: Volcanic cooling signal in tree ring temperature records for the past millennium, J. Geophys. Res.-Atmos., 118, 1–11, doi:10.1002/jgrd.50692, 2013.
de Luis, M., Novak, K., ˇCufar, K., and Raventós, J.: Size medi-ated climate-growth relationships inPinus halepensisandPinus pinea, Trees-Struct. Funct., 23, 1065–1073, 2009.
Domínguez-Castro, F., García-Herrera, R., Ribera, P., and Barrien-dos, M.: A shift in the spatial pattern of Iberian droughts during the 17th century, Clim. Past, 6, 553–563, doi:10.5194/cp-6-553-2010, 2010.
Dorado Liñán, I., Büntgen, U., González-Rouco, F., Zorita, E., Montávez, J. P., Gómez-Navarro, J. J., Brunet, M., Heinrich, I., Helle, G., and Gutiérrez, E.: Estimating 750 years of tempera-ture variations and uncertainties in the Pyrenees by tree-ring re-constructions and climate simulations, Clim. Past, 8, 919–933, doi:10.5194/cp-8-919-2012, 2012.
Dorado Liñán, I., Zorita, E., González-Rouco, J. F., Heinrich, I., Campello, F., Muntán, E., Andreu-Hayles, L., and Gutiérrez, E.: Eight-hundred years of summer temperature variations in the southeast of the Iberian Peninsula reconstructed from tree rings, Clim. Dynam., 44, 75–93, 2014.
Durbin, J. and Watson, G. S.: Testing for Serial Correlation in Least Squares Regression, II. 16, Biometrika, 38, 159–179, 1951. El Kenawy, A., López-Moreno, J. I., and Vicente-Serrano, S. M.:
Trend and variability of surface air temperature in northeastern Spain (1920–2006): Linkage to atmospheric circulation, Atmos. Res., 106, 159–180, 2012.
Esper, J., Cook, E. R., Krusic, P. J., Peters, K., and Schweingruber, F. H.: Tests of the RCS method for preserving low-frequency variability in long tree-ring chronologies, Tree-Ring Res., 59, 81–98, 2003.
Esper, J., Büntgen, U., Luterbacher, J., and Krusic, P.: Testing the hypothesis of post-volcanic missing rings in temperature sensi-tive dendrochronological data, Dendrochronologia, 13, 216–222, 2013a.
Esper, J., Schneider, L., Krusic, P. J., Luterbacher, J., Büntgen, U., Timonen, M., Sirocko, F., and Zorita, E.: European summer tem-perature response to annually dated volcanic eruptions over the past nine centuries, B. Volcanol., 75, 736, doi:10.1007/s00445-013-0736-z, 2013b.
Esper, J., Großjean, J., Camarero, J. J., García-Cervigón, A. I., Olano, J. M., González-Rouco, J. F., Domínguez-Castro, F., and Büntgen, U.: Atlantic and Mediterranean synoptic drivers of cen-tral Spanish juniper growth, Theor. Appl. Climatol., 121, 571, doi:10.1007/s00704-014-1254-4, 2014.
Esper, J., Konter, O., Krusic, P., Saurer, M., Holzkämper, S., and Büntgen, U.: Long-term summer temperature variations in the Pyrenees from detrended stable carbon isotopes, Geochronome-tria, 42, 53–59, 2015a.
Esper, J., Schneider, L., Smerdon, J. E., Schöne, B. R., and Bünt-gen, U.: Signals and memory in tree-ring width and density data, Dendrochronologia, 35, 62–72, 2015b.
Fischer, E. M., Luterbacher, J., Zorita, E., Tett, S. F. B., Casty, C., and Wanner, H.: European climate response to tropical volcanic
eruptions over the last half millennium, Geophys. Res. Lett., 34, L05707, doi:10.1029/2006GL027992, 2007.
Frank, D., Esper, J., and Cook, E. R.: On variance adjustments in tree-ring chronology development, in: Tree rings in archaeol-ogy, climatology and ecolarchaeol-ogy, edited by: Heinrich, I., Gärtner, H., Monbaron, M., and Schleser, G., TRACE, 4, 56–66, 2006. Frank, D., Büntgen, U., Böhm, R., Maugeri, M., and Esper, J.:
Warmer early instrumental measurements versus colder recon-structed temperatures: shooting at a moving target, Quaternary Sci. Rev., 26, 3298–3310, 2007.
Fritts, H. C.: Tree rings and climate, Academic Press, London, 1976.
Fritts, H. C., Guiot, J., Gordon, G. A., and Schweingruber, F. H.: Methods of calibration, verification, and reconstruction. Methods of Dendrochronology: Applications in the Environmental Sci-ences, edited by: Cook, E. R. and Kairiukstis, L. A., Dordrecht, Springer Netherlands, 163–217, 1990.
Giorgi, F. and Lionello, P.: Climate change projections for the Mediterranean region, Global Planet. Change, 63, 90–104, 2008. González-Hidalgo, J. C., Brunetti, M., and de Luis, M.: A new tool for monthly precipitation analysis in Spain: MOPREDAS database (monthly precipitation trends December 1945 Novem-ber 2005), Int. J. Climatol., 31, 715–731, 2011.
Gonzalez-Hidalgo, J. C., Peña-Angulo, D., Brunetti, M., and Cortesi, N.: MOTEDAS: a new monthly temperature database for mainland Spain and the trend in temperature (1951–2010)m Int. J. Climatol., 35, 4444–4463, doi:10.1002/joc.4298, 2015. Grove, J. M.: The Little Ice Age, London, Methuen & Co., Ltd.,
498 pp., 1998.
Grudd, H.: Torneträsk tree-ring width and density ad 500–2004: A test of climatic sensitivity and a new 1500-year reconstruction of north Fennoscandian summers, Clim. Dynam., 31, 843–857, 2008.
Guijarro, J. A.: Tendencias de la temperatura en España, in: Fenó-menos meteorológicos adversos en España, edited by: García Legaz, C. and Valero, C., AEMET y CCS, Madrid, 2013. Haigh, J. D. and Cargill, P.: The Sun’s Influence on Climate, 1–207,
Princeton University Press, Princeton, New Jersey, USA, 2015. Harris, I., Jones, P. D., Osborn, T. J., and Lister, D. H.: Updated
high-resolution grids of monthly climatic observations – the CRU TS3.10 Dataset, Int. J. Climatol., 34, 623–642, 2014. Hertig, E. and Jacobeit, J.: Assessments of Mediterranean
precipi-tation changes for the 21st century using statistical downscaling techniques, Int. J. Climatol., 28, 1025–1045, 2008.
Holmes, R. L.: Computer-assisted quality control in tree-ring dating and measurement, Tree-Ring Bull., 43, 69–78, 1983.
Hughes, M. K., Schweingruber, F. H., Cartwright, D., and Kelly, P. M.: July–August temperature at Edinburgh between 1721 and 1975 from tree-ring density and width data, Nature, 308, 341– 344, 1984.
IPCC: Climate Change 2013: The Physical Science Basis. Contri-bution of Working Group I to the Fifth Assessment Report of the Intergovernmental Panel on Climate Change, edited by: Stocker, T. F., Qin, D., Plattner, G. K., Tignor, M., Allen, S. K., Boschung, J., Nauels, A., Xia, Y., Bex, V., and Midgley, P. M., Cambridge University Press, Cambridge, United Kingdom and New York, NY, USA, 1535 pp., doi:10.1017/CBO9781107415324, 2013. Larsson, L. A.: CoRecorder&CDendro program, Cybis Elektronik
Lassen, K. and Friis-Christensen, E.: Variability of the solar cycle length during the past five centuries and the apparent association with terrestrial climate, J. Atmos. Sol.-Terr. Phy., 57, 835–845, 1995.
Lean, J., Beer, J., and Bradley, R.: Reconstruction of solar irradiance since 1610: implications for climate change, Geophys. Res. Lett., 22, 3195–3198, 1995.
Lionello, P., Malanotte-Rizzoli, P., Boscolo, R., Alpert, P., Artale, V., Li, L., Luterbacher, J., May, W., Trigo, R., Tsimplis, M., Ulbrich, U., and Xoplaki, E.: The Mediterranean climate: An overview of the main characteristics and issues, Developments in Earth and Environmental Sciences, 4, 1–26, 2006a.
López-Moreno, J. I., El-Kenawy, A., Revuelto, J., Azorín-Molina, C., Morán-Tejeda, E., Lorenzo-Lacruz, J., Zabalza, J., and Vicente-Serrano, S. M.: Observed trends and future projections for winter warm events in the Ebro basin, northeast Iberian Peninsula, Int. J. Climatol., 34, 49–60, 2014.
Luterbacher, J., Rickli, R., Xoplaki, E., Tinguely, C., Beck, C., Pfis-ter, C., and Wanner, H.: The Late Maunder Minimum (1675– 1715) – A key period for studying decadal scale climatic change in Europe, Climatic Change, 49, 441–462, 2001.
Matalas, N. C.: Statistical properties of tree ring data, Hydrolog. Sci. J., 7, 39–47, 1962.
Matskovsky, V. V. and Helama, S.: Testing long-term summer tem-perature reconstruction based on maximum density chronologies obtained by reanalysis of tree-ring data sets from northernmost Sweden and Finland, Clim. Past, 10, 1473–1487, doi:10.5194/cp-10-1473-2014, 2014.
Mencuccini, M., Martínez-Vilalta, J., Vanderklein, D., Hamid, H. A., Korakaki, E., Lee, S., and Michiels, B.: Size-mediated ageing reduces vigour in trees, Ecol. Lett., 8, 1183–1190, 2005. Mitchell, V. L.: An investigation of certain aspects of tree growth
rates in relation to climate in the central Canadian boreal forest. Technical report, 33 pp., Department of Meteorology, University of Wisconsin, 1967.
Pallardy, S. G.: Physiology of Woody Plants, Academic Press, Am-sterdam, the Netherlands, 2010.
Panofsky, H. A. and Brier, G. W.: Some applications of statistics to meteorology, University Park, Pennsylvania, 224 pp., 1958. Pena-Angulo, D., Cortesi, N., Brunetti, M., and González-Hidalgo,
J. C.: Spatial variability of maximum and minimum monthly temperature in Spain during 1981–2010 evaluated by correlation decay distance (CDD), Theor. Appl. Climatol., 122, 35–45, 2015. Pensa, M. and Jalkanen, R.: Variation in needle longevity is related to needle-fascicle production rate in Pinus sylvestris, Tree Phys-iol., 25, 1265–1271, 2005.
Peñuelas, J.: Plant physiology – a big issue for trees, Nature, 437, 965–966, 2005.
Rinn, F.: TSAPWinTM – Time series analysis and presentation for dendrochronology and related applications, Version 4.69, 2005. Ruiz, P.: Análisis dendroclimático dePinus uncinata Ramonden la
Sierra Cebollera (Sistema Ibérico), Cuad. Investig. Geográfica, 15, 75–80, 1989.
Sánchez, E., Gallardo, C., Gaertner, M. A., Arribas, A., and Cas-tro, M.: Future climate extreme events in the Mediterranean sim-ulated by a regional climate model: A first approach, Global Planet. Change, 44, 163–180, 2004.
Saz, M. A.: Análisis de la evolución del clima en la mitad septentri-onal de España desde el siglo XV a partir de series dendroclimáti-cas, Servicio de Publicaciones de la Universidad de Zaragoza, Zaragoza, 1105 pp., 2003.
Schulman, E.: Dendroclimatic Changes in Semiarid America, Tuc-son, University of Arizona Press, 142 pp., 1956.
Stokes, M. A. and Smiley, T. L.: An introduction to tree-ring dating, 2nd Edn., The University of Arizona Press, Tucson, 1968. Tejedor, E., de Luis, M., Cuadrat, J. M., Esper, J., and Saz, M.
A.: Tree-ring-based drought reconstruction in the Iberian Range (east of Spain) since 1694, Int. J. Biometeorol., 60, 361–372, 2016.
Tejedor, E., de Luis, M., Saz, M. A., and
Cuadrat, J. M.: RW_EW_LW_NESPAIN, figshare,
doi:10.6084/m9.figshare.4622059.v2, 2017.
Van der Werf, G. W., Sass-Klaassen, U., and Mohren, G. M. J.: The impact of the 2003 summer drought on the intra-annual growth pattern of beech (Fagus sylvaticaL.) and oak (Quercus roburL.) on a dry site in the Netherlands, Dendrochronologia, 25, 103– 112, 2007.
Vicente-Serrano, S. M. and Cuadrat, J. M.: North Atlantic oscil-lation control of droughts in north-east Spain: Evaluation since 1600 A.D, Climatic Change, 85, 357–379, 2007.
Wahl, E. R. and Ammann, C. M.: Robustness of the Mann, Bradley, Hughes reconstruction of Northern Hemisphere surface temper-atures: examination of criticisms based on the nature and pro-cessing of proxy climate evidence, Climatic Change, 85, 33–69, 2007.
Wang, F., Letort, V., Lu, Q., Bai, X., Guo, Y., de Reffye, P., and Li, B.: A Functional and Structural Mongolian Scots Pine (Pi-nus sylvestris var. mongolica) Model Integrating Architecture, Biomass and Effects of Precipitation, PLoS ONE, 7, e43531, doi:10.1371/journal.pone.0043531, 2012.