www.nonlin-processes-geophys.net/19/265/2012/ doi:10.5194/npg-19-265-2012
© Author(s) 2012. CC Attribution 3.0 License.
Nonlinear Processes
in Geophysics
Mass and momentum transfer by solitary internal waves in
a shelf zone
N. Gavrilov1,2, V. Liapidevskii1,2, and K. Gavrilova1,2
1Lavrentyev Institute of Hydrodynamics, Novosibirsk, 630090, Russia 2Novosibirsk State University, Novosibirsk, 630090, Russia
Correspondence to: V. Liapidevskii (liapid@hydro.nsc.ru)
Received: 11 November 2011 – Revised: 20 January 2012 – Accepted: 6 March 2012 – Published: 3 April 2012
Abstract. The evolution of large amplitude internal waves propagating towards the shore and more specifically the run up phase over the “swash” zone is considered. The math-ematical model describing the generation, interaction, and decaying of solitary internal waves of the second mode in the interlayer is proposed. The exact solution specifying the shape of solitary waves symmetric with respect to the unper-turbed interface is constructed. It is shown that, taking into account the friction on interfaces in the mathematical model, it is possible to describe adequately the change in the phase and amplitude characteristics of two solitary waves moving towards each other before and after their interaction. It is demonstrated that propagation of large amplitude solitary in-ternal waves of depression over a shelf could be simulated in laboratory experiments by internal symmetric solitary waves of the second mode.
1 Introduction
In coastal zones, shoreward propagation of surface and in-ternal waves generally leads to breaking. The turbulence, generated by breaking and mixing processes at the wave fronts, induces the very effective mechanism of energy dis-sipation and momentum exchange, leading to intensive sedi-ments suspension and transport in the shelf zone. Nonlinear internal waves generated by tides as well as by interaction of flows with topography play the important role in the en-ergy transfer from the large-scale motion to small-scale mix-ing. The large amplitude internal waves can contain well mixed cores, by which trapped fluid is carried horizontally for a long distance (Maxworthy, 1980; Tung et al., 1982; Stamp and Jacka, 1995; Nash and Moum, 2005; Lamb, 2003; Derzho and Grimshaw, 2007). Propagating to shore, the
subsurface internal waves of depression can transform into the large amplitude internal waves of elevation (Helfrich and Melville, 2006; Scotti and Pineda, 2004; Wallace and Wilkin-son, 1988; Klymak and Moum, 2003). The transition from wave-like motion to the separate moving soliton-like waves (“solibores”) containing trapped core is the common feature of the run up process of internal waves. It can be observed in any shelf zone with high internal wave activity as well as in laboratory experiments. This study is based on the laboratory run up experiments for internal waves. It is shown that an in-ternal solitary wave of elevation was destroyed very quickly during its run up in a “swash” zone along the “dry” bottom, but the presence of a thin dense layer before the wave front prevented the entrainment and mixing processes very effec-tively. The simple mathematical model describing the non-stationary interaction and decaying of internal solitary waves is suggested.
2 Laboratory experiments
266 N. Gavrilov et al.: Mass and momentum transfer by solitary internal waves in a shelf zone
Fig. 1. A sketch of the lock problem in two layer fluid (side view). Internal waves are generated by the removal of slice gates R : (a) run up of the bottom internal waves;h1is the thickness of a thin layer
of dense fluid flowing along the slope; (b) short intrusion along the subsurface layer of light fluid of variable thickness; (c) solitary waves of the second mode at the interface between symmetric ho-mogeneous layers of different density.
video-records obtained by a digital camera at the acquisition rate of 25 frames per second. The flow visualization is por-trayed in Fig. 2, where we show photographs of the gener-ated solitary waves against the background of the luminous screen with a grid of inclined lines imposed on it. The op-tical inhomogeneities related to the perturbation propagation are distinctly seen. In high density gradient regions, we ob-served the characteristic distortion of lines, whereas the opti-cal transparency of the fluid changes in the mixing areas (Er-manyuk and Gavrilov, 2007). In addition, dense fluid, which propagates along the bottom in the form of a solitary wave, is slightly tinted with an ink solution for visualizing the mass transfer processes. The external wave boundaries are deter-mined by the break and change in thickness of the inclined lines.
In the first series of experiments (Fig. 1a), the lock prob-lem for a two-layer fluid of densities ρ± over an inclined bottom was considered (tanα=0.012, αis the angle of bot-tom inclination). Two cases are investigated. In the first, the
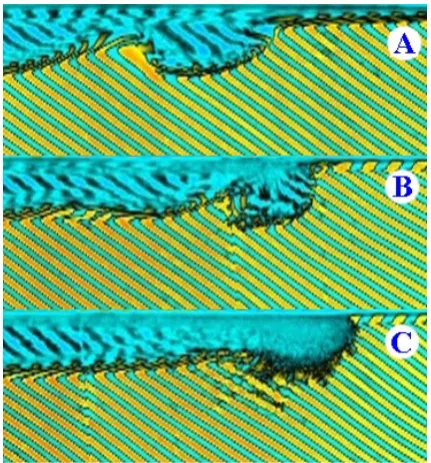
two-layer system was initially at rest. The position “B” in Figs. 1a and 2a corresponds to the intersection of the pycn-ocline with the bottom. The position “C” was chosen near the end of the flume where there was no dense fluid at the start of experiment (“dry” bottom). In the second case, the experiment was performed as in the previous case. The only difference was a thin layer of fluid with densityρ−, the ve-locityu1and the thicknessh1, flowing over the slope up to the position “B”. The thicknessh1was small enough to pro-vide equilibrium between gravity and friction forces between the positions “B” and “C”, so the velocityu1and the thick-nessh1of the flowing layer were supposed to be constants. After the removal of slice gate, the bore-like structure was gradually transforming into the solitary waves of elevation, which were running up the slope. The photos of the leading solitary wave taken at the corresponding position of the tank are shown in Fig. 2. Between positions “B” and “C” the wave shown in Fig. 2a was running up over the “dry” bottom, since h1=0.
Fig. 2. Run up of the leading solitary wave of elevation along the slope. Capital letters are the positions of the wave in experimental installation (Fig. 1a): (a)h1=0 ; (b)h1=3·10−3m,u1=3×10⁻³m s−1.
front transforms into a head of gravity flow (Ermanyuk and Gavrilov, 2007). This head is completely destroyed at the po-sition “C” by the surface friction effects. Comparing Figs. 2a and 3, we can see that in laboratory scale of flow surface ten-sion and bottom friction affect the gravity current front in a similar way. Therefore, we must take special efforts to sim-ulate large-scale subsurface internal waves in the laboratory conditions. To avoid the bottom and surface effects on large amplitude waves of depression, the third series of laboratory experiments were conducted for short intrusions at the inter-face of two mixable fluids of different densities (Fig. 1c).
The tank geometry was symmetric relative to the plane y=H with the ordinatey chosen in the vertical direction. So the bottom and the lid of the tank had the same angles of inclinationαto the horizon. The length of the compart-ment with the mixed fluid of densityρ¯=(ρ++ρ−)/2 was chosen so that only one solitary wave at the interface was produced. It was also symmetric relative to the undisturbed interface. Due to the flow symmetry, the corresponding com-ponent of the Reynolds stress aty=H vanished. The ve-locities generated in the homogeneous layers by the intru-sion were small enough and the friction at the bottom could be neglected too. But the friction between the surround-ing fluid and the intrusion should be included in the math-ematical model to describe properly the decay rate of soli-tary waves propagating along the interface. Note that the first two series of experiments (Fig. 1a and b) are performed to demonstrate the sensitivity of the gravity flow structure to the bottom and surface friction effects. Therefore, they give only qualitative description of the problem and show
Fig. 3. Transformation of the front of subsurface intrusion: A, B, C are positions of the front corresponding to Fig. 1b.
268 N. Gavrilov et al.: Mass and momentum transfer by solitary internal waves in a shelf zone
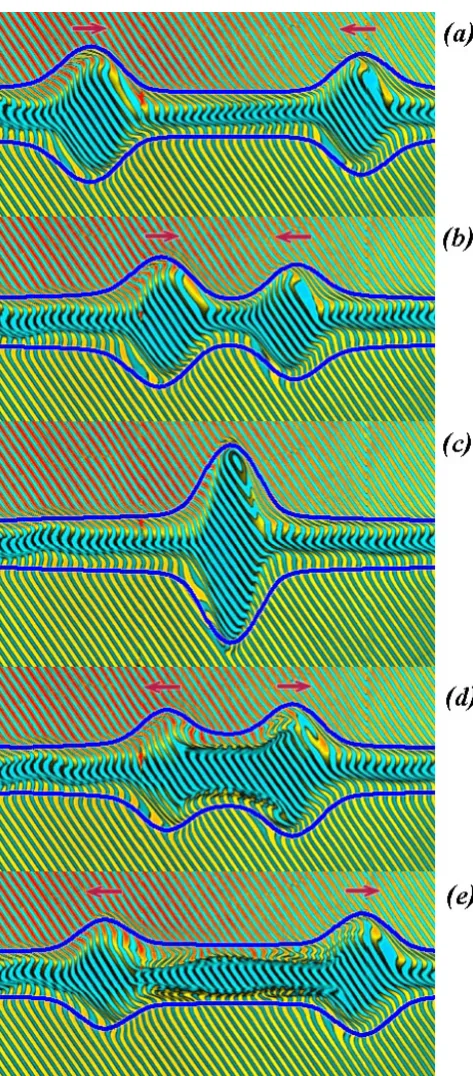
Fig. 4. Interaction of symmetric solitary waves moving toward each other. The time interval between the frames (a–e) is 5 s. The wave parameters are given in the text. The thick (blue) curves show the calculated wave profiles.
experiments (Fig. 1c), we will describe in next sections all flow parameters of symmetric internal waves generated ex-perimentally, which are necessary for numerical calculations of the wave evolution and interaction by the mathematical model developed in the following section.
3 Mathematical model
There are different approaches to simulating of large ampli-tude internal waves over a slope. 2-D nonlinear numerical models, taking into account continuous vertical stratification with and without turbulent exchange, have been developed to describe the shoaling solitary internal waves in Vlasenko and Hutter (2002); Lamb (2003). The application of multi-layer shallow water equations with dispersion makes the problem more simple.
Mathematical models using two-layer scheme of flow have been analyzed in Gavrilov et al. (2011). One of them was the full nonlinear model, taking into account the nonhydrostatic effects in both layers (model 1, Choi and Camassa, 1999). The further simplification of the model has been achieved by using the hydrostatic pressure distribution in one of the lay-ers (models 2 and 3 in Gavrilov et al., 2011). It was shown by comparing exact solutions for models 1–3 that the gener-ation and propaggener-ation of large amplitude solitary waves in a two-layer fluid in the channel of finite depth is governed by nonhydrostatic effects in an outer layer. It means that for in-ternal waves of depression the upper layer is supposed to be hydrostatic (model 2) and for waves of elevation the bottom layer can be considered as hydrostatic (model 3).
In Boussinesq approximation (0< (ρ−−ρ+)/ρ+1 ), the second-mode internal waves are symmetric with respect to the channel midliney=H for the symmetric initial strat-ification (Fig. 1c). Therefore, it is sufficient to consider only the flow in the bottom half of channel(0< y < H )for de-scribing the symmetric-wave propagation in the interlayer. Let the wave profile (the depth of perturbed homogeneous layer) be represented byy=h(t,x),u=u(t,x)be the mean velocity of the bottom homogeneous layer, w=w(t,x)be the mean velocity of the fluid intrusion, η=η(t,x)be the half-thickness of the intermediate layer andg be the grav-ity acceleration. The valuesh,ηandz=z(x)are related as follows
h+η+z=H=const,
ht+(hu)x=0, ηt+(ηw)x=0,
ut+uux+hx+zx+px+3βh(h2d 2h dt2)x=f
−,
wt+wwx+px=f+,
f−= −c(u−w)h|u−w|, f+=c(u−w)η|u−w|, d
dt = ∂ ∂t+u
∂ ∂x,
(1)
wherep is the dimensionless pressure aty=H. Note that the total flow rateQ=hu+ηw=0, so we can exclude the variablesp,η=1−h−zandw= −hu/(1−h−z)from (1). After that, Eq. (1) is reduced to the system of two equations for the variableshandu, which is the analog of the Green– Naghdi equations (Green and Naghdi, 1976), describing non-linear waves in two-layer fluids. The dimensionless valueβ is just a scaling coefficient between vertical and horizontal axes and it can be excluded from the system by the dilata-tion of independent variables. The only empiric constant in Eq. (1) is the friction coefficientc. It is shown in Gavrilov et al. (2011) that the numerical values ofc=0.01 andβ=0.5 give satisfactory results for numerical calculation of solitary waves dynamics. So we have used these values for calcula-tions below.
The advantage of Eq. (1) is that the simple exact solutions describing the solitary waves can be constructed in explicit form. Let the dissipative processes be ignored, and the bot-tom be horizontal, i.e.c=0 andzx≡0. Consider traveling waves running in the two-layer fluid at rest, i.e. the solu-tions of Eq. (1), which depend on the variableξ=x−Dt, (D≡const). Suppose that the following conditions are satis-fied for|ξ| → ∞
h→h0, h0→0, h00→0 (2)
(here and below, the prime denotes differentiation with re-spect to the variableξ). For givenh0(0< h0<1), the travel-ing wave satisfytravel-ing Eq. (2) represents a soliton and depends on the Froude numberF r=D/
√ ¯
bH. Note that in the di-mensionless variablesF r=D, whereD is the dimension-less velocity of the traveling wave. It is shown in Gavrilov et al. (2011) that the profile of a solitary waveh=h(ξ )can be found by quadrature
ξ=ξ(h)= ±
Z h
h0 ds √
G(s), (3)
where
(h0)2=G(h)=3(h−h0)
2(F r2−h+h2) βF r2h2
0(1−h)
. (4)
It follows from Eq. (4) that the admissible interval forhis hm≤h < h0<1 andF r≤1/2. Here
hm= 1+
√
1−4F r2 2
is the minimal depth of the bottom layer in the wave and A=1−hmis the (dimensionless) amplitude of the solitary wave. Note also that the limiting caseh0→1, when the soli-tary wave propagating along the zero-thickness interface be-tween the homogeneous layers of different densities, can be easily found from Eqs. (3)–(4) (see Gavrilov et al., 2011). The constructed above solution is used below as initial data in nonstationary calculation of solitary wave shoaling and in-teraction. The velocity distribution in a solitary wave can be found from relations:
h(D−u)=h0D, (1−h)(D−w)=(1−h0)D. (5) In a real system with dissipation, which can be a strati-fied fluid, solitary waves propagating with a constant veloc-ity cannot be realized. During the propagation, the solitary wave loses mass and its velocity decreases. Nevertheless, the motion of an internal wave is quasi-steady: at each moment of time, its shape coincides with that of the stationary wave of the same amplitude. The discrepancies are observed only at the small portion adjoining to the area of flow behind the wave.
The problem regarding the interaction of the solitary waves moving toward each other can be solved numerically as the Cauchy problem for Eq. (1), with the initial data in the form of solitary waves Eqs. (3)–(5) propagating with the velocitiesD1>0 andD2<0 and starting to move at a suf-ficient distanceL0so that the initial stratified fluid between them is unperturbed. The numerical algorithm for Eq. (1) is discussed in Gavrilov et al. (2011). It is based on numeri-cal scheme developed for the Green-Naghdi equations in Le Metayer et al. (2010). In Fig. 4 we show the main stages of interaction between the solitary waves realized experimen-tally.
Reference scales used in experiments on solitary wave interaction are H=6×10⁻²m, (ρ−−ρ+)g/2ρ+=2.5×
10−2m/s−2,ρ+=103kg m−3. A solitary wave propagating on the left (D2<0) was produced analogously to the solitary wave moving on the right (Fig. 1c, α=0). The consecu-tive positions of solitary waves realized experimentally are shown in Fig. 4a–e through the regular time interval (5 s).
As initial data for numerical calculations in Eq. (1), we have chosen the following dimensional values: solitary wave amplitudes A1=2.3×10⁻²m, A2=2×10⁻²m, the dis-tance between their crests L0=0.3 m, the half-thickness of the intermediate layer η0=H−h0=9×10⁻³m. Note thatb¯=(ρ−−ρ+)g/2ρ+ gives the mean buoyancy for the model (1) only for step-wise density distribution in the in-termediate layer. For real initial density distribution ρ= ρ(y), which is symmetric relative to the channel midline y=H, the mean valueb¯varies fromb¯=(ρ−−ρ+)g/4ρ+ for the linear stratification in the intermediate layer up to
¯
270 N. Gavrilov et al.: Mass and momentum transfer by solitary internal waves in a shelf zone
Fig. 5. The decay of symmetric solitary waves moving toward each other. Bold points represent the experimental positions of wave crests through the regular time interval (1 s). Solid lines show the calculated wave profiles through the fixed time interval (4 s): (a) waves before interaction (t <24 s); (b) waves after interaction (t >24 s).
In our calculations we putb¯=2.2×10⁻²m/s−2. The thick (blue) curves in Fig. 4a–e show the calculated wave profiles. One can see that the numerical solution gives the satisfac-tory description of the outer boundaries of perturbations in stratified fluid realized experimentally.
The dissipative effects on solitary waves propagation and interaction are demonstrated in Fig. 5. The problem under consideration is the same as those discussed above. The bold points indicate the wave-crest locations found exper-imentally through the regular intervals of time (1 s). The reference values are the same as in previous case (Fig. 4). The initial data are:A1=2.13×10⁻²m,A2=2.6×10⁻²m, L0=0.84 m,η0=9×10⁻³m. The wave profiles are shown in Fig. 5a through the time intervals 4 s up to the moment of the waves collision (tc=24 s), and the wave profiles through the same time intervals are shown in Fig. 5b fort > tc.
It is seen from Fig. 5 that the model (1) with the numeri-cal value of the friction coefficientc=0.01 qualitatively and quantitatively reflects the changes in the phase and amplitude characteristics of solitary waves before and after their inter-action. One can also conclude from this figure that the dis-sipative effects result in the consecutive wave transformation in a nonsymmetric form.
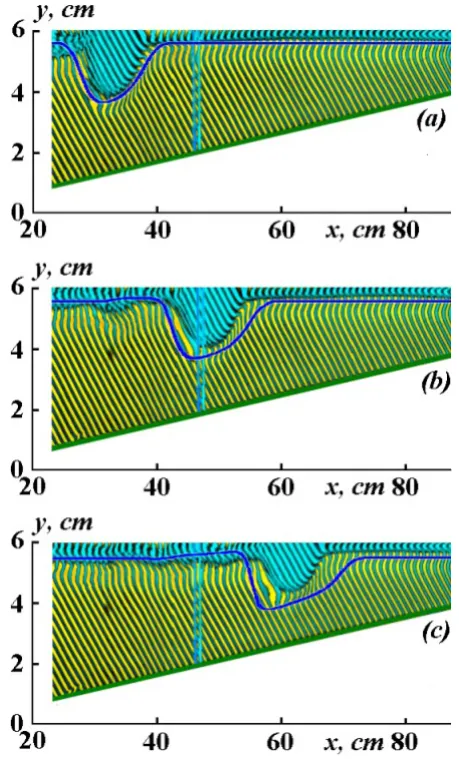
Fig. 6. Shoaling solitary wave (tanα=0.05). Photos of experiment II (background) taken through the time interval 10 s are compared with numerical calculations by (1). The lower part of the experi-mental installation (Fig. 1c, 0≤y≤H) is shown.
4 Propagation of surface solitary waves over a slope
One can see in Fig. 6 that the shoaling internal wave loses its symmetry when the wave amplitude reaches the half-thickness of the flume. The rear part of the soliton sharpens and the back front of the wave takes the form of an internal bore. The model doesn’t take into account the mixing in the intermediate layer, so the agreement between numerical and experimental data at this stage of flow (Fig. 6c) is not so sat-isfactory as at more earlier phases of the wave propagation (Fig. 6a and b).
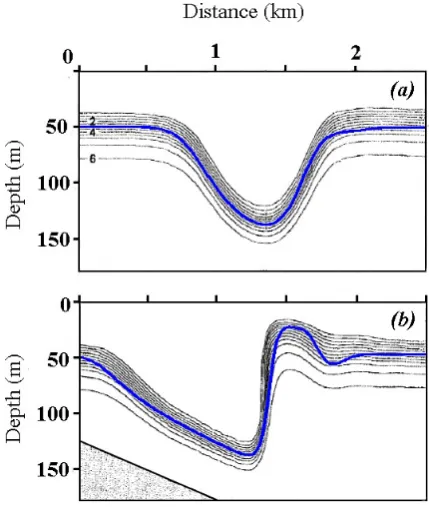
The ability of the model (1) to simulate the shoaling sur-face internal waves up to the moment of an internal bore for-mation and subsequent breaking is demonstrated in Fig. 7, where the solitary internal wave moving to the left over a slope is shown. Figure 7a and b is taken from Vlasenko and Hutter (2002) (Fig. 2a and b). They represent the re-sults of numerical calculation of a shoaling wave in continu-ously stratified fluid at rest over a slope. The thin lines show the deformation of the density level with the density contour interval of 0.5 kg s−3. The 2-D nonlinear numerical model with continuous vertical stratification and turbulent exchange has been developed in Vlasenko and Hutter (2002) to study breaking processes in nonlinear internal waves over a topog-raphy. The model contains a number of parameters and have been applied for different types of stratified flows. To cal-culate the problem under consideration by the model (1), we use the following reference values: b¯=6×10⁻²m/s−2, H=300 m,ρ+=103kg m−3. Initial depth of the upper ho-mogeneous layer was taken asη0=50 m.
The exact solution (3)–(4) with appropriate amplitude was used as initial data for Eq. (1). Thick (blue) curves rep-resent the numerical solutions of Eq. (1), corresponding to the numerical solutions, which were constructed in Vlasenko and Hutter (2002). We can see that the nonstationary nu-merical solution of Eq. (1) reproduces the characteristic fea-tures of the shoaling wave with reasonable accuracy, despite of the two-layer approximation of the flow. Note also that in contrast to the 2-D model of stratified flow developed in Vlasenko and Hutter (2002), the initial data for the model (1) do not generate the tail waves, since we use the exact soliton-like solution of Eq. (1) as the initial data.
5 Conclusions
Laboratory experiments described in the paper show that the bottom friction and the surface tension affect strongly the dy-namic of large amplitude internal waves. To simulate the propagation of large-scale internal waves in oceans, where the surface tension has no effect, the special geometry of flow has been used (Fig. 1c). It is demonstrated that the prob-lems on shoaling and interactions of solitary internal waves of depression could be represented in laboratory experiments by internal symmetric solitary waves of the second mode (Figs. 4–6).
Fig. 7. Shoaling internal wave over a slope (tanα=0.05). The wave moves to the left. Comparison of numerical results from Vlasenko and Hutter (2002) (thin lines, Fig. 2a and b) with the numerical so-lution of (1) (bold line). Corresponding wave parameters are given in the text.
The aim of the paper is to develop the simplest mathe-matical model, which would be capable to reproduce the main features of nonlinear internal waves. It is shown that Eq. (1), which are the two-layer shallow water equations, tak-ing into account the dispersion effects in the bottom layer, can describe large amplitude internal wave evolution in a coastal zone. The equations are the direct extension of the Green-Naghdi equations developed for open channel flows of two-layer stratified fluids. Therefore, exact soliton-like solutions and numerous numerical methods constructed for Green-Naghdi equations could be applied to near shore dy-namics of internal waves. Note also, that the solutions of Eq. (1), describing the internal shoaling waves, are compat-ible with numerical solutions of more complicated models (Fig. 7).
272 N. Gavrilov et al.: Mass and momentum transfer by solitary internal waves in a shelf zone
Acknowledgements. The authors are grateful to the referees for
their constructive comments. This work was supported by the Russian Foundation for Basic Research (Grants No. 10-01-00338, 12-01-00671), Integration project of the Siberian Division of the Russian Academy of Sciences No. 15.
Edited by: E. Pelinovsky
Reviewed by: two anonymous referees
References
Choi, W. and Camassa, R.: Fully nonlinear internal waves in a two-fluid system, J. Fluid Mech., 386, 1–36, 1999.
Derzho, O. G. and Grimshaw, R.: Assymetric internal solitary waves with a trapped core in deep fluids, Phys. Fluids, 19, 096601, doi:10.1063/1.2768507, 2007.
Ermanyuk, E. V. and Gavrilov, N. V.: A note on the propagation speed of a weakly dissipative gravity current, J. Fluid Mech., 574, 393–403, 2007.
Gavrilov, N. V. and Liapidevskii, V. Yu.: Finite-amplitude solitary waves in a two layer fluid, J. Appl. Mech. Tech. Phys., 51, 471– 481, 2010.
Gavrilov, N. V., Liapidevskii, V., and Gavrilova, K.: Large ampli-tude internal solitary waves over a shelf, Nat. Hazards Earth Syst. Sci., 11, 17–25, doi:10.5194/nhess-11-17-2011, 2011.
Green, A. E. and Naghdi, P. M.: A derivation of equations for wave propagation in water of variable depth, J. Fluid Mech., 78, 237– 246, 1976.
Helfrich, K. R. and Melville, W. K.: Long nonlinear internal waves, Annu. Rev. Fluid Mech., 38, 395–425, 2006.
Klymak, J. M. and Moum, J. N.: Internal solitary waves of elevation advancing on a shoaling shelf, Geophys. Res. Lett., 30, 2045, doi:10.1029/2003GL017706, 2003.
Lamb, K. G.: Shoaling solitary internal waves:on a criterion for the formation of waves with trapped cores, J. Fluid Mech., 478, 81– 100, 2003.
Le Metayer, O., Gavrilyuk, S., and Hank, S.: A numerical scheme for the Green-Naghdi model, J. Comput. Phys., 229, 2034–2045, 2010.
Liapidevskii, V. Yu. and Teshukov, V. M.: Mathematical Models of Long-Wave Propagation in an Inhomogeneous Fluid, Izd. Sib. Otd. Ross. Akad. Nauk, Novosibirsk, 2000 (in Russian). Maxworthy, T.: On the formation of nonlinear internal waves from
the gravity collapse of mixing regions in two and three dimen-sions, J. Fluid Mech., 96, 47–64, 1980.
Nash, J. D. and Moum, J. N.: River plumes as a source of large-amplitude internal waves in the coastal ocean, Nature, 437, 400– 403, doi:10.1038/nature03936, 2005.
Scotti, A. and Pineda, J.: Observation of very large and steep inter-nal waves of elevation near the Massachusetts coast, Geophys. Res. Lett., 31, L22307, 1–5, doi:10.1029/2004GL021052, 2004. Stamp, A. P. and Jacka, M.: Deep-water internal solitary waves, J.
Fluid Mech., 305, 347–371, 1995.
Tung, K.-K., Chan, T. F., and Kubota, T.: Large amplitude internal waves of permanent form, Stud. Appl. Math., 66, 1–44, 1982. Vlasenko, V. and Hutter, K.: Numerical experiments on the
break-ing of solitary internal waves over a slope-shelf topography, J. Phys. Oceanography, 32, 1779–1793, 2002.