www.solid-earth.net/6/985/2015/ doi:10.5194/se-6-985-2015
© Author(s) 2015. CC Attribution 3.0 License.
Karst bare slope soil erosion and soil quality: a simulation case study
Q. Dai1, Z. Liu2, H. Shao3,4, and Z. Yang1
1Forestry College of Guizhou University, Guiyang 550025, China
2Anshun Xixiu District Water Conservancy Bureau, Anshun 561000, China
3Key Laboratory of Coastal Biology & Bioresources Utilization, Yantai Institute of Coastal Zone Research (YIC),
Chinese Academy of Sciences (CAS), Yantai 264003, China
4Institute of Agro-Biotechnology, Jiangsu Academy of Agricultural Sciences, Nanjing 210014, China
Correspondence to: Q. Dai ([email protected]) and H. Shao ([email protected])
Received: 10 April 2015 – Published in Solid Earth Discuss.: 5 June 2015 Revised: 5 July 2015 – Accepted: 12 July 2015 – Published: 31 July 2015
Abstract. The influence on soil erosion by different bedrock bareness ratios, different rainfall intensities, different un-derground pore fissure degrees and rainfall duration are re-searched through manual simulation of microrelief character-istics of karst bare slopes and underground karst crack con-struction in combination with artificial simulation of rainfall experiment. The results show that firstly, when the rainfall intensity is small (30 and 50 mm h−1), no bottom load loss is produced on the surface, and surface runoff, underground runoff and sediment production are increased with the in-creasing of rainfall intensity. Secondly, surface runoff and sediment production reduced with increased underground pore fissure degree, while underground runoff and sedi-ment production increased. Thirdly, raindrops hit the sur-face, forming a crust with rainfall duration. The formation of crusts increases surface runoff erosion and reduces soil in-filtration rate. This formation also increases surface-runoff-erosion-damaged crust and increased soil seepage rate. Rain-drops continued to hit the surface, leading the formation of crust. Soil permeability showed volatility which was from re-duction to increases, rere-duction, and so on. Surface and sub-surface runoff were volatile with rainfall duration. Fourthly, when rock bareness ratio is 50 % and rainfall intensities are 30 and 50 mm h−1, runoff is not produced on the surface, and the slope runoff and sediment production present a fluctuat-ing change with increased rock bareness ratio. Fifthly, the correlation degree between the slope runoff and sediment production and all factors are as follows: rainfall intensity-rainfall duration-underground pore fissure degree–bedrock bareness ratio.
1 Introduction
Karst regions have surface and underground double-layer karst structures. A large amount of bedrocks are bared and the soil cover is not continuous. The heterogeneity of karst structure is great due to developed fissures, ponors and under-ground rivers. A part of water and soil enter the underunder-ground rivers along with the fissures and the ponors, so that water and soil loss in karst regions is classified into surface loss and underground soil leak, which have obvious difference com-pared with that in non-karst regions such as agricultural land reported by Cerdà et al. (2009a, b, 2010) and García-Orenes et al. (2009). In non-karst regions, soil erosion is mainly re-lated to surface cover, slope, and rainfall conditions (Cerdà, 2000; Giménez et al., 2010; Biro et al., 2013; Haregeweyn et al., 2013) and it could be prevented if people take reasonable measures (Haile and Fetene, 2012; Prokop and Por˛eba, 2012; Mandal and Sharda, 2013). However, due to special geologic structure in karst regions, soil erosion is rather more compli-cated than that in non-karst regions.
soil erosion that occurred in this region has caused serious soil and water losses and has become another important en-vironmental problem after Loess Plateau of China (Zhao et al., 2013). For the past few years, a large amount of research on water and soil loss in karst regions has been performed, and certain achievements has been achieved.
Influence factors of karst bare slope runoff yield are mainly divided into three types: rainfall characteristics, drainage basin underlying surface and drainage basin evapo-transpiration characteristics. Surface runoff process indicates a process in which rainfall with a capacity larger than slope soil infiltration capacity forms runoff on the surface; under-ground runoff indicates that rainfall flows into rivers after in-filtrating into the an underground water-bearing layer, so as to form runoff. Atmospheric precipitation infiltration forms underground water or depression detention consumption; the slope can yield runoff only when the rainfall capacity is larger than the underlying surface consumption or the rain-fall intensity is larger than the soil infiltration rate (Liu and Wu, 1997). The slope runoff yielding process can be divided into the following three steps: the first step is that rainfall be-gins infiltration and is completely infiltrated; in the second step, infiltration and runoff are generated at the same time, wherein infiltration and runoff curves have similar linear re-lations; the third step belongs to a runoff step in which infil-tration can be ignored (Sidle et al., 1995; Zhang et al., 2000; Daniel, 1998).
It is incontrovertible that surface and underground loss ex-ists in karst regions, but people always ignore underground water- and soil-loss research and only pay attention to study-ing surface water and soil loss durstudy-ing the research on water and soil loss in karst regions. The research is comprised of monitoring soil surface erosion state in karst regions through runoff plot (Wu et al., 2005; Chen et al., 2007; Peng et al., 2008; Li et al., 2009), research on surface soil erosion charac-teristics in different slope positions in karst regions through 137Cs (Fu et al., 2007; X. Zhang et al., 2007; Timothy et
al., 1999; Bissonnais et al., 2005), research on soil erosion and the weathering process in small drainage basins using the U-system method (Anthony et al., 2008), research on the influence on soil erosion in karst regions by rainfall inten-sity through indoor simulation tests (Cai et al., 2009), spec-ulation on the state of soil erosion in Yunnan Stone Forest regions through stalagmite records (Cai et al., 2003), mon-itoring surface water and soil loss in karst regions through anchored piles, de-silting basins and check dams (Zhang et al., 2003; Peng and Yang, 2001; Long, 2006), and research on surface erosion characteristics in karst regions using the magnetic trace method (Royall, 2001). Dong et al. (2006) calculated and soil-loss vector or analyzing water-and soil-loss sensibility in karst regions by directly applying the existing water- and soil-loss models through GIS. Gao et al. (2010) researched different types of soil erosion charac-teristics in Guizhou by measuring soil antishock coefficients, disintegration coefficients and erodibility and Li et al. (2007)
researched grading standards of water and soil loss in karst regions and presented a series of grading standards suitable for water and soil loss in karst regions according to special lithological characters in karst regions. The above scholars mainly performed research in the aspect of surface water-and soil-loss characteristics, but as karst regions do not only have surface loss, but also have underground soil leakage, the water- and soil-loss characteristics in karst regions can be more accurately reflected only by integrating the analysis and research on surface water and soil loss and underground soil leakage.
un-Table 1. Soil particle composition.
Soil particle diameter ≥0.25 mm ≥0.05 mm ≤0.05 mm ≤0.01 mm ≤0.005 mm ≤0.001 mm Content 0.09 % 9.73 % 90.27 % 74.14 % 63.93 % 48.55 %
derground leakage is mainly researched from a large scale perspective, and few people do research from a micro per-spective, so that combining environmental factors and geo-logical factors and analyzing soil leakage mechanism in karst regions from a micro perspective are very important.
In this paper, the influences of pore fissure degrees, bedrock bareness ratios, rainfall intensities and rainfall du-ration on soil erosion in karst regions were researched by a combination of surface and underground soil erosion un-der artificial simulation rainfall condition. Results obtained in this paper would provide a theoretical basis for subse-quent researching on the relationship between underground and surface water and soil loss in karst regions and, simulta-neously, provide a reference for controlling soil erosion and water loss in karst regions.
2 Materials and methods 2.1 Study area
Soil for testing was collected in a typical karst region (26◦2803200N, 106◦4200200E) in Huaxi district, Guizhou province in China (Fig. 1). The study area has a subtrop-ical humid monsoon climate with a mean annual tempera-ture of 14.9◦C, annual precipitation of 110 mm, annual frost-free period of 260 days or more and effective accumulated temperature of 4500◦C. The land area of bedrock bared ac-counted for 23.8 % of total area. The main component of bared bedrock is carbonate rocks with the lowest size of 25 cm.
Soil texture is acarbonatite and devolved calcareous clay loam and soil particle compositions are shown in Table 1.
2.2 Test equipment
Test equipment mainly comprises of a rainfall simulator and a steel tank (Fig. 2). The rainfall simulator is a portable fully automatic rain maker with four stainless steel downward sprayers produced by Xi’an Qingyuan Measurement and Control Technology Co., Ltd (Model: QYJY-501). This sim-ulator system was similar to that described by Cerdà (1998a); the height of sprayer was 6 m; the rain intensity can be ad-justed from 10 to 200 mm h−1; and the effective area of rain-fall is 6.5 m×6.5 m, and the uniformity of raindrops distri-bution is more than 85 %. The length of steel tank is 4 m, the width is 1.5 m and the depth is 35 cm. Total of 192 drainage holes with a diameter of 5 cm were uniformly formed at the bottom of tank for free-drainage of infiltrating water. The
Figure 1. Geographic situation of the study area in China.
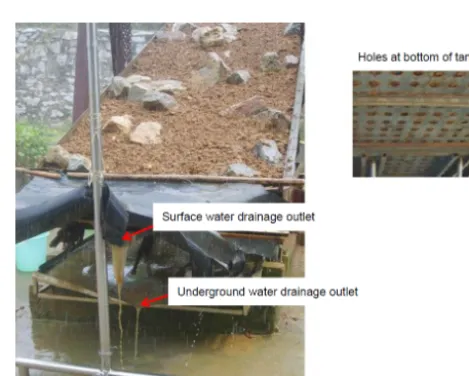
Figure 2. Image of steel tank.
porosity of drainage holes at the bottom of tank can be ad-justed from 0 to 6 % to simulate varied pore fissure degrees of underground bedrock. During the experiment, surface runoff and underground runoff from drainage outlets can be col-lected respectively at the lower end of the steel tank.
2.3 Test design
20, 30, 40 and 50 %. The rainfall intensities were 30, 50, 80, 120 and 150 mm h−1. The rainfall duration was 90 min for all rainfall events. A total of nine measurement durations were completed and each duration was 10 min. The soil compact-ness was 1070, 760 and 410 kPa from the lower part to the upper part. This compactness is similar to the actual mea-surement in field. According to a previous research reported by Tian et al. (2005), the critical slope of the changes of soil erosion intensity is approximately 25◦. In this paper, experi-mental slope is 25◦. The test repeated twice.
2.4 Soil layer simulation
The procedure to prepare each soil layer was as follows: first carbonate rocks were randomly arranged in the steel tank and the sizes of rocks were random. Secondly, soil was ho-mogenously backfilled in space of rocks in layer-by-layer with hands and rakes to simulate different bareness ratios of slope bedrocks. The total depth of soil layer was 30 cm, which is the average soil layer thickness in the field bared slope characteristic according to investigation results. Dur-ing soil fillDur-ing, the soil layer was divided into 3 sub-layers from the lower part to the upper part. For each sub-layer, the thickness of soil was 10 cm, but the amount of soil was not constant. After placing the soil, it was slightly packed with a wooden block in order to obtain needed soil compactness for each sub-layer. A soil compactness measurer was used to measure soil compactness. As procedures described above, we can simulated four bareness ratios of slope bedrocks, i.e., 10, 20, 30, 40 and 50 %.
2.5 Sample collection
When rainfall test is begun, the test design begins timing when runoff is produced from the surface and underground, then runoff sediment samples are collected through a small plastic bucket by taking 10 min as a unit. They are then are transferred into a 65 L plastic large bucket with scales marked, which is used for calculating the accumulated runoff amount. The water sample is then filled to the middle layer part of the bucket through a water bottle after being blended, the weight of soil in the water bottle is measured, and then the suspended load loss amount can be obtained through the ratio of the water volume in the water bottle to the water vol-ume in the small bucket. Water in the small bucket is then poured out, and the amount of soil deposited at the bottom of the small bucket is the bottom load loss amount.
A statistical analysis of the data was performed through SPSS Statistics 17.0 software.
3 Results
3.1 Analysis on influence on slope runoff and sediment production by rainfall intensity
The influence on slope runoff and sediment production by rainfall intensity is very obvious, and the relationship be-tween rainfall intensity and slope runoff and sediment pro-duction is closed. With the increasing of rainfall intensity, the increasing rate of slope accumulated sediment amount is higher than that of accumulated runoff amount (Zhu et al., 2009). Runoff is increased with the increasing of rain-fall intensity, and under identical rainrain-fall intensity, the ero-sion amount of surface with loose deposits is the greatest, the erosion amount of excavated bare areas takes second place, and the erosion amount of surface with vegetation cover is the lowest (Li and He, 2006; Leh et al., 2013). Soil erosion is obviously increased with the increasing of rainfall inten-sity. The influence on soil erosion by rainfall intensity is the biggest in the bare slope condition. The influence on soil ero-sion by slope length and by slope gradient is the approxi-mately the same; the more the slope length is and the steeper the slope surface is, the higher the soil erosion is, and con-versely the lower soil erosion is (Wang et al., 2004; Ziadat and Yaimeh, 2013).
Table 2. Rainfall intensity on the impact of runoff and sediment production.
Rainfall intensity (mm h−1) 30 50 80 120 150 Surface-accumulated runoff amount (L) 47.3 107.0 255.5 376.5 402.0 Underground-accumulated runoff amount (L) 149.5 226.5 249.5 258.5 289.0 Surface-accumulated bottom load amount (g) 0.00 0.00 63.44 99.36 210.05 Surface-accumulated suspended load amount (g) 81.33 214.46 459.46 528.35 1625.87 Underground-accumulated suspended load amount (g) 121.52 126.04 217.38 219.03 578.89
Note: in the table, the pore fissure degree is 2 %, the slope gradient is 25◦, the rock bareness ratio is 40 %, and the rainfall duration is 90min.
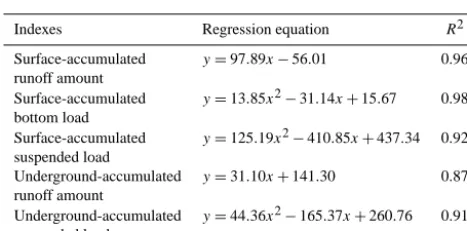
Table 3. Regression equation of accumulated runoff and sediment
production and rainfall intensity (x).
Indexes Regression equation R2
Surface-accumulated y=97.89x−56.01 0.96 runoff amount
Surface-accumulated y=13.85x2−31.14x+15.67 0.98 bottom load
Surface-accumulated y=125.19x2−410.85x+437.34 0.92 suspended load
Underground-accumulated y=31.10x+141.30 0.87 runoff amount
Underground-accumulated y=44.36x2−165.37x+260.76 0.91 suspended load
increasing rate of accumulated runoff and sediment amounts, and this result is similar with the research result of Zhu et al. (2009).
By taking rainfall intensity as a variable and correspond-ing accumulated runoff and sediment production as depen-dent variables to perform regression analysis and multi-model fitting selection, the obtained fitting results refer to Table 3. The table shows that optimally the regression rela-tionship model between rainfall intensity and slope surface and underground runoff and sediment production take a lin-ear quadratic polynomial, except a fitting determination co-efficient of underground-accumulated runoff amount. Other fitting determination coefficients are larger than 0.9 and reach significance level. This shows that the relation between slope surface, underground runoff, sediment production and rain-fall intensity is close, and the relation is positively correlated. Established models based on multiple simulation rainfall re-sults can be used for predicting the trend of water and soil loss in the southwest karst regions, and can be used for eval-uating long-term effects of various measures on karst region governance by being coupled into regional models.
3.2 Influence on slope runoff and sediment production by underground pore fissure degree
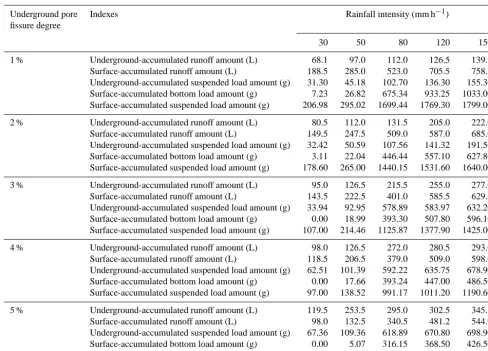
The statistical results of the influence on slop runoff and sed-iment production by underground pore fissure degree refer to Table 4. In the table, rainfall data with different pore fis-sure degrees in identical conditions (the rock bareness ratio
is 30 %, the slope gradient is 25◦, and the runoff yielding time is 90 min) are taken as examples. From Table 4, it can be seen that surface soil is lost in bottom load and suspended load modes, and underground soil is lost in a suspended load mode. When the pore fissures are the same, surface and un-derground runoff and sediment amounts are increased with the increasing of rainfall intensity, and the variation ampli-tude of accumulated sediment amount is larger than that of accumulated runoff amount. When the rainfall intensity is smaller (30 mm h−1) and the underground pore fissure degree is larger (3, 4 and 5 %), bottom load loss is produced on the surface, and only suspended load loss is produced because the soil permeability is high when the underground pore fis-sure degree is large and the rainfall intensity is small, the surface runoff is small, only small soil particles are lost with runoff suspension, and suspended load loss is not produced. When the rainfall intensity is not changed, surface runoff and sediment amounts are reduced with the increasing of the un-derground pore fissure degree. When the unun-derground runoff and sediment amounts are the opposite and continuously creased (because the underground pore fissure degree is in-creased), the leakage rate is increased, the surface runoff and sediment yields are reduced, and the underground runoff and sediment yields are increased. When the underground pore fissure is 1 % and the rainfall intensity is 150 mm h−1, the total soil erosion intensity is the highest, the total erosion amount reaches 33.2 g min−1. When the underground pore fissure is 5 %, the total erosion intensity is the lowest.
Table 4. Degrees of holes and fissures on the impact of runoff and sediment production.
Underground pore Indexes Rainfall intensity (mm h−1) fissure degree
30 50 80 120 150 1 % Underground-accumulated runoff amount (L) 68.1 97.0 112.0 126.5 139.5 Surface-accumulated runoff amount (L) 188.5 285.0 523.0 705.5 758.5 Underground-accumulated suspended load amount (g) 31.30 45.18 102.70 136.30 155.30 Surface-accumulated bottom load amount (g) 7.23 26.82 675.34 933.25 1033.00 Surface-accumulated suspended load amount (g) 206.98 295.02 1699.44 1769.30 1799.00 2 % Underground-accumulated runoff amount (L) 80.5 112.0 131.5 205.0 222.0 Surface-accumulated runoff amount (L) 149.5 247.5 509.0 587.0 685.0 Underground-accumulated suspended load amount (g) 32.42 50.59 107.56 141.32 191.50 Surface-accumulated bottom load amount (g) 3.11 22.04 446.44 557.10 627.80 Surface-accumulated suspended load amount (g) 178.60 265.00 1440.15 1531.60 1640.00 3 % Underground-accumulated runoff amount (L) 95.0 126.5 215.5 255.0 277.0 Surface-accumulated runoff amount (L) 143.5 222.5 401.0 585.5 629.5 Underground-accumulated suspended load amount (g) 33.94 92.95 578.89 583.97 632.20 Surface-accumulated bottom load amount (g) 0.00 18.99 393.30 507.80 596.10 Surface-accumulated suspended load amount (g) 107.00 214.46 1125.87 1377.90 1425.00 4 % Underground-accumulated runoff amount (L) 98.0 126.5 272.0 280.5 293.0 Surface-accumulated runoff amount (L) 118.5 206.5 379.0 509.0 598.0 Underground-accumulated suspended load amount (g) 62.51 101.39 592.22 635.75 678.90 Surface-accumulated bottom load amount (g) 0.00 17.66 393.24 447.00 486.50 Surface-accumulated suspended load amount (g) 97.00 138.52 991.17 1011.20 1190.60 5 % Underground-accumulated runoff amount (L) 119.5 253.5 295.0 302.5 345.2 Surface-accumulated runoff amount (L) 98.0 132.5 340.5 481.2 544.0 Underground-accumulated suspended load amount (g) 67.36 109.36 618.89 670.80 698.90 Surface-accumulated bottom load amount (g) 0.00 5.07 316.15 368.50 426.50 Surface-accumulated suspended load amount (g) 88.00 115.35 158.22 160.50 730.60
Note: rock bareness ratio is 30 %, the slop gradient is 25◦and the rainfall duration is 90 min.
Table 5. Regression equation of accumulated runoff and sediment
production and underground pore fissure degree (x).
Indexes Regression equation R2
Surface-accumulated y= −52.66x+731.62 0.91 runoff amount
Surface-accumulated y= −123.96x+934.61 0.80 bottom load
Surface-accumulated y= −373.80x+2291.50 0.89 suspended load
Underground-accumulated y=42.75x+105.65 0.93 runoff amount
Underground-accumulated y=156.34x−35.40 0.83 suspended load
Note: the results in the table are obtained by taking rainfall data being 120 mm h−1as an example.
on karst regional governance by being coupled into regional models.
3.3 Influence on slope runoff and sediment production on rainfall duration
Table 6. Relationship between the accumulation of runoff and
sed-iment production and rainfall duration.
Runoff Surface Underground Surface Surface Underground yielding runoff runoff bottom suspended suspended time (min) (L) (L) load (g) load (g) load (g)
0–10 25.0 13.5 5.28 30.08 10.55
10–20 21.0 12.0 2.51 23.98 9.66
20–30 22.0 14.5 1.24 21.65 11.59
30–40 23.0 13.0 0.98 21.91 8.70
40–50 25.0 13.5 2.82 23.73 9.18
50–60 27.0 14.0 1.79 23.92 11.09
60–70 27.0 15.5 1.35 26.22 13.50
70–80 27.0 16.0 1.99 23.38 9.58
80–90 25.5 14.5 1.03 19.61 9.11
Total 222.5 126.5 18.99 214.46 92.95
Average 24.7 14.1 2.11 23.83 10.33
Note: the pore fissure is 3 %, the rock bareness ratio is 30 %, the slope gradient is 25◦ and the rainfall intensity is 50 mm h−1.
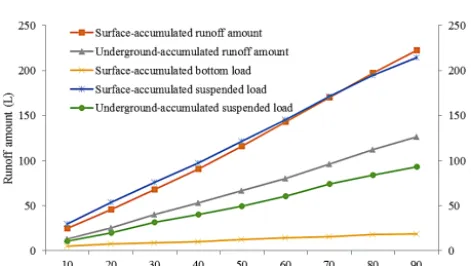
Figure 3. Change of accumulation runoff and sediment with
in-creasing rainfall time (experiment conditions: rainfall intensity is 50 mm h−1; degree of pore fissure is 30 %; bedrock rate is 3 %; slope steepness is 25◦).
rainfall duration, and the result is similar with the research result of Chen et al. (2011).
Figure 3 shows the relationship of rainfall duration and all accumulated amounts. From the figure it can be seen that surface- and underground-accumulated runoff, sediment-yielding amounts and rainfall duration form a negative rela-tionship, the bottom load produced on the surface is smallest, the variation amplitude is the smallest and nearly a horizon-tal line, and the slopek=1.7314. The variation amplitude of surface-accumulated runoff amount is the largest, and the slope isk=25.183. The regression relation model fitting re-sults of surface and underground runoff and sediment pro-duction and rainfall duration refer to Table 7.
3.4 Influence on slope runoff and sediment production by rock bareness ratio
Stony desertification classification is determined according to rock bareness intensity, the rock bareness ratio of severe stony desertification regions is larger than 80 %, the rock
Table 7. Regression equation of accumulated runoff and sediment
production and rainfall duration (x).
Indexes Regression equation R2
Surface-accumulated y=25.18x−30.93 0.99 runoff amount
Surface-accumulated y=1.73x+2.11 0.99 bottom load
Surface-accumulated y=23.32x−17.15 0.99 suspended load
Underground-accumulated y=14.18x−16.93 0.99 runoff amount
Underground-accumulated y=10.43x−10.94 0.99 suspended load
bareness ratio of moderate stony desertification regions is larger than 70 %, and when the rock bareness ratio of mild stony desertification regions is larger than 60 % (Hu et al., 2008), soil cover in the mild stony desertification regions is basically continuous, and the regions belong to arable exploitable regions. In this paper, the highest researched rock-bareness ratio is 50 %, and the region belongs within the scope of arable exploitable region, and does not belong within the scope of mild stony desertification.
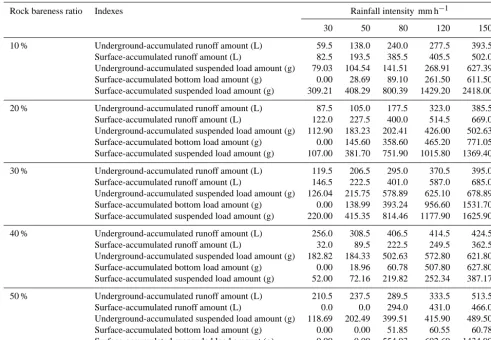
Table 8. Rates of exposed bedrock on the impact of runoff and sediment production.
Rock bareness ratio Indexes Rainfall intensity mm h−1
30 50 80 120 150 10 % Underground-accumulated runoff amount (L) 59.5 138.0 240.0 277.5 393.5 Surface-accumulated runoff amount (L) 82.5 193.5 385.5 405.5 502.0 Underground-accumulated suspended load amount (g) 79.03 104.54 141.51 268.91 627.39 Surface-accumulated bottom load amount (g) 0.00 28.69 89.10 261.50 611.50 Surface-accumulated suspended load amount (g) 309.21 408.29 800.39 1429.20 2418.00 20 % Underground-accumulated runoff amount (L) 87.5 105.0 177.5 323.0 385.5 Surface-accumulated runoff amount (L) 122.0 227.5 400.0 514.5 669.0 Underground-accumulated suspended load amount (g) 112.90 183.23 202.41 426.00 502.63 Surface-accumulated bottom load amount (g) 0.00 145.60 358.60 465.20 771.05 Surface-accumulated suspended load amount (g) 107.00 381.70 751.90 1015.80 1369.40 30 % Underground-accumulated runoff amount (L) 119.5 206.5 295.0 370.5 395.0 Surface-accumulated runoff amount (L) 146.5 222.5 401.0 587.0 685.0 Underground-accumulated suspended load amount (g) 126.04 215.75 578.89 625.10 678.89 Surface-accumulated bottom load amount (g) 0.00 138.99 393.24 956.60 1531.70 Surface-accumulated suspended load amount (g) 220.00 415.35 814.46 1177.90 1625.90 40 % Underground-accumulated runoff amount (L) 256.0 308.5 406.5 414.5 424.5 Surface-accumulated runoff amount (L) 32.0 89.5 222.5 249.5 362.5 Underground-accumulated suspended load amount (g) 182.82 184.33 502.63 572.80 621.80 Surface-accumulated bottom load amount (g) 0.00 18.96 60.78 507.80 627.80 Surface-accumulated suspended load amount (g) 52.00 72.16 219.82 252.34 387.17 50 % Underground-accumulated runoff amount (L) 210.5 237.5 289.5 333.5 513.5 Surface-accumulated runoff amount (L) 0.0 0.0 294.0 431.0 466.0 Underground-accumulated suspended load amount (g) 118.69 202.49 399.51 415.90 489.50 Surface-accumulated bottom load amount (g) 0.00 0.00 51.85 60.55 60.78 Surface-accumulated suspended load amount (g) 0.00 0.00 554.93 602.69 1434.90
Note: the pore fissure degree is 3 %, the slope degree is 25◦and the rainfall duration is 90 min.
relatively, and the water and soil infiltration rate is increased on the contrary, so that the slope runoff and sediment pro-duction present a fluctuating change with the increasing of the rock bareness ratio given that the rainfall intensity is not changed, while the slope runoff and sediment production is increased with the increasing of the rainfall intensity given that the rock bareness ratio is not changed.
By taking rock bareness ratio as a variable and accumu-lated runoff and sediment production as a dependent variable to perform regression analysis and multi-model fitting selec-tion, the obtained fitting results refer to Table 8. From the table it can be seen that optimally, the regression relation-ship model between the rock bareness ratio, slope runoff and sediment production takes a quadratic polynomial and a cu-bic polynomial, except fitting the determination coefficient of the underground accumulated suspended load. Other fit-ting determination coefficients are larger than 0.9 and do not reach significance level. This does not show that the slope runoff and sediment production are increased or reduced, but rather presents a fluctuating change with the rock bareness ratio increasing. Established models based on multiple
sim-ulation rainfall results can be used for predicting the trend of karst water and soil loss in the southwest region, and can be used for evaluating long-term effects of various measures on karst regional governance by being coupled into regional models.
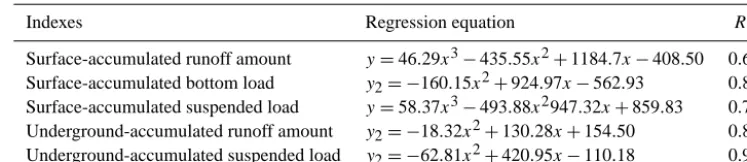
By performing total comparison on fitting determination coefficientR2of all variables and dependent variables, the obtained correlation degree of all factors and soil erosion is as follows: rainfall intensity > rainfall duration > pore fissure degree > bedrock bareness ratio (Table 9).
4 Discussions and prospects
Table 9. Regression equation of accumulated runoff and sediment production and rock bareness ratio (x).
Indexes Regression equation R2
Surface-accumulated runoff amount y=46.29x3−435.55x2+1184.7x−408.50 0.63 Surface-accumulated bottom load y2= −160.15x2+924.97x−562.93 0.83
Surface-accumulated suspended load y=58.37x3−493.88x2947.32x+859.83 0.74 Underground-accumulated runoff amount y2= −18.32x2+130.28x+154.50 0.83
Underground-accumulated suspended load y2= −62.81x2+420.95x−110.18 0.94
Note: the results in the table are obtained by taking rainfall data being 120 mm h−1as an example.
amount. When the rainfall is small (30, 50 mm h−1), no bot-tom load loss is produced on the surface, and only suspended load loss is produced. Only when the rainfall intensity is in-creased to 80 mm h−1 are bottom load and suspended load loss produced on the surface, and the increasing rate of mulated sediment runoff amount is higher than that of accu-mulated runoff amount.
When the underground pore fissure is not changed, the sur-face and underground runoff as well as sediment production is increased with the increasing of rainfall intensity, and the variation amplitude of the accumulated sediment amount is larger than that of the accumulated runoff amount. When the rainfall is small (30 mm h−1) and the underground pore fis-sure is large (3, 4 and 5 %), bottom load loss produced on the surface is 0. When the rainfall intensity is not changed, the surface runoff and sediment production is continuously reduced with the increasing of underground pore fissure de-gree, while the underground runoff and sediment production is contrary and presents a trend of continuously increasing.
Soil is mainly lost in a surface suspended load mode, the surface suspended load loss is about 2/3 of the total soil loss amount, and ground suspended loss takes the sec-ond plate; Raindrops hit the surface, forming a crust with rainfall duration. The formation of crusts increases surface runoff erosion and reduces soil infiltration rate. This forma-tion also increases of surface-runoff-erosion-damaged crust and increased soil seepage rate. Raindrops continued to hit the surface, leading the formation of crust. Soil permeabil-ity showed volatilpermeabil-ity which was from reduction to increases, reduction, and so on. Surface and subsurface runoff were volatile with rainfall duration.
When the rainfall intensity is low (30 mm h−1), no bottom load loss is produced on the surface, and only suspended load loss is produced. When the rock bareness ratio is 50 %, and the rainfall intensity is 30 and 50 mm h−1, no runoff is pro-duced on the surface, and only underground water and soil loss are produced. When the rainfall intensity is not changed, the slop runoff and sediment product present a fluctuating change with the increasing of the rock bareness ratio, and when the rock bareness ratio is not changed, the slope runoff and sediment product is increased with the increasing of rain-fall intensity. Soil infiltration loss depends on the bedrock bareness ratio and the soft and the hard contact surface
be-tween soil and rock. Our results also essentially confirmed the report of Martínez-Zavala and Jordán (2008) and Jiménez et al. (2013). On the whole, our results show further that rock fragments on the soil surface play an important role in con-trolling soil and water loss in the karst areas (Cerda, 1998b). A large amount of runoff plot monitoring results show that the surface soil erosion modulus of karst regions is very small, only ranging between 10 tons and several hun-dreds of tons, and there is a big difference between the sur-face soil erosion modulus and the result predicted through a corrected universal soil loss equation. Traditional princi-ples of runoff yield under saturated storage and runoff yield under excess infiltration can not perfectly describe the slop runoff and sediment production in karst regions because of the pervasive development of special lithological fissures, ponors and underground rivers in karst regions. After rainfall runoff passes through rock–soil fissures, downward preferen-tial flow is produced. Only by establishing a surface rainfall erosion force model based on the preferential flow principle is it likely that surface soil loss in karst regions can be rea-sonably predicted.
Acknowledgements. This study is funded by the National Natural
Science Foundation of China (41461057; 41061029), Great Special Foundation of Guizhou Province (in the year of 2014, No. 2002) and Projects in the National Science & Technology Pillar Program dur-ing the Twelfth Five-year Plan Period (2011BAC02B02).Thanks go to professor of Ni Jiupai, Zhou Chuan, Zhang Yang, Shi Yonglian, Liang Zengfang, and Liu Yuejiao for providing help.
Edited by: A. Jordán
References
Anthony, D., Bernard, B., and Turner, S. P.: Uranium-series isotopes in river materials: insights into the timescales of erosion and sed-iment transport, Earth Planet. Sc. Lett., 265, 1–17, 2008. Bissonnais, Y. L., Cerdan, O., Lecomte, V., Broard, M., and Peter H.
K.: Variability of soil surface characteristics influencing runoff and interrill erosion, Catena, 62, 111–124, 2005.
Biro, K., Pradhan, B., Buchroithner, M., Makeschin, F.: Land use/land cover change analysis and its impact on soil proper-ties in the Northern part of Gadarif region, Sudan, Land Degrad. Dev., 24, 90–102, doi:10.1002/ldr.1116, 2013.
Cai, B., Cheng, H., Hou, J., and Mendel, L.: The Impact of Soil Ero-sion on The Formation of Yunnan Stone Forest: evidences from Stalagmite and Field Observations, Quat. Sciences, 25, 170–175, 2005.
Cai, X., W, J., Lei, L., Wang, H., and Li, X.: Laboratorial simu-lation of different rainfall intensity influence on soil erosion in Southwest Karst area, China, J. Soil Water Conserv., 23, 5–13, 2009.
Cerdà, A.: The influence of aspect and vegetation on seasonal changes in erosion under rainfall simulation on a clay soil in Spain, Canadian J. Soil Sci., 78, 321–330, 1998a.
Cerdà, A.: Relationships between climate and soil hydrological and erosional characteristics along climatic gradients in Mediter-ranean limestone areas, Geomorphology, 25, 123–134, 1998b. Cerdà, A.: Aggregate stability against water forces under different
climates on agriculture land and scrubland in southern Bolivia, Soil Till. Res., 36, 1–8, 2000.
Cerdà, A, Flanagan, D. C., and le Bissonnais, Y.: Soil Erosion and Agriculture, Soil Till. Res., 98–107, doi:10.1016/j.still.2009.10.006, 2009a.
Cerdà, A., Giménez-Morera, A., y Bodí, M. B.: Soil and water losses from new citrus orchards growing on sloped soils in the western Mediterranean basin, Earth Surf. Proc. Land., 34, 1822– 1830, doi:10.1002/esp.1889, 2009b.
Cerdà, A., Hooke, J., and Romero-Diaz, A.: Soil erosion on mediterraneantype-ecosystems, Land Degrad. Dev., 21, 71–74, doi:10.1002/ldr.968, 2010.
Chai, Z.: Study on soil erosion in Guangxi Karst region, J. Mt. Sci.,7, 255–259, 1989.
Chen, Q., Chang, E., Bi, B., Chen, W. T., and Li, D. J.: Comparison between two lands of water and soil conservation in Southeastern Yunnan, Research of Soil and Water Conservation, 14, 281–284, 2007.
Chen, Z., Xia, Q., Shi, D., Liu, H. Y., and Wu, S. F.: Soil surface crust characteristic and response feature to slope erosion base on simulation rainfall, J. Soil Water Conserv., 25, 6–11, 2011.
Daniel, H.: Environmental Soil Physics, Academic Press, 188–190, 1998.
Dong, Y.: Slope Soil Erosion Intensity Spatial Characteristics and Soil Erosion Process Based on Magnetic Measurement, Shan-dong Agricultural University, 2006.
Fu, W., Zhang, Z., Zhang, H., Zhang, K., and Gu, D. C.: Study on characteristics of soil erosion on Karst hillslope, J. Soil Water Conserv., 21, 38–41, 2007.
Gao, H., Sun, Q., and Yuan, Y.: Characteristics of soil erosion for different land types in Karst areas, B. Soil Water Conservation, 30, 92–96, 2010.
García-Orenes, F., Cerdà, A., Mataix-Solera, J., Guerrero, C., Bodí, M. B., Arcenegui, V., Zornoza, R., and Sempere, J. G.: Ef-fects of agricultural management on surface soil properties and soil-water losses in eastern Spain, Soil Till. Res., 106, 117–123, doi:10.1016/j.still.2009.06.002, 2009.
Gillieson, D., Wallbrink, P., and Cochrranea, A.: Vegetation change, erosion risk and land management on the Nullarbor Plain, Aus-tralia, Environ. Geol., 28, 145–153, 1996.
Giménez Morera, A., Ruiz Sinoga, J. D., and y Cerdà, A.: The im-pact of cotton geotextiles on soil and water losses in Mediter-ranean rainfed agricultural land, Land Degrad. Dev., 43, 210– 217, doi:10.1002/ldr.971, 2010.
Haile, G. W. and Fetene, M.: Assessment of soil erosion hazard in Kilie catchment, East Shoa, Ethiopia, Land Degrad. Dev., 23, 293–306, doi:10.1002/ldr.1082, 2012.
Haregeweyn, N., Poesen, J., Verstraeten, G., Govers, G., de Vente, J., Nyssen, J., Deckers, J., and Moeyersons, J.: Assessing the performance of a spatially distributed soil erosion and sed-iment delivery model (WATEM/SEDEM) in Northern Ethiopia, Land Degrad. Dev., 24, 188–204, doi:10.1002/ldr.1121, 2013. Hu, Y., Liu, Y., Wu, P., Zhao, X. N., and Niu, W. Q.: Rocky
deser-tification in Guangxi karst mountainous area: its tendency, for-mation causes and rehabilitation, J. Chinese Agricult. Eng., 24, 96–100, 2008.
Jiménez, M. N., Fernández-Ondoño, E., Ripoll, M. Á, and Bertson, M. N.: Stones and organic mulches improve the Quercus ilex L. afforestation success under Mediterranean climatic conditions, Land Degrad. Dev., 24, 45–54, 2013.
Kheir, R. B., Abdallah, C., and Khawlie, M.: Assessing soil ero-sion in Mediterranean karst landscapes of Lebanon using remote sensing and GIS, Eng. Geol., 16, 239–254, 2008.
Leh, M., Bajwa, S., and Chaubey, I.: Impact of land use change on erosion risk: and integrated remote sensing geopraphic informa-tion system and modeling methodology, Land Degrad. Dev., 24, 409–421, doi:10.1002/ldr.1137, 2013.
Li, J. and He, Z.: Research on red oil slop runoff and soil erosion un-der different rainfall intensities, Environment, S1, 10–11, 2006. Li, S., Ren, H., Yao, X., Zhang, D. Y., and Dai, Q. H.: Study on
char-acteristics of runoff and nutrition loss between different vegeta-tion land in typical karst rock desertificavegeta-tion zone, J. Soil Water Conserv., 23, 1–6, 2009.
Li, Y., Shao, J., Wang, S., Wang, J. X., and Li, X. J.: Assessment of soil erosion sensitivity based on the characteristics of karst ecosystem, J. Mt. Sci., 25, 671–677, 2007.
Liu, B. and Wu, F.: Soil Erosion, Shaanxi People’s Publishing House, Xi’an, China, 1997.
Hua-jiang demonstration area as an example, Chinese Academic Jour-nal (CD) Electronic JourJour-nals, 1–120, 2006.
Mandal, D. and Sharda, V. N.: Appraisal of soil erosion risk in the Eastern Himalayan region of India for soil conservation plan-ning, Land Degrad. Dev., 24, 430–437, doi:10.1002/ldr.1139, 2013.
Martínez-Zavala, L. and Jordán, A.: Effect of rock fragment cover on interrill soil erosion from bare soils in Western Andalusia, Spain, Soil Use Manage., 24, 108–117, 2008.
Peng, J. and Yang, M.: On the present soil erosion situation of Hua-jiang karst gorge in Guizhou province, J. Mt. Sci., 19, 511–515, 2001.
Peng, T., Wang, S., Zhang, X., Zhao, Q. G., and Chen, T. F.: Results of preliminary monitoring of surface runoff coefficients for karst slopes, Earth and Environment, 36, 125–129, 2008.
Prokop, P. and Por˛eba, G. J.: Soil erosion associated with an upland farming system under population pressure in Northeast India, Land Degrad. Dev., 23, 310–321, doi:10.1002/ldr.2147, 2012. Royall, D.: Use of mineral magnetic measurements to investigate
soil erosion and sediment delivery in a small agricultural catch-ment in limestone terrain, Catena, 46, 15–34, 2001.
Sidle, R. C., Kitahara, H., and Temjima, T.: Experimental studies on the effcets of pipe flow on through flow partitioning, J. Hydrol., 16, 207–219, 1995.
Sweeting, M. M.: Reflections on the development of Karst geo-morphology in Europe and a comparison with its development in China, Z. Geomorphol., 37, 127–138, 1993.
Tian , F., Wang, Z., Niu, Z., Ma, J., and Wu, H.: Experimental re-search on soil erosion process in Loess hill slope, Agricultural Research in the Arid Areas, 23, 141–146, 2005.
Timothy, A. Q., Gerarel, G., Jean, P., Jeroshuer, H., and Peter, K.: Fine earth translocatio by tillage in stony soils in the Guadalentin southeast Spain, aninvestigation using Caesium-137, Soil Till. Res., 51, 279–301, 1999.
Wang, H., Xiong, K., and Liu, Y.: Mechanism research of soil and water loss underground in karst region, Soil and Water Conser-vation in China, 8, 11–15, 2009.
Wang, Z., Wang, Y., Huang, X., Wan, X. H., and Liu, Q. S.: Soil erosion process research of the loess bare slope, Research of Soil and Water Conservation, 11, 84–87, 2004.
Wu, S., Zhu, W., Su, W., Liu, T. H., and Li, X. H.: Study on soil erosion and nutrient loss positioning in karst regions, Garsolog-ica SinGarsolog-ica, 24, 302–502, 2005.
Zhang, H., Wang, Y., Bei, Y., Cheng, Y., Shi, Y., Sheng, Q., Yang, M., and Chang, D.: A study on pipe flow on the slope of granite region of the Three Gorges Area of Yangtze River, Jour-nal of Beijing Forestry University, 22, 53–57, 2000.
Zhang, X., Jiao, J., He, X., Wu, S. F., and Li, J.: Soil loss tolerance and reasonable soil loss, Sci. Soil Water Conservation, 5, 114– 116, 2007.
Zhang, X., Wang, S., and Cao, J.: Mass balance of silicate miner-als in soils and soil losses in the karst mountainous regions of Southwest China, Earth and Environment, 37, 97–102, 2009. Zhang, Y., Xiong, K., An, Y., Liang, H. T., and Wu, K. M.: Soil
erosion of Huajiang demonstrating area in karst gorge region, B. Soil Water Conservation, 23, 19–22, 2003.
Zhang, Z., Fu, W., Zhang, H., Xiao, J. H., and Ma, K.: Study on soil erosion of different degrees in karst region by using cesium-137 technique, J. Mt. Sci., 25, 302–308, 2007.
Zhao, G., Mu, X., Wen, Z., Wang, F., and Gao, P.: Soil erosion, conservation, and Eco-environment changes in the Loess Plateau of China, Land Degrad. Dev., 24, 499–510, doi:10.1002/ldr.2246, 2013.
Zhou, N., Li, C., Jiang, S., Liu, G. M., and Long, X. H.: Models of soil and water loss and soil leakage in puding karst area, Bulletin of Soil and Water Conservation, 29, 7–11, 2009.
Zhu, X., Zhang, L., Fang, J., Zhao, Y. G., and Xiao, P. Q.: Research on simulated rainfall experiments of sediment yield in the pro-cesses of soil water erosion on sloping field, B. Sci. Technol. Soc., 25, 680–683, 2009.