Article
Screening and Application of
Cyberlindnera
Yeasts to
Produce a Fruity, Non-Alcoholic Beer
Konstantin Bellut1 , Maximilian Michel2, Martin Zarnkow2, Mathias Hutzler2 , Fritz Jacob2, Jonas J. Atzler1, Andrea Hoehnel1, Kieran M. Lynch1 and Elke K. Arendt1,3,*
1 School of Food and Nutritional Sciences, University College Cork, College Road, Cork, Ireland 2 Research Center Weihenstephan for Brewing and Food Quality, Technische Universität München, Alte
Akademie 3, 85354 Freising-Weihenstephan, Germany
3 APC Microbiome Ireland, University College Cork, College Road, Cork, Ireland * Correspondence: e.arendt@ucc.ie
Received: 14 November 2019; Accepted: 13 December 2019; Published: 17 December 2019
Abstract:Non-alcoholic beer (NAB) is enjoying growing demand and popularity due to consumer lifestyle trends and improved production methods. In recent years in particular, research into
the application of non-Saccharomycesyeasts to produce NAB via limited fermentation has gained
momentum. Non-Saccharomycesyeasts are known to produce fruity aromas, owing to a high ester
production. This trait could be harnessed to mask the often-criticized wort-like off-flavor of NAB
produced via limited fermentation. SixCyberlindnerastrains were characterized and screened in
wort extract. Four of the six strains produced a pleasant, fruity aroma while exhibiting low ethanol
production. The strainCyberlindnera subsufficiensC6.1 was chosen for fermentation optimization via
response surface methodology (RSM) and a pilot-scale (60 L) brewing trial with subsequent sensory evaluation. A low fermentation temperature and low pitching rate enhanced the fruitiness and overall acceptance of the NAB. The NAB (0.36% ABV) produced on pilot-scale was significantly more
fruity and exhibited a significantly reduced wort-like off-flavor compared to two commercial NABs.
This study demonstrated the suitability ofCyberlindnera subsufficiensto produce a fruity NAB, which
can compete with commercial NABs. The outcome strengthens the position of non-Saccharomyces
yeasts as a serious and applicable alternative to established methods in NAB brewing.
Keywords: brewing; Cyberlindnera; NABLAB; alcoholic beer; conventional yeast; non-Saccharomycesyeast; response surface methodology
1. Introduction
While the overall market growth of beer is slowing down, non-alcoholic and low alcohol beer (NABLAB) is growing in volume and popularity, owed to stricter legislation, lifestyle trends and
improved production methods [1]. The increasing interest has fueled research in NABLAB production
methods, especially in recent years, aimed at overcoming taste deficits compared to regular beer and consequently improving consumer acceptance. The two major production methods, physical dealcoholization and limited fermentation, both compromise the taste of the beer. Dealcoholized beer is often criticized for its lack of body and aromatic profile, a consequence of the removal of volatile esters and higher alcohols in conjunction with ethanol. Apart from a sweet taste due to residual sugars, one of the main points of criticism of NAB produced by limited fermentation is its wort-like off-flavor caused by aldehydes present in the wort [2]. In regular beer, ethanol significantly increases aldehyde retention, reducing the perceptibility of the wort-like flavor. However, in NAB produced by limited fermentation, the low ethanol content and higher levels of mono- and disaccharides intensify this undesired off-flavor [3].
Fermentation2019,5, 103 2 of 24
It is known that esters, which yeast produce as a by-product of alcoholic fermentation, are extremely important for the flavor profile of beer [4,5]. The lack thereof, as well as their overproduction, can significantly compromise the flavor. Aside from strain-specific differences, the process parameters such as the fermentation temperature, pitching rate and wort gravity have been shown to have a significant influence on ester formation [4,6]. In non-alcoholic beers, ester concentrations are lower compared to regular beer, independent of the production method [7,8]. While physical dealcoholization
removes esters that were previously produced, limited fermentation adversely affects the production
of substantial amounts in the first place.
Non-Saccharomycesyeasts are known for their important contribution to the flavor profile of fermented foods and beverages and have therefore been investigated for their targeted application
in bioflavoring and, not least, NABLAB brewing [1,9,10]. Species that have been mentioned in the
context of NABLAB production belong to the generaCyberlindnera,Hanseniaspora,Lachancea,Mrakia,
Pichia,Torulaspora,Saccharomycodes,ScheffersomycesandZygosaccharomyces[1,11–16]. In particular, the Cyberlindneraspecies are known for their high ester production, which was shown in studies with Cyberlindnera saturnus(formerlyWilliopsis saturnus),C. mrakii(formerlyWilliopsis saturnusvar. mrakii) andC. subsufficiens(formerlyWilliopsis saturnusvar. subsufficiens) [17–20]. Furthermore, it has been proposed to use yeasts with high production of flavor compounds (i.e., esters, higher alcohols) to mask the wort-like flavor of NAB produced by limited fermentation. However, research in that direction is sparse [21,22]. In addition, such yeasts are capable of reducing aldehydes to their correspondent alcohol, which can also enhance the reduction of the often-criticized wort-like off-flavor [23,24].
In this study, six strains of the genusCyberlindnerawere investigated to create a fruity NAB.
After identification, the strains were characterized for their substrate utilization, flocculation behavior and stress responses. A screening in diluted wort extract was performed to investigate the strains’ potential to produce a pronounced fruity flavor without the production of high concentrations of
ethanol. Interspecific differences in sugar consumption and the production of volatile fermentation
by-products was investigated by means of high-performance liquid chromatography (HPLC) and gas chromatography (GC). The most promising strain was studied further to determine the optimal fermentation conditions to enhance the fruity flavor, which was performed by means of response surface methodology (RSM). Finally, a non-alcoholic beer was produced on pilot-scale (60 L), and its analytical attributes, aroma, and taste compared to two commercial NABs were examined.
2. Materials and Methods
2.1. Materials
All reagents used in this study were at least analytical grade from Sigma-Aldrich (St Louis MO, USA) unless stated otherwise. The wort extract applied in this study was spray-dried wort from 100% barley malt (Spraymalt Light, Muntons plc, Suffolk, UK). For the pilot-scale brewing, pilsner malt and acidulated malt were sourced from Weyermann (Malzfabrik Weyermann, Bamberg, Germany).
2.2. Yeast Strains
Strain Origin and Identification
Strain 837A was isolated from a brewery cellar, NT Cyb originates from a dried fermentation
starter for rice wine, strain C6.1 originates from a coconut, and L1 from “Lulo”, the fruit ofSolanum
quitoense. The type strains CBS 1707 and CBS 5763 originate from soil samples. For identification, the
D1/D2 domain of the 26S rRNA gene was amplified, sequenced and compared to publicly available
sequences in the National Center for Biotechnology Information (NCBI) database using the Basic Local Alignment Search Tool (BLAST;https://blast.ncbi.nlm.nih.gov/Blast.cgi).
The DNA of the yeast isolates was extracted using an extraction kit (Yeast DNA
of the 26S rRNA gene, the primers NL1 (50-GCATATCAATAAGCGGAGGAAAAG-30) and NL4
(50-GGTCCGTGTTTCAAGACGG-30) were used. Polymerase chain reaction (PCR) was performed
using the temperature protocol: 95◦C/2 min; 30 cycles of 95◦C/30 s, 56◦C/15 s; 72◦C/60 s; 72◦C/5 min. Stock cultures were kept in 50% (v/v) glycerol at−80◦C.
2.3. Yeast Characterization
2.3.1. Flocculation Assay and Phenolic Off-Flavor (POF) Test
The flocculation test was performed using a slightly modified Helm’s assay [25,26]. Essentially, all cells were washed in ethylenediaminetetraacetic acid (EDTA) and the sedimentation period was
extended to 10 min. Wort was composed of 75 g/L spray-dried malt extract (Spraymalt Light, Muntons
plc, Suffolk, UK) adjusted to 15 International Bitterness Units (IBU) (15 mg/mL iso-α-acids; from 30% stock solution; Barth-Haas Group, Nürnberg, Germany).
The phenolic off-flavor test was performed according to Meier-Dörnberg et al. [27]. In short, yeast strains were spread on yeast and mold agar plates (YM-agar) containing only one of the following precursors: either ferulic acid, cinnamic acid or coumaric acid. After three days of incubation at 25◦C, plates were evaluated by a trained panel by sniffing to detect any of the following aromas: clove-like
(4-vinylguajacol), Styrofoam-like (4-vinylstyrene) and medicinal-like (4-vinylphenol). Saccharomyces
cerevisiaeLeoBavaricus—TUM 68®(Research Center Weihenstephan for Brewing and Food Quality, Freising-Weihenstephan, Germany) was used as a positive control.
2.3.2. Substrate Utilization
To analyze substrate utilization by theCyberlindnerastrains, the test kit API ID 32C (BioMérieux,
Marcy-l’Étoile, France) was used. Preparation of the inoculum and inoculation of the strips were
performed according to the manufacturers’ instructions. Colonies for the inoculum were grown on yeast extract peptone dextrose (YPD) agar plates for 48 h at 27◦
C. After inoculation, API ID 32C strips
were incubated for 2 days at 28◦C. The samples were evaluated visually for turbidity in the wells,
differentiating positive (+), negative (−), and weak (w) growth.
2.3.3. Stress Tests
Stress tests were performed via the measurement of yeast growth in a microplate, through the repeated measurement of absorbance over a time period of 96 h (Multiskan FC, Thermo Scientific, Waltham, MA, USA). The substrate for the hop sensitivity test was sterile-filtered wort extract (75 g/L Muntons Spraymalt Light) adjusted to 0, 50 and 100 mg/L iso-α-acids (1 mg/L=1 International Bitterness Unit, IBU), respectively, by using an aliquot of a stock solution of 3% iso-α-acids in 96% (v/v) ethanol (Barth-Haas Group, Nürnberg, Germany). For testing ethanol sensitivity, the sterile-filtered
wort extract was adjusted to 0%, 2.5%, 5% and 7.5% ABV with an aliquot of 100% (v/v) ethanol. For
testing pH sensitivity, the sterile-filtered wort extract was adjusted to the following pHs with 2 M HCl: 5.5 (control without addition of HCl): 5.0, 4.0 and 3.0. For inoculation, strains were grown in sterilized wort extract for 24 h at 25◦
C under aerobic conditions. The microtiter plate wells were inoculated
with a concentration of 105cells/mL. The wells contained 200µL of the respective wort substrates.
Plates were incubated at 25◦C, and absorbance was measured every 30 min at 600 nm without shaking
over a time period of 96 h (Multiskan FC, Thermo Scientific, Waltham, MA, USA). Stress tests were performed in triplicate.
2.4. Yeast Screening
2.4.1. Propagation
Fermentation2019,5, 103 4 of 24
Laboratory Supplies Ltd, Dublin, Ireland) containing 150 mL propagation wort consisting of 75 g/L
spray-dried malt (Spraymalt light, Muntons plc, Suffolk, UK) and 30 g/L glucose (Gem Pack Foods
Ltd., Dublin, Ireland), sterilized at 121◦C for 15 min. The bottles were covered with sterile cotton and placed in an incubator with orbital shaker (ES-80 shaker-incubator, Grant Instruments (Cambridge)
Ltd, Shepreth, UK) and incubated for 24 h at an orbital agitation of 170 rpm at 25◦C (Strain 837A was
incubated for 48 h). Cell count was performed using a Thoma Hemocytometer with a depth of 0.1 mm (Blaubrand, Sigma-Aldrich, St. Louis, MO, USA).
2.4.2. Fermentation
Fermentation wort was prepared by dissolving 75 g/L spray-dried malt extract (Munton Spraymalt
light) in 1 L of brewing water and sterilizing at 121◦C for 15 min, followed by filtration through a
sterile grade 1V Whatman filter (Whatman plc, Maidstone, UK) to remove hot trub formed during sterilization. The analytical attributes of the fermentation wort for the yeast screening trial and RSM trial is shown in Table1.
Table 1.Attributes of screening wort from wort extract.
Attribute Unit Value
Real Extract ◦P 6.97±0.00
pH − 5.20±0.01
Free amino nitrogen (FAN) mg/L 115±1
Maltotriose g/L 8.12±0.15
Maltose g/L 32.37±0.57
Sucrose g/L 0.83±0.04
Glucose g/L 5.68±0.91
Fructose g/L 1.45±0.10
Fermentation trials were carried out in 1 L sterile Duran glass bottles, equipped with an air lock. Per yeast strain, triplicate bottles were filled with 400 mL of wort and left untouched throughout the
fermentation. Yeast cells for pitching were washed by centrifugation at 900gfor 5 min and resuspended
in sterile water to ensure no carryover of sugars from the propagation wort into the fermentation wort. Pitching rate was 3×10⁷cells/mL. Fermentation temperature was 25◦
C. Fermentation was performed until no change in extract could be measured for two consecutive days.
2.5. Scanning Electron Microscopy (SEM)
Yeast cultures for scanning electron microscopy (SEM) were prepared following the protocol for
cultured microorganisms by Das Murtey and Ramasamy [28]. Single colonies were taken from a YPD
agar plate and grown in YPD broth for 24 h at 25◦C. One milliliter of sample was centrifuged at 900
g for 2 min for pellet formation and resuspended in 5% glutaraldehyde solution prepared in 0.1 M
phosphate buffer (pH 7.2) for fixation. After 30 min, the sample was centrifuged, the supernatant was
discarded, and the pellet was washed twice in 0.1 M phosphate buffer. Consequently, the pellet was
resuspended in 1% osmium tetroxide prepared in 0.1 M phosphate buffer. After 1 h, cells were again
washed twice in 0.1 M phosphate buffer. The sample was then dehydrated through an ethanol series
of 35%, 50%, 75%, 95%, absolute ethanol, and hexamethyldisilazane (HDMS), with 30 min per step (last two ethanol steps twice), centrifuging and discarding the supernatant at each change. Lastly, the second HDMS was discarded and the sample left drying overnight in a desiccator.
2.6. Response Surface Modeling (RSM)
To investigate optimal fermentation conditions for C6.1 to produce a fruity, non-alcoholic beer, response surface methodology (RSM) was performed using DesignExpert 9 software (StatEase, Minneapolis, MN, USA). A two-factorial, face-centered, central composite design with single factorial points and 5 replications of the center point was chosen. The predictor factors were temperature (17, 22, 27◦C), and pitching rate (10, 35, 60×106cells/mL).
Spray-dried malt extract (Spraymalt light, Muntons plc, Suffolk, UK) served as the substrate. Wort preparation, propagation and inoculation were carried out as outlined in 2.4.1. The wort used was the
same as in the screening (Table1). Fermentation volume was 150 mL in 250 mL Duran glass bottles
equipped with an air lock. Fermentation was performed until no change in extract could be measured
for two consecutive days. Table2shows the experimental design.
Table 2. Response surface methodology (RSM) experimental design: Two-factorial, face-centered, central composite design with five repetitions of the center point. Factor 1, A: temperature, range 17, 22, 27◦C. Factor 2, B: pitching rate, range 10, 35, 60×106cells/mL.
Run Factor 1 Factor 2
A: Temperature (◦C) B: Pitching Rate (×106cells/mL)
1 22 60
2 22 10
3 17 35
4 27 35
5 * 22 35
6 * 22 35
7 17 60
8 * 22 35
9 * 22 35
10 * 22 35
11 17 10
12 27 10
13 27 60
* Center point.
Models were produced applying backward elimination regression of insignificant model terms
withαto exit of 0.1 (detailed report in supplementary Data Sheet S1). For significant models with
insignificant lack of fit (LOF), 3D response surface plots were produced. Fermentations for model validation were performed in the same wort with propagation as outlined in 2.4.1 and fermentation as outlined above.
2.7. Pilot-Scale Brewing
2.7.1. Wort Production
Wort for the pilot brew was produced in a 60 L pilot-scale brewing plant consisting of a combined mash-boiling vessel, a lauter tun and whirlpool (FOODING Nahrungsmitteltechnik GmbH, Stuttgart, Germany). The grain bill comprised 6.65 kg Weyermann Pilsner Malt and 0.35 kg Weyermann Acidulated Malt (Malzfabrik Weyermann, Bamberg, Germany). Grains were milled with a two-roller mill (“Derby”, Engl Maschinen, Schwebheim, Germany) at a 0.8 mm gap size. The crushed malt was
mashed-in with 30 L of brewing water at 50◦
C. The following mashing regime was employed: 20 min
at 50◦C, 20 min at 62◦C, 10 min at 72◦C and mashing out at 78◦C. The mash was pumped into the
lauter tun, and lautering was performed after a 15 min lauter rest, employing four sparging steps of 5
L hot brewing water each. Boil volume was 50 L at a gravity of 1.030 (7.0◦P), and total boiling time
Fermentation2019,5, 103 6 of 24
a calculated IBU content of 9. After boiling, gravity was readjusted to 1.030 (7.0◦P) with hot brewing water, and hot trub precipitates and hop residue were removed in the whirlpool with a rest of 20 min. Clear wort was pumped through a heat exchanger and filled into 60 L cylindroconical fermentation vessels at a temperature of 17◦C.
2.7.2. Propagation, Fermentation and Aftercare
A first propagation step was employed as described in 2.4.1. A second propagation step was performed by transferring the small-scale propagated wort into a 5 L carboy filled with 2 L of sterile wort extract at 7◦
P and closed with sterile cotton. The second propagation step was conducted for
24 h under constant agitation at ambient temperature (20±2◦C).
Yeast was pitched into the fermenter at a pitching rate of 107cells/mL. Fermentation was carried out in cylindroconical fermentation vessels with a capacity of 60 L, at ambient pressure and at a
glycol-controlled fermentation temperature of 17◦
C. Samples were withdrawn every day. Fermentation was carried out until no change in extract could be measured for two consecutive days. The beer
was then filled into a 50 L keg and carbonated by repeated pressurization with CO2to 1 bar at 2◦C.
After 5 days, the carbonated beer was filled into 330 mL brown glass bottles with a counter-pressure hand-filler (TOPINCN, Shenzen, China) and capped. Bottles were pasteurized in a pilot retort (APR-95;
Surdry, Abadiano, Vizcaya, Spain) with spray water at 65◦C for 10 min resulting in approximately 23
pasteurization units (PU). The successful pasteurization was confirmed by plating the pasteurized
NAB on agar plates. Beer bottles were stored at 2 ◦C in a dark place for further analysis and
sensory evaluation.
2.8. Sensory Evaluation
The sensory evaluation of the samples produced during yeast screening and RSM trial were judged
by a panel of 12–15 experienced tasters. Samples were given at ambient temperature (20◦C) with a
three-digit code. Each panelist evaluated the samples in an individual booth at ambient temperature (20◦
C). The tasters were asked to desribe the sample in their own words, followed by evaluation of the intensity of a fruity smell and the overall acceptance of the smell of the sample on a hedonic scale from
0 (“not fruity”/”dislike extremely”) to 5 (“extremely fruity”/”like extremely”) according to MEBAK
Sensory Analysis 3.2.1 “Simple Descriptive Test” and 3.2.2 “Profile Test”, respectively.
The non-alcoholic beer samples (C6.1 pilot scale and commercial samples) were tasted and judged by a sensory panel of ten experienced and certified (DLG International Certificate for Sensory Analysis—beer and beer-based mixed drinks; Deutsche Landwirtschafts-Gesellschaft e.V.) panelists. A “Simple Descriptive Test” and “Profile Test” were performed according to MEBAK Sensory Analysis 3.2.1 and 3.2.2, respectively. Attributes for the aroma were “wort-like”, “floral”, “fruity”, “citrus-like” and “tropical”. A taste attribute “sweet taste” was also included. Panelists were asked to evaluate the attributes in their intensity on a line-marking scale from 0, “not perceptible”, to 5, “strongly perceptible”. Before the evaluation of the intensity, a descriptive sensory was performed, where the panelists were asked to describe the aroma of the samples in their own words. Samples were provided
in dark glasses with a three-digit code and evaluated at a temperature of 20◦C in order to evaluate
the full flavor profile (following DLG guidelines). The commercial samples NAB A and NAB B were non-alcoholic beers produced by limited fermentation [29] and “dialysis technology” [30], respectively.
Each panelist tasted the samples in an individual booth at ambient temperature (20◦C). The amount of
sample tasted was 50 mL per sample.
2.9. Wort and Beer Analyses
2.9.1. HPLC Analyses
Sugars and ethanol were determined by HPLC Agilent 1260 Infinity (Agilent Technologies,
6.5 mm×300 mm column (Waters, Milford MA, USA), with 50 mg/L Ca-EDTA as mobile phase and a flow rate of 0.5 mL/min at 80◦C. Differentiation of maltose and sucrose was achieved with a Nova-Pak
4µm, 4.6 mm×250 mm column (Waters, Milford MA, USA), with acetonitrile/water 78:22 (v/v) as
mobile phase and a flow rate of 1.0 mL/min. Quantification was achieved by external standards in a
calibration range of 0.5 to 30 mM.
2.9.2. GC Analyses
Free vicinal diketones were quantified by a Clarus 500 gas chromatograph (Perkin-Elmer, Waltham
MA, USA) with a headspace unit and Elite-5 60 m×0.25 mm, 0.5µm column using a 2,3-hexandione
internal standard. Fermentation by products (esters, higher alcohols) was quantified using a Clarus 580 (Perkin-Elmer, Waltham MA, USA) gas chromatograph with a headspace unit and INNOWAX
cross-linked polyethylene-glycol 60 m×0.32 mm, 0.5µm column (Perkin-Elmer, Waltham MA, USA).
Vials containing beer samples were equilibrated for 25 min at 60◦
C. The samples were injected at 50◦C, rising to 85◦C after one minute by heating at 7◦C/min. A temperature of 85◦C was maintained for one minute and then elevated to 190◦C at a heating rate of 25◦C/min.
2.9.3. Other
Glycerol was determined via enzymatic assay kit (glucokinase method), following the recommended procedure (K-GCROLGK, Megazyme, Bray Co. Wicklow, Ireland). The method
is based on the use of ADP-glucokinase and an increase in absorbance on conversion of NAD+to
NADH, and is performed at ambient temperature at a sample volume of 2 mL.
Free amino nitrogen (FAN) was measured using a ninhydrin-based dying method, where absorbance is measured at 570 nm against a glycine standard (ASBC Method Wort-12 A). The method is
performed at a total volume of 10 mL. Following the color reaction at 95◦C, the samples are measured
at ambient temperature.
Extract (apparent and real) and ethanol (for fermentation monitoring) were analyzed via density
meter DMA 4500M with Alcolyzer Beer ME (Anton-Paar GmbH, Graz, Austria) at 20◦
C and a sample volume of 30 mL.
The pH was determined using a digital pH meter (Mettler Toledo LLC, Columbus, OH, USA).
2.10. Statistical Analyses
Screening fermentations and analyses were carried out in triplicate. Statistical analysis was performed using RStudio, Version 1.1.463 with R version 3.5.2 (RStudio Inc, Boston, MA, USA; R Core Team, r-project). One-way analysis of variance (ANOVA) was used to compare means, and Tukey’s post hoc test with 95% confidence intervals was applied for the pairwise comparison of means. When available, values are given as the mean±standard deviation. Statistical analyses during the RSM trials were performed using the DesignExpert 9 software (StatEase, Minneapolis, MN, USA).
3. Results and Discussion
3.1. Yeast Strain Characterization
To identify the species of the yeast strains, amplification of the D1/D2 domain via PCR was
performed and sequenced. The obtained sequences were compared to publicly available sequences in
Fermentation2019,5, 103 8 of 24
Table 3.Yeast strain designation, species and origin of yeast strains used in this study.
Strain
Designation Species Origin Yeast Bank
837A Cyberlindnera
misumaiensis Brewery cellar FZW BLQ1, Weihenstephan, Germany NT Cyb Cyberlindnera fabianii Dried yeast starter for rice wine FZW BLQ1, Weihenstephan, Germany
L1 Cyberlindnera jadinii Fruit ofSolanum quitoense, “Lulo” UCC Culture Collection, Cork, Ireland C6.1 Cyberlindnera subsufficiens Coconut UCC Culture Collection, Cork, Ireland CBS 1707T Cyberlindnera mrakii Soil Westerdijk Fungal Biodiversity Institute,
Utrecht, Netherlands
CBS 5763T Cyberlindnera subsufficiens Soil Westerdijk Fungal Biodiversity Institute, Utrecht, Netherlands
1Research Centre Weihenstephan for Brewing and Food Quality, Technische Universität München;TType strain.
The yeast strains were found to belong to the speciesCyberlindnera misumaiensis(837A),C. fabianii
(NT Cyb),C. jadinii (L1), andC. subsufficiens(C6.1). TheCyberlindnera mrakiitype strain CBS 1707
(formerWilliopsis saturnusvar. mrakii; synonym NCYC 500) was included in this study as a strain that
has previously been investigated for the production of a low alcohol beer with high levels of esters [20]. TheCyberlindnera subsufficienstype strain CBS 5763 was included as an example to investigate potential intraspecific differences from C6.1.
3.2. API Substrate Utilization
Before considering non-conventional yeasts for NABLAB brewing, their behavior regarding utilization of important wort sugars like maltose and sucrose should be investigated. An API ID 32C test was performed to investigate the utilization of those sugars and to show general, interspecific differences between the strains. The results of the API test are shown in Table4.
Table 4.Results of the API ID 32C substrate utilization test of the individual strains. Substrates without brewing relevance, which were negative for all strains, are not shown. “+” positive, “−“ negative,
“w” weak.
Substrate 837A NT
Cyb L1 C6.1
CBS 1707
CBS 5763
Cycloheximide (Actidione) + − − − − −
D-Cellobiose + + + + + +
D-Galactose − − w − − −
D-Glucose + + + + + +
D-Maltose − + + − +1 −1
D-Mannitol + + w w w w
D-Melibiose − − − − − −
D-Melezitose − + + − + −
D-Raffinose − + + + + +
D-Sorbitol + + w + − −
D-Sucrose − + + + − +
D-Trehalose − + − − + −
D-Xylose − + + + + +
Esculin Ferric Acid + + + + + +
Glucosamine − − − w − −
Glycerol + + + + + +
Lactic Acid − + + + + +
Levulinic Acid − w w w w +
L-Sorbose − − − − − +
Methyl-αD-Glucopyranoside − + − − − −
N-Acetyl-Glucosamine − − w − w −
Palatinose − + + − + −
Potassium Gluconate w w − + w +
Maltose utilization was positive for NT Cyb, L1 and CBS 1707, in accordance with the reported
literature, although assimilation of maltose by CBS 1707 is classified as “variable” [31]. Sucrose
utilization was positive for four of the six strains and negative for 837A and CBS1707. The results suggest that in brewers’ wort, where maltose is the most abundant fermentable sugar, only NT Cyb, L1 and CBS 1707 have the capability to achieve high attenuations. However, the API test investigates substrate utilization under aerobic conditions. Sugar consumption during fermentation, under anaerobic conditions, can differ significantly [31], which is also known as the Kluyver effect [32]. Due to the inability of 837A and CBS 1707 to utilize sucrose, lower attenuations in fermentations in wort could be expected.
3.3. Stress Tests
When considering non-Saccharomycesyeast strains for brewing purposes, several brewing-relevant
parameters such as flocculation behavior, POF production and stress responses should be
investigated [33]. The flocculation behavior can give initial indications regarding yeast handling in
terms of potential bottom cropping. POF behavior is important because in most beer styles, POF is not
desired. Substances like hop-derived iso-α-acids, ethanol content, or the pH value of the wort can
have significant influences on yeast activity, manifesting mainly in a prolonged lag time, and even complete growth inhibition [33–35]. With the investigated yeast strains, iso-α-acid concentrations of
up to 100 IBU had no significant effect on the yeast growth (data not shown), which is in accordance
with previous reports on seven different non-Saccharomycesspecies [34,35]. However, Michel et al. [33] reported a minor prolongation in the lag time ofTorulaspora delbrueckiistrains in concentrations of up to 90 IBU. The results of the investigated characterization attributes are shown in Table5.
Table 5.Characterization of yeast strains for flocculation behavior, phenolic off-flavor (POF) production and lag time in wort with and without a stressor at different concentrations. “—“ no growth.
Characterization
Attributes Unit 837A NT Cyb L1 C6.1
CBS 1707
CBS 5763
Flocculation % 78±3 22±2 35±4 32±1 85±2 51±4
POF - negative negative negative negative negative negative
Ethanol
0% ABV h 18 6 9 6 9 9
2.5% ABV h 120 12 18 18 12 18
5% ABV h — 24 36 24 48 —
7.5% ABV h — 42 — — 126 —
pH
5.5 h 18 6 9 6 9 9
5 h 18 6 9 6 9 9
4 h 66 6 9 6 9 9
3 h — 12 24 18 78 42
CBS 1707 exhibited the strongest flocculation behavior, at 85%, followed by 837A and CBS 5763, at 78% and 51%, respectively. NT Cyb, L1 and C6.1 exhibited very low flocculation of below 35%. All strains were negative for POF behavior. NT Cyb and C6.1 exhibited the fastest growth in wort (without a stress factor), overcoming the lag time after only 6 hours, followed by L1 and the CBS strains after 9 hours. Strain 837A exhibited a long lag phase of 18 hours (Figure1). Concentrations of 2.5% ABV ethanol in the wort affected the lag time of all investigated strains. 837A was especially susceptible, with a prolonged lag phase of 120 hours. The remainder of the strains showed an extension of the lag phase of 3 to 12 hours. At 5% ABV, growth was fully inhibited for 837A and CBS 5763, while the other strains again exhibited an extension of the lag phase, of up to a maximum of 48 hours in CBS 1707. Complete growth inhibition was observed for L1 and C6.1 at 7.5% ABV, while the lag phase of NT Cyb and CBS 1707 was prolonged to 42 and 126 hours, respectively. All strains except 837A, which showed
a significant extension of the lag phase to 66 hours, remained unaffected by a lower pH of 4. Only at
Fermentation2019,5, 103 10 of 24
considering the yeast for sour beer production, where the yeast must withstand pH values of below
4 [36]. However, it has been shown that organic acids like lactic acid can have a stronger inhibitory
effect on yeasts and other microorganisms than HCl, which is caused by its chemical properties as a
weak acid [35,37]. Inhibition by lactic acid could therefore be more pronounced than the HCl inhibition
observed in this study. Figure1shows the growth of the investigated yeast strains in wort without the
addition of a stressor.
Fermentation 2019, 5, x FOR PEER REVIEW 10 of 25
extension of the lag phase of 3 to 12 hours. At 5% ABV, growth was fully inhibited for 837A and CBS 5763, while the other strains again exhibited an extension of the lag phase, of up to a maximum of 48 hours in CBS 1707. Complete growth inhibition was observed for L1 and C6.1 at 7.5% ABV, while the lag phase of NT Cyb and CBS 1707 was prolonged to 42 and 126 hours, respectively. All strains except 837A, which showed a significant extension of the lag phase to 66 hours, remained unaffected by a lower pH of 4. Only at pH 3 were lag times affected, while 837A was fully inhibited. Growth at low pH is important when considering the yeast for sour beer production, where the yeast must withstand pH values of below 4 [36]. However, it has been shown that organic acids like lactic acid can have a stronger inhibitory effect on yeasts and other microorganisms than HCl, which is caused by its chemical properties as a weak acid [35,37]. Inhibition by lactic acid could therefore be more pronounced than the HCl inhibition observed in this study. Figure 1 shows the growth of the investigated yeast strains in wort without the addition of a stressor.
Figure 1. Growth of yeast strains in 7 °P wort extract at 25 °C without a stressor. Growth curves shown are the mean of a triplicate.
3.4. Screening
To investigate interspecific differences in the fermentation of wort, fermentation trials were performed in a diluted wort extract of 7 °P. Previous studies have shown that extract contents of around 7 °P will yield ethanol concentrations of around 0.5% ABV, a popular legal limit for NAB [7], in fermentations with maltose-negative yeast strains [1,14,34,38]. After aerobic propagation for 24 hours, NT Cyb exhibited the highest number of cells, at 2 × 10⁹ cells/mL, more than four-fold the amount of cells compared to L1, C6.1, and the CBS strains with counts between 3.4 and 4.9 × 10⁸ cells/mL (Table 6). Due to a delayed growth (compare Figure 1), 837A had to be propagated for 48 hours, reaching a cell count of 6.1 × 10⁸ cells/mL. For the screening in wort, yeast cells were added at a concentration of 3 × 10⁷ cells/mL, after a gentle washing step in water to prevent carry-over of propagation wort sugars. The results from the yeast screening are shown in Table 6. The fermentations were carried out until no change in extract could be measured for two consecutive days.
Figure 1.Growth of yeast strains in 7◦P wort extract at 25◦C without a stressor. Growth curves shown are the mean of a triplicate.
3.4. Screening
To investigate interspecific differences in the fermentation of wort, fermentation trials were
performed in a diluted wort extract of 7◦P. Previous studies have shown that extract contents of
around 7◦P will yield ethanol concentrations of around 0.5% ABV, a popular legal limit for NAB [7], in fermentations with maltose-negative yeast strains [1,14,34,38]. After aerobic propagation for 24 hours,
NT Cyb exhibited the highest number of cells, at 2×10⁹cells/mL, more than four-fold the amount of
cells compared to L1, C6.1, and the CBS strains with counts between 3.4 and 4.9×10⁸cells/mL (Table6).
Due to a delayed growth (compare Figure1), 837A had to be propagated for 48 hours, reaching a cell
count of 6.1×10⁸cells/mL. For the screening in wort, yeast cells were added at a concentration of 3×
107cells/mL, after a gentle washing step in water to prevent carry-over of propagation wort sugars.
The results from the yeast screening are shown in Table6. The fermentations were carried out until no
Table 6.Results of the screening of the investigatedCyberlindnerastrains in wort extract.
Non-Alcoholic Beer (NAB) Attributes Unit 837A NT Cyb L1 C6.1 CBS 1707 CBS 5763
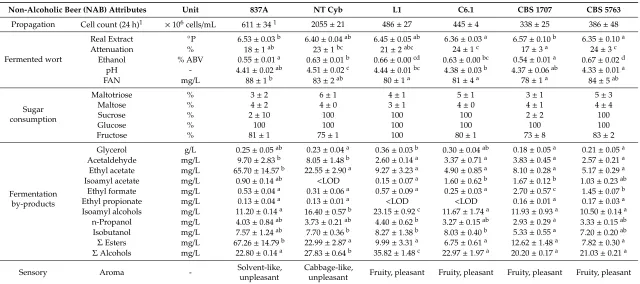
Propagation Cell count (24 h)1 ×10⁶cells/mL 611±341 2055±21 486±27 445±4 338±25 386±48
Fermented wort
Real Extract ◦P 6.53±0.03b 6.40±0.04ab 6.45±0.05ab 6.36±0.03a 6.57±0.10b 6.35±0.10a
Attenuation % 18±1ab 23±1bc 21±2abc 24±1c 17±3a 24±3c
Ethanol % ABV 0.55±0.01a 0.63±0.01b 0.66±0.00cd 0.63±0.00bc 0.54±0.01a 0.67±0.02d pH - 4.41±0.02ab 4.51±0.02c 4.44±0.01bc 4.38±0.03b 4.37±0.06ab 4.33±0.01a
FAN mg/L 88±1b 83±2ab 80±1a 81±4a 78±1a 84±5ab
Sugar consumption
Maltotriose % 3±2 6±1 4±1 5±1 3±1 5±3
Maltose % 4±2 4±0 3±1 4±0 4±1 4±4
Sucrose % 2±10 100 100 100 2±2 100
Glucose % 100 100 100 100 100 100
Fructose % 81±1 75±1 100 80±1 73±8 83±2
Fermentation by-products
Glycerol g/L 0.25±0.05ab 0.23±0.04a 0.36±0.03b 0.30±0.04ab 0.18±0.05a 0.21±0.05a Acetaldehyde mg/L 9.70±2.83b 8.05±1.48b 2.60±0.14a 3.37±0.71a 3.83±0.45a 2.57±0.21a Ethyl acetate mg/L 65.70±14.57b 22.55±2.90a 9.27±3.23a 4.90±0.85a 8.10±0.28a 5.17±0.29a Isoamyl acetate mg/L 0.90±0.14ab <LOD 0.15±0.07a 1.60±0.62b 1.67±0.12b 1.03±0.23ab
Ethyl formate mg/L 0.53±0.04a 0.31±0.06a 0.57±0.09a 0.25±0.03a 2.70±0.57c 1.45±0.07b Ethyl propionate mg/L 0.13±0.04a 0.13±0.01a <LOD <LOD 0.16±0.01a 0.17±0.03a Isoamyl alcohols mg/L 11.20±0.14a 16.40±0.57b 23.15±0.92c 11.67±1.74a 11.93±0.93a 10.50±0.14a
n-Propanol mg/L 4.03±0.84ab 3.73±0.21ab 4.40±0.62b 3.27±0.15ab 2.93±0.29a 3.33±0.15ab Isobutanol mg/L 7.57±1.24ab 7.70±0.36b 8.27±1.38b 8.03±0.40b 5.33±0.55a 7.20±0.20ab ΣEsters mg/L 67.26±14.79b 22.99±2.87a 9.99±3.31a 6.75±0.61a 12.62±1.48a 7.82±0.30a
ΣAlcohols mg/L 22.80±0.14a 27.83±0.64b 35.82±1.48c 22.97±1.97a 20.20±0.17a 21.03±0.21a
Sensory Aroma - Solvent-like,
unpleasant
Cabbage-like,
unpleasant Fruity, pleasant Fruity, pleasant Fruity, pleasant Fruity, pleasant 1Cell count after 48 h due to delayed growth compared to other strains (compare Figure1). LOD ‘limit of detection’. Different superscripts of values within a row indicate a significant
Fermentation2019,5, 103 12 of 24
Strains 837A and CBS 1707 exhibited the lowest attenuation of only 18% and 17%, respectively,
owing to their inability to utilize sucrose (Table4), which was confirmed by the lack of sucrose
consumption. Liu and Quek [20] also reported the absence of sucrose utilization by CBS 1707. The other strains, which depleted sucrose completely, reached attenuations of 21% to 24%. Consequently, 837A
and CBS 1707 also produced, at 0.55% and 0.56% ABV, the lowest amounts of ethanol (p≤0.05)
compared to the remaining strains, where ethanol concentrations ranged from 0.63% to 0.67% ABV. The final pH of the fermented samples ranged from 4.33 (CBS 5763) to 4.51 (NT Cyb). Residual FAN
ranged from 78 (CBS 1707) to 88 mg/L (837A). As expected, none of the strains consumed maltotriose.
Maltose consumption was also neglectable in all strains, although the speciesCyberlindnera fabianii(like
NT Cyb) has been reported to be able to ferment maltose [31,39]. The observations also underlined
that results from the API substrate utilization test (where NT Cyb, L1 and CBS 1707 were positive for maltose) are not necessarily reflected in practice, especially since sugar utilization during respiration and fermentation can differ [31,32,40]. While glucose was depleted by all strains, fructose was only fully depleted by L1. The remaining strains exhibited glucophilic behavior and consumed only 73% to 83% of fructose during fermentation. Regarding fermentation by-products, glycerol concentrations
were low, ranging from 0.18 to 0.36 g/L. The strains 837A and NT Cyb accumulated significantly
higher amounts of acetaldehyde, at 9.7 and 8.1 mg/L, respectively, compared to 2.6 to 3.8 mg/L in the
remaining samples. The sample fermented withCyberlindnera misumaiensis837A exhibited extremely
high values of ethyl acetate, at 65.7 mg/L, twice the flavor threshold concentration in beer [2,41]. Ethyl acetate is described to have a fruity, estery character but also solvent-like, especially in high concentrations. The remaining strains exhibited ethyl acetate production between 4.9 (C6.1) and 22.6
mg/L (NT Cyb). Isoamyl acetate, which is predominantly described as having a fruity, banana-like
aroma, has a much lower flavor threshold of only 1.4–1.6 mg/L [2,41]. The strains C6.1 and CBS 1707
produced the highest amounts of isoamyl acetate, at 1.67 and 1.60 mg/L, followed by CBS 5763, 837A
and L1, at 1.03, 0.90 and 0.15 mg/L, respectively. NT Cyb did not produce detectable amounts of
isoamyl acetate. Concentrations of ethyl formate and ethyl propionate in the fermented samples were
low, ranging from undetectable to 2.7 mg/L. Ethyl butyrate and ethyl caproate were not detected in
either of the samples (data not shown). The strain L1 produced a significantly higher amount of higher alcohols, at 35.8 mg/L, followed by NT Cyb, at 27.8 mg/L, and the remaining strains at 20–23 mg/L. During sensory evaluation, the high ethyl acetate concentration in the sample fermented with 837A was indeed perceptible and described as an unpleasant, solvent-like aroma. The sample fermented with NT Cyb was described as having an unpleasant, cabbage-like aroma. The remaining samples were characterized by a pleasant, fruity aroma.
The unpleasant, solvent-like aroma in the sample fermented with 837A was attributed to the very high ethyl acetate concentration, well above the flavor threshold. However, the cabbage-like
aroma, which is generally associated with sulfides or thiol compounds [41], that was detected in the
sample fermented with NT Cyb could not be linked to the volatile by-products that were measured. Interestingly, ethyl acetate concentrations in the remaining samples, characterized by a pleasant, fruity
aroma, were low, at only 2.6–3.8 mg/L. However, C6.1, CBS 1707 and CBS 5763 exhibited higher amounts
of isoamyl acetate, a desired ester in beer (particularly ales) [42], when compared to the samples with
unpleasant aroma. The concentrations of 1.0–1.6 mg/L are within the reported flavor threshold in beer
of 0.5–2.0 mg/L [43]. Additionally, it is well known that synergistic effects between esters occur that can push the concentration of perception below their individual flavor thresholds [42,44,45]. Isoamyl acetate could therefore have been a cause of the fruity aroma in the samples fermented with C6.1, CBS 1707 and CBS 5763. However, the sample fermented with L1, which was also characterized by a
fruity aroma, only contained a very low isoamyl acetate concentration of 0.15 mg/L. It is noteworthy,
however, that the L1 sample contained a significantly higher amount of isoamyl alcohol, at 23.2 mg/L,
Based on the results from the screening,Cyberlindnera subsufficiensC6.1 was chosen for optimization of fermentation conditions by means of response surface methodology, followed by an up-scaled brewing trial at 60 L to create a fruity, non-alcoholic beer (≤0.5% ABV). Strains 837A and NT Cyb were eliminated because of their poor flavor characteristics. CBS 1707 was eliminated due to its inability to ferment sucrose, which apart from the lower attenuation, would remain in the wort after fermentation,
acting as an additional sweetening agent and potential contamination risk.Cyberlindnera jadiniistrain
L1 was eliminated due to its very low isoamyl acetate production (Table6) and due to its maltose
utilization when oxygen was present (Table4). The decision between the two similarly performing
Cyberlindnera subsufficiensstrains C6.1 and CBS 5763 was made in favor of C6.1 due to a more pleasant fruitiness. In addition, C6.1 showed increased tolerance towards stress caused by ethanol or low pH (Table5).
3.5. Response Surface Methodology (RSM)
To find the optimal fermentation conditions for C6.1 for an up-scaled application to produce
a fruity, non-alcoholic beer, RSM was performed. Michel et al. [46] applied RSM to optimize the
fermentation conditions of aTorulaspora delbrueckiistrain for brewing purposes. They found that the
pitching rate and fermentation temperature were crucial parameters, which influenced the flavor
character of the final beer. The optimal fermentation conditions were shown to be at 21◦C with a high
pitching rate of 60×106cells/mL. Especially for non-Saccharomycesyeasts, the pitching rate can be
crucial since most non-Saccharomycesspecies have comparably smaller cell sizes [46]. Figure2shows
an example of the differing cell size betweenCyberlindnera subsufficiensstrain C6.1 (A) and the brewers’
yeast strainSaccharomyces cerevisiaeWLP001 (B) at identical magnification.
Fermentation 2019, 5, x FOR PEER REVIEW 14 of 25
Based on the results from the screening, Cyberlindnera subsufficiens C6.1 was chosen for optimization of fermentation conditions by means of response surface methodology, followed by an up-scaled brewing trial at 60 L to create a fruity, non-alcoholic beer (≤0.5% ABV). Strains 837A and NT Cyb were eliminated because of their poor flavor characteristics. CBS 1707 was eliminated due to its inability to ferment sucrose, which apart from the lower attenuation, would remain in the wort after fermentation, acting as an additional sweetening agent and potential contamination risk.
Cyberlindnera jadinii strain L1 was eliminated due to its very low isoamyl acetate production (Table
6) and due to its maltose utilization when oxygen was present (Table 4). The decision between the two similarly performing Cyberlindnera subsufficiens strains C6.1 and CBS 5763 was made in favor of C6.1 due to a more pleasant fruitiness. In addition, C6.1 showed increased tolerance towards stress caused by ethanol or low pH (Table 5).
3.5. Response Surface Methodology (RSM)
To find the optimal fermentation conditions for C6.1 for an up-scaled application to produce a fruity, non-alcoholic beer, RSM was perform
Figure 2. Scanning electron microscopy (SEM) picture of Cyberlindnera subsufficiens strain C6.1 (A) and the brewers’ yeast strain Saccharomyces cerevisiae WLP001 (B) at a magnification of × 3700. Size of bar: 5 µm.
It is also known that temperature and pitching rate have an influence on ester production, though strain-specific differences also play a role [4,6]. Previously reported fermentation temperatures of Cyberlindnera subsufficiens and other Cyberlindnera spp. range from 20 to 25 °C [12,17,19,20,47]. Consequently, a two-factorial, face-centered central composite design was chosen with Factor A: fermentation temperature (17, 22, 27 °C), and Factor B: pitching rate (10, 35, 60 × 106 cells/mL). The individual experiment runs are listed in Table 2. The wort extract applied in the RSM trial was the same as that used for the screening, at an extract content of 7 °P (Table 1). Fermentation was conducted until no change in extract could be measured for two consecutive days. With the measured response values, significant models could be produced. The significant response models, with their respective minima and maxima and a summary of the model statistics, are shown in Table 7. Insignificant response models are not shown, and response models with a significant lack of fit will not be discussed in this study but are included in the visualized data for the sake of a complete picture. For a full report on model statistics and response values, refer to the supplementary Data Sheet S1.
Figure 2.Scanning electron microscopy (SEM) picture ofCyberlindnera subsufficiensstrain C6.1 (A) and the brewers’ yeast strainSaccharomyces cerevisiaeWLP001 (B) at a magnification of×3700. Size of bar:
5µm.
It is also known that temperature and pitching rate have an influence on ester production, though strain-specific differences also play a role [4,6]. Previously reported fermentation temperatures ofCyberlindnera subsufficiensand other Cyberlindnera spp. range from 20 to 25◦C [12,17,19,20,47]. Consequently, a two-factorial, face-centered central composite design was chosen with Factor A: fermentation temperature (17, 22, 27◦C), and Factor B: pitching rate (10, 35, 60×106cells/mL). The individual experiment runs are listed in Table2. The wort extract applied in the RSM trial was the same as that used for the screening, at an extract content of 7◦P (Table1). Fermentation was conducted until no change in extract could be measured for two consecutive days. With the measured response values, significant models could be produced. The significant response models, with their respective minima
and maxima and a summary of the model statistics, are shown in Table7. Insignificant response
Fermentation2019,5, 103 14 of 24
study but are included in the visualized data for the sake of a complete picture. For a full report on model statistics and response values, refer to the supplementary Data Sheet S1.
Table 7.Analysis of variance (ANOVA) results for response models of the response surface methodology (RSM) trial.
Response Unit Minimum Maximum Model P-Value LOF
P-Value
Ethanol % ABV 0.41 0.60 RQuadratic 2.80×10⁻³** 0.648
Ethyl acetate mg/L 3.4 9.3 2FI 3.12×10−2* 0.007 **
Isoamyl acetate mg/L 0.8 2.2 RQuadratic 1.42×10−2* 0.046 *
Acetaldehyde mg/L 1.9 3.4 RLinear 1.35×10⁻³** 0.337
n-Propanol mg/L 3.2 4.5 2FI 9.03×10⁻³** 0.029 *
Isobutanol mg/L 3.2 6.7 RQuadratic 4.30×10⁻⁹*** 0.145
Isoamyl alcohols mg/L 7.3 13.3 Quadratic 2.67×10⁻⁵*** 0.270
ΣEsters mg/L 4.2 11.1 RQuadratic 1.48×10−2* 0.018 *
ΣAlcohols mg/L 13.7 22.9 RQuadratic 3.28×10⁻⁸*** 0.339
Glycerol g/L 0.17 0.37 RQuadratic 4.85×10⁻⁵*** 0.034 *
Acceptance - 1.08 3.38 Linear 1.31×10−2* 0.377
Fruitiness - 1.13 3.38 Linear 7.31×10⁻³** 0.484
Model terminology: “RQuadratic” Reduced Quadratic; “2FI” Two-Factor Interaction; “RLinear” Reduced Linear. “LOF” Lack of Fit. ANOVA significance codes: ***p≤0.001, **p≤0.01, *p≤0.05.
It was possible to create significant models for 12 responses (Table 7). However, five also
exhibited significant lack of fit (LOF), rendering them unusable for predictions. The aim of the RSM was to investigate the optimal fermentation conditions to create a fruity, non-alcoholic beer. The three-dimensional response surface plots of the interactive effects of temperature and pitching rate on
the final ethanol content and the fruitiness of the produced NAB are shown in Figures3and4.
Fermentation 2019, 5, x FOR PEER REVIEW 15 of 25
Table 7. Analysis of variance (ANOVA) results for response models of the response surface
methodology (RSM) trial.
Response Unit Minimum Maxim
um Model P-Value
LOF P -Value
Ethanol %
ABV 0.41 0.60
RQuadrati
c 2.80 × 10⁻³ ** 0.648
Ethyl acetate mg/
L 3.4 9.3 2FI 3.12 × 10
−2 * 0.007 **
Isoamyl acetate mg/
L 0.8 2.2
RQuadrati
c 1.42 × 10−2 * 0.046 *
Acetaldehyde mg/
L 1.9 3.4 RLinear 1.35 × 10⁻³ ** 0.337
n-Propanol mg/
L 3.2 4.5 2FI 9.03 × 10
−3 ** 0.029 *
Isobutanol mg/
L 3.2 6.7
RQuadrati
c 4.30 × 10⁻⁹ *** 0.145
Isoamyl alcohols mg/
L 7.3 13.3 Quadratic 2.67 × 10
−5 *** 0.270
Σ Esters mg/
L 4.2 11.1
RQuadrati
c 1.48 × 10−2 * 0.018 *
Σ Alcohols mg/
L 13.7 22.9
RQuadrati
c 3.28 × 10
−8 *** 0.339
Glycerol g/L 0.17 0.37 RQuadrati
c 4.85 × 10⁻⁵ *** 0.034 * Acceptance - 1.08 3.38 Linear 1.31 × 10−2 * 0.377
Fruitiness - 1.13 3.38 Linear 7.31 × 10⁻³ ** 0.484
Model terminology: “RQuadratic” Reduced Quadratic; “2FI” Two-Factor Interaction; “RLinear” Reduced Linear. “LOF” Lack of Fit. ANOVA significance codes: *** p≤ 0.001, ** p≤ 0.01, * p≤ 0.05.
It was possible to create significant models for 12 responses (Table 7). However, five also exhibited significant lack of fit (LOF), rendering them unusable for predictions. The aim of the RSM was to investigate the optimal fermentation conditions to create a fruity, non-alcoholic beer. The three-dimensional response surface plots of the interactive effects of temperature and pitching rate on the final ethanol content and the fruitiness of the produced NAB are shown in Figures 3 and 4.
Fermentation2019,5, 103 15 of 24
Figure 3. Three-dimensional response surface plot of the interactive effects of temperature and pitching rate on the ethanol content of the produced non-alcoholic beer (p < 0.01).
Figure 4. Three-dimensional response surface plot of the effects of temperature and pitching rate on the fruitiness of the produced non-alcoholic beer (p < 0.01).
Ethanol content was lowest at a low temperature of 17 °C and low pitching rate (107 cells/mL), and it went up with increasing temperature and pitching rate, but lowered again at a high pitching rate combined with a high fermentation temperature (Figure 3). The minium and maximum values were 0.41% and 0.60% ABV. Sugar analysis revealed that at 17 °C and 107 cells/mL, about 0.5 g/L of glucose was remaining after fermentation, while it was fully depleted in worts fermented at higher pitching rates and higher temperatures (data not shown). The residual sugar explained the lower final ethanol concentration. Fructose was only fully depleted in the samples that were fermented at 27 °C. At 22 °C, fermented samples exhibited residual fructose concentrations between 0.2 and 0.5 g/L, and at 17 °C, fermented samples showed remaining fructose concentrations between 0.2 and 0.7 g/L. Acetaldehyde concentrations were only dependent on the pitching rate, with increasing amounts of acetaldehyde found at lower pitching rates (Figure A1). This result correlates with other studies that found a decrease in acetaldehyde with increasing pitching rate in wort fermentations with brewers’ yeasts [48,49]. However, overdosing yeast (>5 × 10⁷ cells/mL) can lead to an increase in acetaldehyde again, as observed by Erten et al. [50]. The temperature did not have a significant effect on the acetaldehyde concentration and was therefore excluded from the model (p = 0.39; supplementary Data Sheet S1). However, regarding higher alcohols, the fermentation temperature had a stronger effect, with increasing amounts of higher alcohols found at higher temperatures (Figure 5 and Figure A2), which is consistent with the literature [4,5]. Isoamyl acetate concentrations were generally high and ranged from 0.8 to 2.2 mg/L. Although the model was significant (p < 0.05), it was unsuitable for value prediction due to a significant lack of fit (p = 0.046).
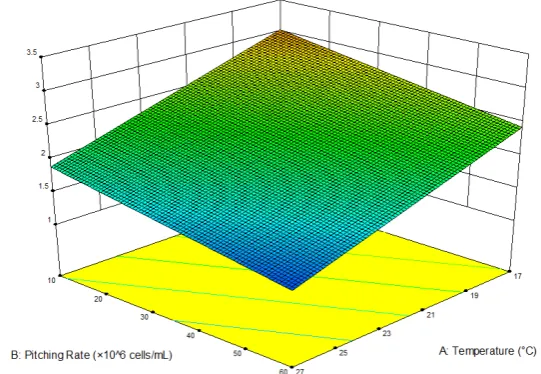
Figure 4.Three-dimensional response surface plot of the effects of temperature and pitching rate on the fruitiness of the produced non-alcoholic beer (p<0.01).
Ethanol content was lowest at a low temperature of 17◦C and low pitching rate (107cells/mL),
and it went up with increasing temperature and pitching rate, but lowered again at a high pitching
rate combined with a high fermentation temperature (Figure3). The minium and maximum values
were 0.41% and 0.60% ABV. Sugar analysis revealed that at 17◦
C and 107cells/mL, about 0.5 g/L of glucose was remaining after fermentation, while it was fully depleted in worts fermented at higher pitching rates and higher temperatures (data not shown). The residual sugar explained the lower final ethanol concentration. Fructose was only fully depleted in the samples that were fermented at 27◦C. At 22◦C, fermented samples exhibited residual fructose concentrations between 0.2 and 0.5 g/L,
and at 17◦C, fermented samples showed remaining fructose concentrations between 0.2 and 0.7 g/L.
Acetaldehyde concentrations were only dependent on the pitching rate, with increasing amounts of
acetaldehyde found at lower pitching rates (FigureA1). This result correlates with other studies that
found a decrease in acetaldehyde with increasing pitching rate in wort fermentations with brewers’ yeasts [48,49]. However, overdosing yeast (>5×10⁷cells/mL) can lead to an increase in acetaldehyde
again, as observed by Erten et al. [50]. The temperature did not have a significant effect on the
acetaldehyde concentration and was therefore excluded from the model (p=0.39; supplementary
Data Sheet S1). However, regarding higher alcohols, the fermentation temperature had a stronger
effect, with increasing amounts of higher alcohols found at higher temperatures (Figures5andA2),
which is consistent with the literature [4,5]. Isoamyl acetate concentrations were generally high and ranged from 0.8 to 2.2 mg/L. Although the model was significant (p<0.05), it was unsuitable for value prediction due to a significant lack of fit (p=0.046).
Interestingly, the production of the esters ethyl acetate and isoamyl acetate did not show a clear correlation to temperature, which underlines that the general rule of thumb, that higher fermentation
temperatures lead to increased ester production, is not valid for all yeast strains (Figure 5) [4].
Furthermore, the amount of esters that were quantified in this study did not correlate with the perceived fruitiness of the NAB, which tentatively suggests that the fruity flavor profile was caused by
Fermentation2019,5, 103 16 of 24
Fermentation 2019, 5, x FOR PEER REVIEW 17 of 25
Figure 5. Map visualizing correlations of response surface methodology (RSM) factors and responses based on the Pearson Correlation Coefficient. 1 signifies strong positive correlation, 0 signifies no correlation, and −1 signifies a strong negative correlation.
Interestingly, the production of the esters ethyl acetate and isoamyl acetate did not show a clear
correlation to temperature, which underlines that the general rule of thumb, that higher fermentation
temperatures lead to increased ester production, is not valid for all yeast strains (Figure 5) [4].
Furthermore, the amount of esters that were quantified in this study did not correlate with the
perceived fruitiness of the NAB, which tentatively suggests that the fruity flavor profile was caused
by yet unidentified compounds (Figure 5).
In terms of fruitiness, a low fermentation temperature paired with a low pitching rate led to the
highest perceived fruitiness. Indeed, the highest fruitiness was recorded at 17 °C and 1 × 10
7cells/mL
and the lowest at 27 °C and 6 × 10
7cells/mL, following a linear model. General acceptance showed a
strong positive correlation with the fruitiness, indicating that the panel preferred fruity samples
(Figure 5 and Figure A3).
Due to the ideal combination of lowest ethanol content and highest fruitiness and acceptance,
the fermentation temperature of 17 °C and pitching rate of 1 × 10
7cells/mL were chosen as the optimal
fermentation conditions for application to produce a fruity, non-alcoholic beer.
A small-scale fermentation at the optimal conditions (17 °C, 10
7cells/mL) was conducted to
validate the RSM model. Table 8 shows the predicted mean including 95% prediction intervals (PI)
and the measured (“observed”) mean with standard deviation.
Figure 5.Map visualizing correlations of response surface methodology (RSM) factors and responses based on the Pearson Correlation Coefficient. 1 signifies strong positive correlation, 0 signifies no correlation, and−1 signifies a strong negative correlation.
In terms of fruitiness, a low fermentation temperature paired with a low pitching rate led to the highest perceived fruitiness. Indeed, the highest fruitiness was recorded at 17◦C and 1×10⁷cells/mL
and the lowest at 27◦C and 6×10⁷cells/mL, following a linear model. General acceptance showed
a strong positive correlation with the fruitiness, indicating that the panel preferred fruity samples (Figures5andA3).
Due to the ideal combination of lowest ethanol content and highest fruitiness and acceptance, the
fermentation temperature of 17◦C and pitching rate of 1×10⁷cells/mL were chosen as the optimal
fermentation conditions for application to produce a fruity, non-alcoholic beer.
A small-scale fermentation at the optimal conditions (17◦C, 107cells/mL) was conducted to
validate the RSM model. Table8shows the predicted mean including 95% prediction intervals (PI)
and the measured (“observed”) mean with standard deviation.
Although predicted by a significant model, the observed means for ethanol, acetaldehyde and isobutanol values were not within the 95% prediction interval. Sugar analysis revealed the complete depletion of glucose in the experimental fermentation trial at optimal conditions compared to the RSM model prediction, which explained the increased ethanol production (data not shown). The moderate success in model validation demonstrates the limitations in the application of RSM to optimize
fermentations, where small differences in substrate and process conditions can have significant
influences on the outcome. Because wort is a very complex substrate, comprising a complex mixture
transfer of the RSM results to other substrates (even different wort substrates) should be made with caution. In particular, a different sugar composition will have a significant effect on the responses when applying maltose-negative yeasts. However, the improved fruitiness and therefore higher acceptance of the NAB produced at low temperature and low pitching rate, the main goal from the optimization,
was significant and reproducable (Table8).
Table 8.Response surface methodology (RSM) model validation via predicted value vs. observed value.
Response 95% PI Low Predicted Mean 95% PI High Observed Mean Std. Dev.
Ethanol * 0.33 0.40 0.48 0.53 0.01
Ethyl acetate 0.89 4.74 8.60 6.83 0.59
Isoamyl acetate 0.78 1.63 2.47 2.50 0.10
Acetaldehyde * 2.19 2.97 3.74 1.27 0.29
n-Propanol 2.68 3.28 3.88 3.57 0.06
Isobutanol * 2.91 3.23 3.54 2.80 0.10
Isoamyl alcohols 5.78 7.03 8.29 4.10 0.10
SUM Esters 3.01 7.10 11.19 9.33 0.68
SUM Alcohols * 12.84 13.74 14.64 10.47 0.31
Glycerol 0.13 0.18 0.22 0.27 0.01
Acceptance * 2.12 3.23 4.34 3.75 0.62
Fruitiness * 2.02 3.03 4.05 3.58 0.87
* Significant model with insignificant lack of fit. ‘PI’ Prediction interval.
3.6. Pilot-Scale Brewing
Despite the limited model validation, the fermentation parameters were successfully optimized to enhance the fruity character of the NAB. Therefore, the pilot-scale brewing trial was conducted with the optimized conditions of 17◦C fermentation temperature and a pitching rate of 107cells/mL.
The grain bill of the wort for the pilot-scale brewing trial consisted of 95% pilsner malt and 5% acidulated malt to lower the starting pH of the wort, to account for the reduced pH drop during
fermentations with non-Saccharomycesyeasts compared to brewers’ yeast. A low beer pH is desired to
prevent microbial spoilage and to ensure good liveliness of the beer [51,52]. The analytical attributes of
the wort produced at pilot-scale are shown in Table9.
Table 9.Attributes of the wort produced on pilot-scale.
Wort attributes Unit Value
Extract ◦P 7.00±0.01
pH 4.86±0.01
FAN mg/L 107±3
Glucose g/L 6.01±0.08
Fructose g/L 0.80±0.01
Sucrose g/L 2.13±0.03
Maltose g/L 31.59±0.44
Maltotriose g/L 9.32±0.13
To assess the suitability of Cyberlindnera subsufficiens C6.1 to produce a fruity NAB, it was
compared to two commercial NABs. NAB A was a commercial non-alcoholic beer produced by limited fermentation [29], and NAB B was a non-alcoholic beer produced by “dialysis technology” [30]. The NABs were analyzed for their extract, ethanol, FAN and glycerol content as well as their sugar
Fermentation2019,5, 103 18 of 24
Table 10.Attributes of the non-alcoholic beer (NAB) produced with C6.1 compared to two commercial NABs, NAB A and NAB B.
NAB Attributes Unit C6.1 NAB NAB A NAB B
Extract (real) ◦P 6.60±0.01 6.76±0.07 7.05±0.03
Extract (apparent) ◦P 6.46±0.02 6.57±0.06 6.86±0.01
Ethanol % ABV 0.36±0.00 0.50±0.03 0.49±0.04
pH 4.45±0.01 4.29±0.02 4.29±0.04
FAN mg/L 96±2 86±6 24±0
Glycerol g/L 0.30±0.02 0.33±0.01 1.40±0.03
Glucose g/L 2.77±0.05 2.74±0.04 5.61±0.04
Fructose g/L 1.65±0.03 1.96±0.03 0.19±0.00
Sucrose g/L <LOD <LOD <LOD
Maltose g/L 30.27±0.62 30.11±0.50 17.69±0.24
Maltotriose g/L 8.67±0.24 8.31±0.21 1.84±0.03
Acetaldehyde mg/L 10.55 2.40 0.70
Ethyl acetate mg/L 12.00 <0.10 2.70
Isoamyl acetate mg/L 0.80 <0.1 0.70
Isoamyl alcohols mg/L 4.00 4.80 17.40
n-Propanol mg/L 2.20 <0.5 2.50
Isobutanol mg/L 3.60 1.00 4.90
Diacetyl mg/L <0.01 0.02 0.04
2,3-Pentandione mg/L <0.01 <0.01 <0.01
ΣEsters mg/L 12.8 <0.1 3.4
ΣAlcohols mg/L 9.8 5.8 24.8
The C6.1 NAB reached final attenuation after 13 days of fermentation at 17◦C, at an ethanol
content of 0.36% ABV. At the end of fermentation, 2.77 g/L glucose was remaining in the wort and
sucrose was fully depleted. Compared to the initial sugar concentration of the wort (Table9), fructose concentrations in the final beer were significantly higher, at 1.65 g/L, twice as high as the starting concentration in the wort. Since sucrose was fully depleted, it can be assumed that it was converted to glucose and fructose by the yeast’s invertase. The high residual fructose could therefore be attributed to the previously observed glucophilic character of the C6.1 strain in the screening and RSM trial. As a result, fructose was not consumed by the yeast due to the permanent presence of glucose until fermentation came to a halt. As expected, maltose and maltotriose consumption was negligible. Despite the limited fermentation, C6.1 produced a relatively high amount of esters, at 12.8 mg/L, the majority of which was ethyl acetate (12 mg/L). NAB A had an ethanol content of 0.50% ABV. Interestingly, the sugar composition was very similar to that of the C6.1 NAB. Regarding fermentation by-products, however, NAB A exhibited very low concentrations, at about half the amount of higher alcohols and a total lack of the esters ethyl acetate and isoamyl acetate. NAB B had an ethanol content of 0.49% ABV. Owing to its fundamentally different production method, the analyzed attributes were very different from those of the two NABs produced solely by limited fermentation. The low FAN content together with a high glycerol content compared to the other NABs were indicators of a more extensive fermentation, with subsequent removal of ethanol. However, NAB B still exhibited high amounts of monosaccharides, which suggested that the production of the NAB either also entailed a limited fermentation, or the dealcoholized beer was blended with wort (or other means of sugar addition). The increased amounts
of higher alcohols in NAB B, at 24.8 mg/L, are uncommon for beers dealcoholized via dialysis, since
the process commonly reduces their content in the final NAB by 90%–95% [7]. Despite the addition of
acid malt during the wort production for the C6.1 NAB, the final pH after fermentation was, at 4.45, higher compared to 4.29 in the commercial NABs.