Article
Temperature Self-Compensated Strain Sensors based
on MWCNT-Graphene Hybrid Nanocomposite
Rajarajan Ramalingame1,*, Jose Roberto Bautista-Quijano1 , Danrlei de Farias Alves2and Olfa Kanoun1
1 Measurements and Sensor Technology, Technical University of Chemnitz, 09126 Chemnitz, Germany;
roberto.bautista@etit.tu-chemnitz.de (J.R.B.-Q.); olfa.kanoun@etit.tu-chemnitz.de (O.K.)
2 Federal University of ABC, Campus Santo André, 09210-580 Santo André, Brazil; danrlei07@gmail.com
* Correspondence: rajarajan.ramalingame@etit.tu-chemnitz.de
Received: 21 June 2019; Accepted: 4 November 2019; Published: 7 November 2019
Abstract: Sensors based on carbon nanomaterials are gaining importance due to their tunable properties and their potentially outstanding sensing performance. Despite their advantages, carbon-based nanomaterial sensors are prone to cross-sensitivities with environmental factors like temperature. Thus, to reduce the temperature influence on the sensing material, compensation and correction procedures are usually considered. These methods may require the use of additional sensors which can themselves be subject to residual errors. Hence, a more promising approach consists of synthesizing a material that is capable of self-compensating for the influence of temperature. In this study, a hybrid nanocomposite based on multi-walled carbon nanotubes (MWCNT) and graphene is proposed, which can compensate, by itself, for the influence of temperature on the material conductivity. The hybrid nanocomposite material uses the different temperature behavior of MWCNTs, which have a negative temperature coefficient, and graphene, which has a positive temperature coefficient. The influence of the material ratio and dispersion quality are investigated in this work. Material composition and dispersion quality are analyzed using Raman spectroscopy and scanning electron microscopy (SEM). A composition of 70% graphene and 30% MWCNT exhibits a nearly temperature-independent hybrid nanocomposite with a sensitivity of 0.022Ω/◦C, corresponding to a resistance change of ~1.2 Ω for a temperature range of 25 to 80 ◦C. Additionally, a simple investigation of the strain sensing behavior of the hybrid material is also presented. The hybrid nanocomposite-based, thin-film strain sensor exhibits good stability over 100 cycles and a significantly high gauge factor, i.e., 16.21.
Keywords: temperature self-compensation; hybrid material; carbon nanotubes; graphene; nanocomposite; strain sensor
1. Introduction
Nanomaterials such as graphene and carbon nanotubes (CNT) have been shown to have potential applications in the field of material-based sensor development, due to their piezoresistive properties. Several studies have been carried out to develop strain sensors based on graphene [1–3] and CNT [4–8]. These sensors are flexible, precise, and exhibit good sensitivity to strain. The piezoresistive behavior of these materials is also influenced by environmental factors like temperature and humidity. It is important for a sensor to show temperature-independent behavior in order to have high sensitivity and accuracy for measurements of strain in a wide range of temperatures. Hence, the influence of temperature on these sensors needs to be taken into consideration in order to make them reliable, accurate, and precise.
J. Compos. Sci.2019,3, 96 2 of 14
Conventional metallic strain gauges with a gauge factor of 2.09 are also prone to the influence of temperature, and hence, are fabricated with a material that has a low-temperature coefficient of resistance, like constantan alloy [9]. To enhance the performance of the strain gauges, temperature compensation techniques like correction based on numerical methods [8] and neutral axis engineering [10], compensation by means of external circuits [9,11,12], or the development of a nanocomposite material with self-compensation properties [13] can be employed. It has been reported that a graphite-based strain sensor with temperature compensation based on external Wheatstone bridge circuits exhibits a gauge factor of 2.994 [9]. One approach utilizes two identical graphite-based sensing layers, with one being sensitive to both strain and temperature and the other being placed in a neutral axis to compensate for the temperature changes [10]. The challenge in this approach is to realize the sensor unit with identical sensors exhibiting exactly the same temperature coefficients. Another approach uses the nanocomposite material as the resistive components of a Wheatstone bridge circuit. While two arms of the bridge circuit are subjected to strain, the other two act as temperature compensation elements while the material in all arms has the same temperature coefficient of resistance [12]. The amount of nanofillers used in this approach is around 2 wt %, as the sensor was fabricated by means of dispersion in the polymer matrix. By utilizing numerical or external circuits, the gauge factor is not only dependent on the sensor, but also on the sensor system itself. Hence, the present research is focused on fabricating a hybrid material that is capable of self-compensating with temperature without the use of external circuits. An approach in this direction involves stacking thin films of nanomaterials that have different coefficients of temperature to create a bilayer hybrid composite structure that has a low-temperature dependency in the temperature range of 30 to 80◦C [13]. To synthesize the bilayer structure material, graphene, that has a positive temperature coefficient (PTC), and CNT, that has a negative temperature coefficient (NTC), were used.
Studies on the thermal conductivity of graphene [14,15] and CNT [16,17] point to a high-temperature dependency. The close to metallic nature of graphene provides it with a PTC behavior. When the temperature increases, due to the energy increase in the graphene’s honeycomb-shaped lattice structure, the free path of charge carriers is reduced, causing a decrease in the charge carriers’ mobility, resulting in an increase in the electrical resistance. The CNTs on the other hand exhibit NTC behavior, due to their semi-conductive behavior. When the temperature increases, energy is supplied to the CNT network as well as to the charge carriers. Consequently, the energized electrons have increased mobility, which facilitates the tunneling effect, resulting in an increase in conductivity, and thereby, a decrease in resistance [13].
However, a novel hybrid composite that incorporates different materials with different coefficients of temperature, and that can self-temperature compensate as well as bear strain sensing properties, is advantageous. In this study, the design of a new hybrid material based on graphene and MWCNT that exhibits both strain sensing properties and a temperature self-compensating capability is presented with a simple, fast, and cost-effective fabrication process.
2. Materials and Methods
2.1. Synthesis of the Hybrid Nanocomposite Material
J. Compos. Sci.2019,3, 96 3 of 14
due to the pristine graphitic surface of sp2carbon molecules. MWCNTs (NC7000) were purchased from Nanocyl (Sambreville, Belgium) and were manufactured by catalytic a chemical vapor deposition process, with an average diameter of 9.8 nm and an average length of 1.5µm. With 90% carbon purity and a surface area of 275 m2/g, the volume resistivity is 0.1µΩ·cm.
The dispersions were initially carried out with distilled water as the dispersion medium. Then, 0.1 wt % graphene and 0.1 wt % MWCNT were separately dispersed in distilled water by ultrasonication using a horn sonicator of diameter 3 mm (Bandelin Sonoplus HD 7300, Berlin, Germany) at an amplitude of 30% and a duration of 15 min, corresponding to a total power of 24.205 kJ. Ultrasonication has been proven to be a fast and effective technique to overcome the Van der Waals force of attraction between the nanoparticles, and can be used to disperse them in a suitable medium [18]. For the hybrid nanocomposite, 0.05 wt % graphene was mixed with 0.05 wt % MWCNT in distilled water and then sonicated for 15 min at 30% amplitude. This constitutes the hybrid material H-50:50, with 50% of each material composition. Following this setup, several hybrid materials were synthesized in order to determine the right combination for developing a self-temperature compensating material by changing the ratio of the base-materials as follows:
- H-55:45, 55% graphene and 45% MWCNT
- H-60:40, 60% graphene and 40% MWCNT
- H-65:35, 65% graphene and 35% MWCNT
- H-70:30, 70% graphene and 30% MWCNT
Furthermore, to understand the influence of the dispersion quality on the composition of the hybrid material for temperature compensation, organic solvents were used as a dispersion medium. Based on prior experience, an organic solvent such as tetrahydrofuran (THF) serves as a good dispersion medium, while also providing long-term dispersion stability [18]. Hence, the hybrid materials were synthesized with THF as the dispersion medium following the same dispersion procedure mentioned earlier.
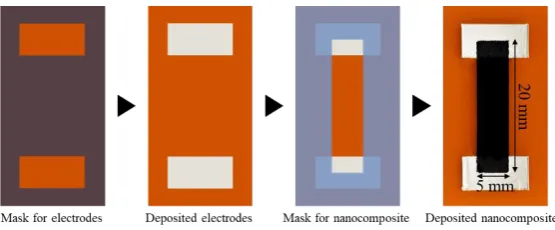
To investigate the influence of temperature and strain on the synthesized nanocomposite materials, thin films of the dispersion were fabricated by the drop-casting technique. The mask for deposition was an adhesive tape of 40µm thickness which was applied to a Kapton substrate of 20 mm×50 mm.
The mask was patterned with two rectangular slots of 5 mm ×10 mm for electrode deposition.
Screen printable conductive silver paste (DuPont, Midland, MI, USA) was deposited using a film applicator (Zehntner ZAA 2300, Sissach, Switzerland) and cured in an oven for 30 min at 80◦C. Another mask with a rectangular slot of 5 mm×20 mm was applied, and 12.5µL nanocomposite dispersion
was drop-casted using a micropipette. The deposited thin films were dried at room temperature in an extraction hood for 12 h and 30 min for the distilled water-based dispersions and THF-based dispersions, respectively. The low boiling point and high volatility of THF enabled a fast drying process. The complete sensor fabrication process is graphically represented in Figure1. To prevent the influence of humidity, the samples were sealed with a humidity-proof tape. To account for reproducibility, for each dispersion, 5 samples were drop-cast at the same time under ideal working conditions.
J. Compos. Sci. 2019, 3, x 3 of 13
length of 1.5 µ m. With 90% carbon purity and a surface area of 275 m2/g, the volume resistivity is 0.1 µΩ·cm.
The dispersions were initially carried out with distilled water as the dispersion medium. Then, 0.1 wt % graphene and 0.1 wt % MWCNT were separately dispersed in distilled water by ultrasonication using a horn sonicator of diameter 3 mm (Bandelin Sonoplus HD 7300, Berlin, Germany) at an amplitude of 30% and a duration of 15 min, corresponding to a total power of 24.205 kJ. Ultrasonication has been proven to be a fast and effective technique to overcome the Van der Waals force of attraction between the nanoparticles, and can be used to disperse them in a suitable medium [18]. For the hybrid nanocomposite, 0.05 wt % graphene was mixed with 0.05 wt % MWCNT in distilled water and then sonicated for 15 min at 30% amplitude. This constitutes the hybrid material H-50:50, with 50% of each material composition. Following this setup, several hybrid materials were synthesized in order to determine the right combination for developing a self-temperature compensating material by changing the ratio of the base-materials as follows:
- H-55:45, 55% graphene and 45% MWCNT - H-60:40, 60% graphene and 40% MWCNT - H-65:35, 65% graphene and 35% MWCNT - H-70:30, 70% graphene and 30% MWCNT
Furthermore, to understand the influence of the dispersion quality on the composition of the hybrid material for temperature compensation, organic solvents were used as a dispersion medium. Based on prior experience, an organic solvent such as tetrahydrofuran (THF) serves as a good dispersion medium, while also providing long-term dispersion stability [18]. Hence, the hybrid materials were synthesized with THF as the dispersion medium following the same dispersion procedure mentioned earlier.
To investigate the influence of temperature and strain on the synthesized nanocomposite materials, thin films of the dispersion were fabricated by the drop-casting technique. The mask for deposition was an adhesive tape of 40 µ m thickness which was applied to a Kapton substrate of 20 mm × 50 mm. The mask was patterned with two rectangular slots of 5 mm × 10 mm for electrode deposition. Screen printable conductive silver paste (DuPont, Midland, MI, USA) was deposited using a film applicator (Zehntner ZAA 2300, Sissach, Switzerland) and cured in an oven for 30 min at 80 °C. Another mask with a rectangular slot of 5 mm × 20 mm was applied, and 12.5 µ L nanocomposite dispersion was drop-casted using a micropipette. The deposited thin films were dried at room temperature in an extraction hood for 12 h and 30 min for the distilled water-based dispersions and THF-based dispersions, respectively. The low boiling point and high volatility of THF enabled a fast drying process. The complete sensor fabrication process is graphically represented in Figure 1. To prevent the influence of humidity, the samples were sealed with a humidity-proof tape. To account for reproducibility, for each dispersion, 5 samples were drop-cast at the same time under ideal working conditions.
J. Compos. Sci.2019,3, 96 4 of 14
2.2. Equipment for Material Characterization
The Raman spectroscopy (Renishaw inVia, Pliezhausen, Deutschland) analysis was performed to examine the crystalline structure of the materials and the dispersion nature in the thin films. The equipment was a combination of optical microscopy and high-resolution confocal Raman spectroscopy, and the experiment was performed with an excitation wavelength of 532 nm (max. beam intensity 100 mW), a power of 5%, and an accumulation time of 10 s. More investigation on the dispersion quality was performed using a scanning electron microscope (SEM, Carl Zeiss-Auriga with integrated Smart SEM, Jena, Germany). The imaging was done with a probe current of 50 pA and an acceleration voltage of 30 kV.
2.3. Temperature Measurement Procedure
The temperature analysis was performed using the hot plate of the magnetic stirrer from Witeg (Wertheim, Germany), which was operated in the temperature range of 25 to 80◦
C. The fabricated thin film samples were placed on the hot plate and the change in resistance of the samples with respect to the change in temperature was measured using a digital “Agilent 34401a” multimeter from Keysight (California, CA, USA). The temperature of the hot plate was varied at an interval of 5◦C for every 15 min, and 10 readings of each sample were recorded after each set-temperature was reached.
2.4. Strain Measurement Procedure
The fabricated thin film samples were attached to a cantilever beam with dimensions 17.7 cm
×3.15 cm×0.15 cm and made of FR-4 material (Figure2a). One of the beam’s edges was fixed to a
strain measurement machine that operated by means of free suspended weight loads to bend the beam, resulting in a strain which was proportional to the applied weight. The range of the applied suspended weights varied from 50 g to 500 g in steps of 50 g, and the change in resistance of the samples for each load was measured using a digital multimeter. The measurement was carried out 5 times for strain loading-unloading cycles for all samples being tested. For an effective comparison of the samples made of the hybrid material to those of the individual materials, the samples were placed next to each other in the same fixation point of the cantilever beam, as shown in Figure2b. The stability and lifetime of the sensors were tested using a microcontroller-driven, automated strain application device, as shown in Figure2c.
J. Compos. Sci. 2019, 3, x 4 of 13
2.2. Equipment for Material Characterization
The Raman spectroscopy (Renishaw inVia, Pliezhausen, Deutschland) analysis was performed to examine the crystalline structure of the materials and the dispersion nature in the thin films. The equipment was a combination of optical microscopy and high-resolution confocal Raman spectroscopy, and the experiment was performed with an excitation wavelength of 532 nm (max. beam intensity 100 mW), a power of 5%, and an accumulation time of 10 s. More investigation on the dispersion quality was performed using a scanning electron microscope (SEM, Carl Zeiss-Auriga with integrated Smart SEM, Jena, Germany). The imaging was done with a probe current of 50 pA and an acceleration voltage of 30 kV.
2.3. Temperature Measurement Procedure
The temperature analysis was performed using the hot plate of the magnetic stirrer from Witeg (Wertheim, Germany), which was operated in the temperature range of 25 to 80 °C. The fabricated thin film samples were placed on the hot plate and the change in resistance of the samples with respect to the change in temperature was measured using a digital “Agilent 34401a” multimeter from Keysight (California, CA, USA). The temperature of the hot plate was varied at an interval of 5 °C for every 15 min, and 10 readings of each sample were recorded after each set-temperature was reached.
2.4. Strain Measurement Procedure
The fabricated thin film samples were attached to a cantilever beam with dimensions 17.7 cm × 3.15 cm × 0.15 cm and made of FR-4 material (Figure 2a). One of the beam’s edges was fixed to a strain measurement machine that operated by means of free suspended weight loads to bend the beam, resulting in a strain which was proportional to the applied weight. The range of the applied suspended weights varied from 50 g to 500 g in steps of 50 g, and the change in resistance of the samples for each load was measured using a digital multimeter. The measurement was carried out 5 times for strain loading-unloading cycles for all samples being tested. For an effective comparison of the samples made of the hybrid material to those of the individual materials, the samples were placed next to each other in the same fixation point of the cantilever beam, as shown in Figure 2b. The stability and lifetime of the sensors were tested using a microcontroller-driven, automated strain application device, as shown in Figure 2c.
Figure 2. (a) Fabricated thin-film strain sensors attached to a FR4 beam, (b) experimental setup for
strain measurement, and (c) automated strain measurement setup for the cyclic test.
The strain exerted on the thin film samples can be obtained numerically through the flexure formula, which correlates the bending moment and the moment of inertia of the beam to the strain induced by the suspended weights. The performance of a strain sensor is defined by the gauge factor, which can be calculated as:
Figure 2. (a) Fabricated thin-film strain sensors attached to a FR4 beam, (b) experimental setup for strain measurement, and (c) automated strain measurement setup for the cyclic test.
J. Compos. Sci.2019,3, 96 5 of 14
induced by the suspended weights. The performance of a strain sensor is defined by the gauge factor, which can be calculated as:
GF= (∆R
R )/ε, (1)
where∆R/R is the change in resistance between two strain measurements andεis the tensile strain. The change in resistance can be obtained from the experimental test. The tensile strain, on the other hand, can be obtained with Equation (2),
ε= (σ/E), (2)
where E is the Young modulus of the material (in this case FR4). Theσis the bending stress at a given point, and can be calculated using Equation (3),
σ= (M·c)/I, (3)
where I is the moment of inertia of the material, which is described by Equation (4),
I=w·t3/12. (4)
The variables c and M are dependent on the thickness of the material and the bending momentum, respectively. The former is defined by Equation (5) and the latter by Equation (6).
c=t/2 (5)
M=P(L−X) (6)
where L is the length from the fixation point to the load application point, x is the distance from the fixation point to half of the length of the sensor, t is the thickness of the material, w is the width of the material, and P is the weight applied, which is expressed by Equation (7),
P=mg. (7)
From the above equations, the bending stress can be expressed as a function of the beam’s dimensions, as described in Equation (8),
σ= (6mg(L−x))/w·t2. (8)
Since the dimensions of the cantilever beam are known, the bending stress can be estimated as a function of the applied load, as described in Equation (9),
σ=m×11453. (9)
The young modulus for the FR4 is 2.41×10⁶kgm/(cm2s2). Rewriting Equation (2) using Equation (9)
and the young modulus of FR4, it is possible to redescribe the tensile strain as
ε= (m×11453)/2.41×106. (10)
J. Compos. Sci.2019,3, 96 6 of 14
3. Results and Discussion
3.1. Material Characterization
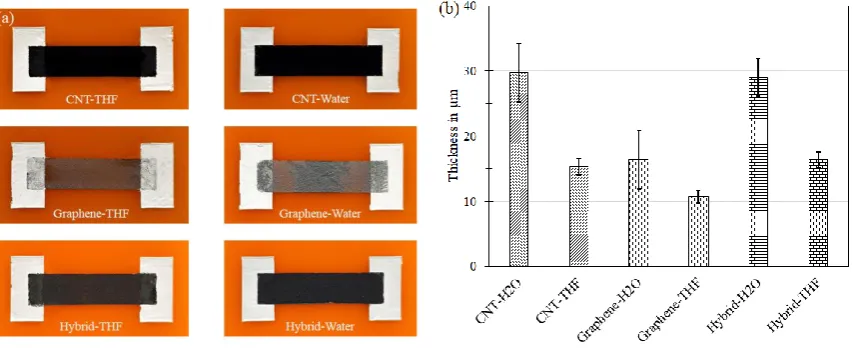
Upon visual inspection, the samples based on distilled water were considerably thicker than those based on THF, exhibiting a non-homogenous distribution of the material, which can be clearly seen for graphene in Figure3a. It can also be observed from Figure3a that the thin films based on THF were slightly more translucent than the others, as an indication of thinner layers except for MWCNT based thin films. The thickness of the thin films was measured using a displacement gauge with a resolution of 0.1µm. In general, thin films based on distilled water as the dispersion medium are slightly thicker than those with THF. Also, THF-based thin films are highly reproducible with an average deviation of 1.14µm, compared to 3.97µm for water-based. The thickness of the thin films based on THF (H-70:30) and water (H-60:40) are 16±1.2µm and 29±2.9µm, respectively; thickness comparison is shown in
Figure3b.
J. Compos. Sci. 2019, 3, x 6 of 13
Figure 3. (a) Images of the fabricated thin films, (b) graph representing the average thickness of each sample.
Raman spectroscopy was used to study the defects and crystalline structure of the nanoparticles in the thin films. Figure 4a shows the Raman spectra obtained by examining the THF-based MWCNT, graphene and hybrid thin films. The Raman spectrum of MWCNT was characterized by the two main typical graphite bands, i.e., the G band at 1581 cm–1, denoting the in-plane C-C bond vibration, and
the D band at 1341 cm–1, caused by the presence of disorders in carbon systems [19]. The characteristic
spectral feature of graphene is the G band at 1580 cm–1, indicating the number of graphene layers.
The spectrum of the hybrid thin film is a combination of both MWCNT and graphene spectra with a G band at 1576 cm–1 and a D band at 1347 cm–1. Figure 4b shows the comparison of Raman spectra
for hybrid thin films based on both THF and water. It can be observed that the water-based thin films resemble a more graphene-like spectrum with the D band shifted to 1342 cm–1. Moreover, the D band
of the THF-based thin film was shifted to a higher wavenumber, i.e., 1347 cm–1,compared to that of
MWCNT and water-based thin films, indicating less intertube interactions, as the nanotubes are better dispersed [19].
Figure 4. Raman spectra for (a) material analysis on the thin films, and (b) dispersion comparison of Hybrid thin films based on THF and water.
The thin films were examined using SEM to determine the homogeneity of the dispersion at a microscopic scale. The well-dispersed MWCNT network (100 nm scale) without any agglomerations and uniformly-distributed graphene nanoplatelets (1 µ m scale) can be observed in Figure 5a and 5b, respectively. The formation of a MWCNT-graphene network in the hybrid nanocomposite material-based thin film is shown in Figure 5c at a scale of 100 nm. Figure 5d,e show the hybrid nanocomposite
Figure 3. (a) Images of the fabricated thin films, (b) graph representing the average thickness of each sample.
Raman spectroscopy was used to study the defects and crystalline structure of the nanoparticles in the thin films. Figure4a shows the Raman spectra obtained by examining the THF-based MWCNT, graphene and hybrid thin films. The Raman spectrum of MWCNT was characterized by the two main typical graphite bands, i.e., the G band at 1581 cm−1, denoting the in-plane C-C bond vibration, and the D band at 1341 cm−1
J. Compos. Sci.2019,3, 96 7 of 14
J. Compos. Sci. 2019, 3, x 6 of 13
Figure 3. (a) Images of the fabricated thin films, (b) graph representing the average thickness of each sample.
Raman spectroscopy was used to study the defects and crystalline structure of the nanoparticles in the thin films. Figure 4a shows the Raman spectra obtained by examining the THF-based MWCNT, graphene and hybrid thin films. The Raman spectrum of MWCNT was characterized by the two main typical graphite bands, i.e., the G band at 1581 cm–1, denoting the in-plane C-C bond vibration, and
the D band at 1341 cm–1, caused by the presence of disorders in carbon systems [19]. The characteristic
spectral feature of graphene is the G band at 1580 cm–1, indicating the number of graphene layers.
The spectrum of the hybrid thin film is a combination of both MWCNT and graphene spectra with a G band at 1576 cm–1 and a D band at 1347 cm–1. Figure 4b shows the comparison of Raman spectra
for hybrid thin films based on both THF and water. It can be observed that the water-based thin films resemble a more graphene-like spectrum with the D band shifted to 1342 cm–1. Moreover, the D band
of the THF-based thin film was shifted to a higher wavenumber, i.e., 1347 cm–1,compared to that of
MWCNT and water-based thin films, indicating less intertube interactions, as the nanotubes are better dispersed [19].
Figure 4. Raman spectra for (a) material analysis on the thin films, and (b) dispersion comparison of Hybrid thin films based on THF and water.
The thin films were examined using SEM to determine the homogeneity of the dispersion at a microscopic scale. The well-dispersed MWCNT network (100 nm scale) without any agglomerations and uniformly-distributed graphene nanoplatelets (1 µ m scale) can be observed in Figure 5a and 5b, respectively. The formation of a MWCNT-graphene network in the hybrid nanocomposite material-based thin film is shown in Figure 5c at a scale of 100 nm. Figure 5d,e show the hybrid nanocomposite
Figure 4.Raman spectra for (a) material analysis on the thin films, and (b) dispersion comparison of Hybrid thin films based on THF and water.
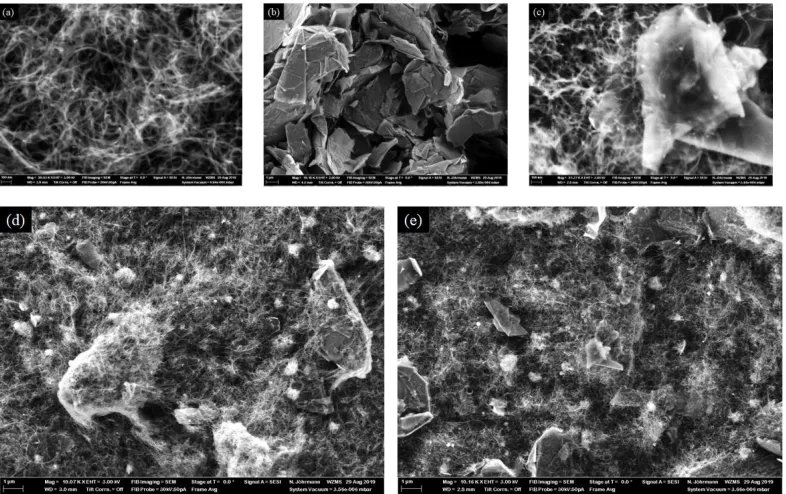
The thin films were examined using SEM to determine the homogeneity of the dispersion at a microscopic scale. The well-dispersed MWCNT network (100 nm scale) without any agglomerations and uniformly-distributed graphene nanoplatelets (1µm scale) can be observed in Figure5a,b, respectively. The formation of a MWCNT-graphene network in the hybrid nanocomposite material-based thin film is shown in Figure5c at a scale of 100 nm. Figure5d,e show the hybrid nanocomposite material based on water and THF. It can be observed that both samples contain a well-established network of MWCNTs and graphene. However, the water-based nanocomposite has larger graphene particles that are completely covered with a dense cloud of MWCNTs. Apparently, THF-based nanocomposite is more uniform, with a distributed MWCNT-graphene network. Such homogeneous distribution is advantageous in the synthesis of high-quality sensors with less concentration of material and good reproducibility.
J. Compos. Sci. 2019, 3, x 7 of 13
material based on water and THF. It can be observed that both samples contain a well-established network of MWCNTs and graphene. However, the water-based nanocomposite has larger graphene particles that are completely covered with a dense cloud of MWCNTs. Apparently, THF-based nanocomposite is more uniform, with a distributed MWCNT-graphene network. Such homogeneous distribution is advantageous in the synthesis of high-quality sensors with less concentration of material and good reproducibility.
Figure 5. SEM images of the thin films, (a) MWCNTs in THF, (b) graphene in THF, (c) MWCNT-graphene in H-70:30; (d) and (e) homogeneity comparison of the water and THF-based hybrids.
3.2. Temperature Dependency of the Materials
Graphene and MWCNT exhibit different resistive behavior when under temperature variation. As graphene has a PTC behavior, the resistance of the material increases when the temperature increases. MWCNT, on the other hand, has NTC behavior, meaning that the resistance decreases as the temperature increases. The hypothesis of this research is that if these two materials are mixed in a certain ratio the effect of one can compensate for the other under temperature variation, thus enabling a hybrid material with temperature self-compensation capabilities.
To investigate the influence of temperature on the resistive behavior of these materials, 5 thin films of each tested material were characterized. Figure 6a shows the average relative change in resistance with temperature for the MWCNT, graphene, and H-50:50 thin film samples. As expected, the graphene samples show a PTC behavior, with an increase in resistance as the temperature increases. The MWCNT shows NTC behavior, with a decrease in resistance as the temperature increases. The hybrid samples with a material composition in a ratio 50:50 exhibited an NTC behavior like that of MWCNT. It was expected that graphene would exhibit a dominant effect on the hybrid composite, given that it shows a higher change in relative resistance to temperature than MWCNT. However, MWCNT seems to be dominating at the 50:50 ratio of the hybrid material. The hybrid samples show a relative change in resistance of 3.3%, which is less than that of the MWCNT samples at 3.9%, and significantly lower than graphene samples at 44.3%. In terms of the sensitivity of the material to temperature, it can be observed from Figure 6b that the graphene samples exhibited
higher sensitivity, i.e., 274 Ω/°C, while the MWCNT and hybrid samples exhibited a sensitivity of
−1.71 Ω/°C and −2.5 Ω/°C, respectively.
J. Compos. Sci.2019,3, 96 8 of 14
3.2. Temperature Dependency of the Materials
Graphene and MWCNT exhibit different resistive behavior when under temperature variation. As graphene has a PTC behavior, the resistance of the material increases when the temperature increases. MWCNT, on the other hand, has NTC behavior, meaning that the resistance decreases as the temperature increases. The hypothesis of this research is that if these two materials are mixed in a certain ratio the effect of one can compensate for the other under temperature variation, thus enabling a hybrid material with temperature self-compensation capabilities.
To investigate the influence of temperature on the resistive behavior of these materials, 5 thin films of each tested material were characterized. Figure6a shows the average relative change in resistance with temperature for the MWCNT, graphene, and H-50:50 thin film samples. As expected, the graphene samples show a PTC behavior, with an increase in resistance as the temperature increases. The MWCNT shows NTC behavior, with a decrease in resistance as the temperature increases. The hybrid samples with a material composition in a ratio 50:50 exhibited an NTC behavior like that of MWCNT. It was expected that graphene would exhibit a dominant effect on the hybrid composite, given that it shows a higher change in relative resistance to temperature than MWCNT. However, MWCNT seems to be dominating at the 50:50 ratio of the hybrid material. The hybrid samples show a relative change in resistance of 3.3%, which is less than that of the MWCNT samples at 3.9%, and significantly lower than graphene samples at 44.3%. In terms of the sensitivity of the material to temperature, it can be observed from Figure6b that the graphene samples exhibited higher sensitivity, i.e., 274Ω/◦C, while the MWCNT and hybrid samples exhibited a sensitivity of−1.71Ω/◦C and−2.5Ω/◦C, respectively.
J. Compos. Sci. 2019, 3, x 8 of 13
Figure 6. (a) Relative change in resistance with temperature for MWCNT, graphene and hybrid
(H-50:50) samples and (b) sensitivity of the samples to temperature changes.
3.3. Evaluation of the Hybrid Materials based on Aqueous Medium
The hybrid samples in this ratio (H-50:50) exhibited increased sensitivity to temperature compared to that of MWCNT, and hence, more investigation on the ratio of the material composition must be carried out to eliminate the temperature influence. The dominance of MWCNT must be minimized, and hence, the ratio of graphene was increased in the hybrid composites. Four more combinations of hybrid materials were synthesized by increasing the concentration of graphene from 55% to 70% in steps of 5%.
It can be observed from Figure 7a that in the hybrid samples with graphene concentrations of 50%, 55%, and 60%, the dominance of MWCNT gradually decreases, and they exhibit a similar pattern of resistance change with the increase in temperature. In the temperature range of 25 to 60 °C, the MWCNT seems to have a dominant effect, leading to an NTC behavior with a decrease in resistance. However, after 60 °C, the graphene seems to dominate, leading to an increase in the resistance. Hybrid samples with a higher ratio of graphene (H-65:35 and H-70:30) clearly exhibited a PTC behavior with a resistance increase from 40 °C and a resistance change of nearly 4%. Any further increase in the graphene concentration will lead to an even stronger PTC behavior, rather than compensation; hence, no further hybrid combinations were performed. Among these hybrid samples, the least sensitive to temperature was the hybrid H-60:40, which had a resistance change of only 0.64%. The sensitivity of these hybrid samples, as seen from Figure 7b, gradually decreased from
−2.5 Ω/°C (H-50:50) to 0.23 Ω/°C (H-60:40), and then increased to 1.5 Ω/°C (H-70:30). This provides evidence that by fabricating such hybrid nanocomposite materials, the sensitivity of the material to temperature changes can be greatly reduced.
Figure 6. (a) Relative change in resistance with temperature for MWCNT, graphene and hybrid (H-50:50) samples and (b) sensitivity of the samples to temperature changes.
3.3. Evaluation of the Hybrid Materials based on Aqueous Medium
The hybrid samples in this ratio (H-50:50) exhibited increased sensitivity to temperature compared to that of MWCNT, and hence, more investigation on the ratio of the material composition must be carried out to eliminate the temperature influence. The dominance of MWCNT must be minimized, and hence, the ratio of graphene was increased in the hybrid composites. Four more combinations of hybrid materials were synthesized by increasing the concentration of graphene from 55% to 70% in steps of 5%.
J. Compos. Sci.2019,3, 96 9 of 14
resistance. Hybrid samples with a higher ratio of graphene (H-65:35 and H-70:30) clearly exhibited a PTC behavior with a resistance increase from 40◦C and a resistance change of nearly 4%. Any further increase in the graphene concentration will lead to an even stronger PTC behavior, rather than compensation; hence, no further hybrid combinations were performed. Among these hybrid samples, the least sensitive to temperature was the hybrid H-60:40, which had a resistance change of only 0.64%. The sensitivity of these hybrid samples, as seen from Figure7b, gradually decreased from−2.5Ω/◦C
(H-50:50) to 0.23Ω/◦C (H-60:40), and then increased to 1.5Ω/◦C (H-70:30). This provides evidence that by fabricating such hybrid nanocomposite materials, the sensitivity of the material to temperature changes can be greatly reduced.
J. Compos. Sci. 2019, 3, x 9 of 13
Figure 7. (a) Relative change in resistance with temperature for different hybrid samples, and (b) sensitivity of the hybrid samples to temperature changes.
3.4. Dispersion Enhancement using Organic Solvent
Even though the hybrid nanocomposite H-60:40 showed good temperature-independent properties with a very low sensitivity, i.e., 0.23 Ω/°C, the standard deviation among different samples
of the same material were significantly higher. This is a clear indication of poor dispersion quality, which leads to poorly-reproducible thin film samples. Thus, it is essential to optimize the dispersion quality of the synthesized nanocomposite. Based on our prior analysis [18], the dispersion of MWCNTs in an organic solvent like THF significantly enhances the dispersion quality and long-term stability. Hence, the hybrid nanocomposites were synthesized using THF as the dispersion medium. Figure 8a represents the relative change in resistance for the least temperature sensitive hybrid material composition based on both distilled water (H-60:40) and THF (H-70:30). It can be observed that the response of the hybrid samples based on THF as the dispersion medium are relatively stable and much less sensitive to temperature compared to the samples based on distilled water. By improving the dispersion quality, the self-temperature compensating ability of the hybrid material can be enhanced, as shown in Figure 8b, where the sensitivity of the hybrid material based on THF is around −0.0218 Ω/°C, which is 10 times smaller than that obtained by hybrid material based on water. Additionally, the standard deviation observed for the THF-based samples was considerably smaller than that observed for water-based samples, which results in an improvement in the reproducibility of the THF-based thin films. This is a clear indication that apart from the composition of the material, the quality of dispersion also plays a vital role in tuning the properties of the hybrid material. Thus, further analyses will be carried out to determine the ideal ratio of the hybrid material with improved dispersion qualities.
Figure 7. (a) Relative change in resistance with temperature for different hybrid samples, and (b) sensitivity of the hybrid samples to temperature changes.
3.4. Dispersion Enhancement using Organic Solvent
Even though the hybrid nanocomposite H-60:40 showed good temperature-independent properties with a very low sensitivity, i.e., 0.23Ω/◦C, the standard deviation among different samples of the same material were significantly higher. This is a clear indication of poor dispersion quality, which leads to poorly-reproducible thin film samples. Thus, it is essential to optimize the dispersion quality of the synthesized nanocomposite. Based on our prior analysis [18], the dispersion of MWCNTs in an organic solvent like THF significantly enhances the dispersion quality and long-term stability. Hence, the hybrid nanocomposites were synthesized using THF as the dispersion medium.
Figure8a represents the relative change in resistance for the least temperature sensitive hybrid material composition based on both distilled water (H-60:40) and THF (H-70:30). It can be observed that the response of the hybrid samples based on THF as the dispersion medium are relatively stable and much less sensitive to temperature compared to the samples based on distilled water. By improving the dispersion quality, the self-temperature compensating ability of the hybrid material can be enhanced, as shown in Figure8b, where the sensitivity of the hybrid material based on THF is around−0.0218Ω/◦C, which is 10 times smaller than that obtained by hybrid material based on water.
J. Compos. Sci.2019,3, 96 10 of 14
J. Compos. Sci. 2019, 3, x 10 of 13
Figure 8. (a) Comparison of relative change in resistance between water and THF as a dispersion
medium, and (b) sensitivity of these samples to temperature changes.
3.5. Evaluation of the Hybrid Materials based on Organic Solvent
Since the hybrid material based on distilled water H-60:40 exhibited the least sensitivity to temperature, this ratio of 60:40 served as a point of reference to synthesize THF-based samples. Four different hybrid materials were synthesized with THF from 60% to 75% graphene in steps of 5%. Since THF is a good dispersion medium for MWCNT, with the same concentration and dispersion parameters, more MWCNTs were debundled, leading to NTC behavior unlike the earlier case for the hybrid material H-60:40, as seen in Figure 9a. This behavior gradually decreases until the hybrid material composite H-70:30, beyond which a PTC behavior was observed. It can be observed from Figure 9b that the sensitivity of these materials to temperature gradually decreased, starting from
−1.02 Ω/°C for H-60:40 to −0.0218 Ω/°C for H-70:30, corresponding to an overall change in resistance
of 1.2 Ω in the temperature range of 25 to 80 °C. The final hybrid material composite was practically insensitive to temperature changes, and was therefore a material with temperature self-compensation capabilities.
Figure 9. (a) Relative change in resistance with temperature for different hybrid samples with THF as
a dispersion medium, and (b) sensitivity of these samples to temperature changes.
Figure 8. (a) Comparison of relative change in resistance between water and THF as a dispersion medium, and (b) sensitivity of these samples to temperature changes.
3.5. Evaluation of the Hybrid Materials based on Organic Solvent
Since the hybrid material based on distilled water H-60:40 exhibited the least sensitivity to temperature, this ratio of 60:40 served as a point of reference to synthesize THF-based samples. Four different hybrid materials were synthesized with THF from 60% to 75% graphene in steps of 5%. Since THF is a good dispersion medium for MWCNT, with the same concentration and dispersion parameters, more MWCNTs were debundled, leading to NTC behavior unlike the earlier case for the hybrid material H-60:40, as seen in Figure9a. This behavior gradually decreases until the hybrid material composite H-70:30, beyond which a PTC behavior was observed. It can be observed from Figure9b that the sensitivity of these materials to temperature gradually decreased, starting from−1.02Ω/◦C for
H-60:40 to−0.0218Ω/◦C for H-70:30, corresponding to an overall change in resistance of 1.2Ωin the
temperature range of 25 to 80◦C. The final hybrid material composite was practically insensitive to temperature changes, and was therefore a material with temperature self-compensation capabilities.
J. Compos. Sci. 2019, 3, x 10 of 13
Figure 8. (a) Comparison of relative change in resistance between water and THF as a dispersion
medium, and (b) sensitivity of these samples to temperature changes.
3.5. Evaluation of the Hybrid Materials based on Organic Solvent
Since the hybrid material based on distilled water H-60:40 exhibited the least sensitivity to temperature, this ratio of 60:40 served as a point of reference to synthesize THF-based samples. Four different hybrid materials were synthesized with THF from 60% to 75% graphene in steps of 5%. Since THF is a good dispersion medium for MWCNT, with the same concentration and dispersion parameters, more MWCNTs were debundled, leading to NTC behavior unlike the earlier case for the hybrid material H-60:40, as seen in Figure 9a. This behavior gradually decreases until the hybrid material composite H-70:30, beyond which a PTC behavior was observed. It can be observed from Figure 9b that the sensitivity of these materials to temperature gradually decreased, starting from
−1.02 Ω/°C for H-60:40 to −0.0218 Ω/°C for H-70:30, corresponding to an overall change in resistance
of 1.2 Ω in the temperature range of 25 to 80 °C. The final hybrid material composite was practically insensitive to temperature changes, and was therefore a material with temperature self-compensation capabilities.
Figure 9. (a) Relative change in resistance with temperature for different hybrid samples with THF as
a dispersion medium, and (b) sensitivity of these samples to temperature changes.
Figure 9.(a) Relative change in resistance with temperature for different hybrid samples with THF as a dispersion medium, and (b) sensitivity of these samples to temperature changes.
3.6. Evaluation of Strain Response of Thin Film Sensors
J. Compos. Sci.2019,3, 96 11 of 14
of thin film-based strain sensors with no cross-sensitivity to temperature. To investigate the performance of the developed hybrid material, thin films of the materials (MWCNT, graphene, and Hybrid H-70:30) were attached to a cantilever beam, as described in Section2.4. Slotted weights ranging from 50 g to 500 g were suspended at the free end of the cantilever to exert strain on the sensors under test.
Figure10a shows the relative change in the resistance of the fabricated thin-film sensors when under strain. Graphene exhibits higher sensitivity to strain, with a relative change of 12.4% compared to that of MWCNT and hybrid samples with 1.1% and 3.7%, respectively. The hybrid samples exhibit a relative change in resistance that is roughly 4 times higher than MWCNT but 3 times smaller than graphene samples. The gauge factor of these strain sensors in Figure10b was estimated to be at 42.7 for graphene, 4.63 for MWCNT, and 16.21 for hybrid nanocomposite H-70:30. Even though the hybrid samples exhibited a gauge factor that was smaller than that of graphene, they had the key advantage of being able to function as a strain sensor without any significant influence of temperature variation in the range of 25 to 80◦C. Furthermore, the hybrid samples were subjected to cyclic strain for 100 cycles; the response is shown in Figure11. It can be observed from the figure that the sensor response shifts from 3% to 2.3% during the initial cycles, and later stabilizes. Despite the minor fluctuation, it is evident that the sensor is capable of sensing strain over 100 cycles with good linearity, as seen in the magnified image in Figure11.
J. Compos. Sci. 2019, 3, x 11 of 13
3.6. Evaluation of Strain Response of Thin Film Sensors
The hybrid nanocomposite material H-70:30 exhibited self-temperature compensation behavior in the temperature range of 25 to 80 °C. Such a hybrid material could be advantageous in the development of thin film-based strain sensors with no cross-sensitivity to temperature. To investigate the performance of the developed hybrid material, thin films of the materials (MWCNT, graphene, and Hybrid H-70:30) were attached to a cantilever beam, as described in Section 2.4. Slotted weights ranging from 50 g to 500 g were suspended at the free end of the cantilever to exert strain on the sensors under test.
Figure 10a shows the relative change in the resistance of the fabricated thin-film sensors when under strain. Graphene exhibits higher sensitivity to strain, with a relative change of 12.4% compared to that of MWCNT and hybrid samples with 1.1% and 3.7%, respectively. The hybrid samples exhibit a relative change in resistance that is roughly 4 times higher than MWCNT but 3 times smaller than graphene samples. The gauge factor of these strain sensors in Figure 10b was estimated to be at 42.7 for graphene, 4.63 for MWCNT, and 16.21 for hybrid nanocomposite H-70:30. Even though the hybrid samples exhibited a gauge factor that was smaller than that of graphene, they had the key advantage of being able to function as a strain sensor without any significant influence of temperature variation in the range of 25 to 80 °C. Furthermore, the hybrid samples were subjected to cyclic strain for 100 cycles; the response is shown in Figure 11. It can be observed from the figure that the sensor response shifts from 3% to 2.3% during the initial cycles, and later stabilizes. Despite the minor fluctuation, it is evident that the sensor is capable of sensing strain over 100 cycles with good linearity, as seen in the magnified image in Figure 11.
Figure 10. (a) Relative change in resistance with applied slotted weights, and (b) gauge factor comparison of the thin film strain sensors.
Figure 11. Response of the hybrid sample under cyclic strain loading test.
Figure 10. (a) Relative change in resistance with applied slotted weights, and (b) gauge factor comparison of the thin film strain sensors.
J. Compos. Sci. 2019, 3, x 11 of 13
3.6. Evaluation of Strain Response of Thin Film Sensors
The hybrid nanocomposite material H-70:30 exhibited self-temperature compensation behavior in the temperature range of 25 to 80 °C. Such a hybrid material could be advantageous in the development of thin film-based strain sensors with no cross-sensitivity to temperature. To investigate the performance of the developed hybrid material, thin films of the materials (MWCNT, graphene, and Hybrid H-70:30) were attached to a cantilever beam, as described in Section 2.4. Slotted weights ranging from 50 g to 500 g were suspended at the free end of the cantilever to exert strain on the sensors under test.
Figure 10a shows the relative change in the resistance of the fabricated thin-film sensors when under strain. Graphene exhibits higher sensitivity to strain, with a relative change of 12.4% compared to that of MWCNT and hybrid samples with 1.1% and 3.7%, respectively. The hybrid samples exhibit a relative change in resistance that is roughly 4 times higher than MWCNT but 3 times smaller than graphene samples. The gauge factor of these strain sensors in Figure 10b was estimated to be at 42.7 for graphene, 4.63 for MWCNT, and 16.21 for hybrid nanocomposite H-70:30. Even though the hybrid samples exhibited a gauge factor that was smaller than that of graphene, they had the key advantage of being able to function as a strain sensor without any significant influence of temperature variation in the range of 25 to 80 °C. Furthermore, the hybrid samples were subjected to cyclic strain for 100 cycles; the response is shown in Figure 11. It can be observed from the figure that the sensor response shifts from 3% to 2.3% during the initial cycles, and later stabilizes. Despite the minor fluctuation, it is evident that the sensor is capable of sensing strain over 100 cycles with good linearity, as seen in the magnified image in Figure 11.
Figure 10. (a) Relative change in resistance with applied slotted weights, and (b) gauge factor comparison of the thin film strain sensors.
Figure 11. Response of the hybrid sample under cyclic strain loading test. Figure 11.Response of the hybrid sample under cyclic strain loading test.
J. Compos. Sci.2019,3, 96 12 of 14
nanocomposite is realized with less nanomaterial concentration, i.e., 0.1 wt %, and the deviation of the sample resistance is<0.5% in the temperature range of 25 to 80◦C. Moreover, the realized strain sensor with this hybrid material exhibited a significantly higher gauge factor of 16.21. The innovation of this work is the synthesis of a material that has inherent temperature compensation properties by optimizing the composition of different nanoparticles. This enables a simple and fast realization of sensors that are not constrained by geometry [9] or layers [13].
Table 1.Performance comparison of the synthesized hybrid sample (highlighted) with other, state of the art materials.
Material Concentration Temperature Related Parameters Sensor Parameters
Range Compensation Influence Type GF
CNT [8] 8 wt % 20 to 70◦C Numerical model - Strain
-MWCNT [11] 1 wt % 10 to 80◦
C
Differential Difference Amplifier
0.03% pH
-MWCNT [12] 2 wt % −20 to 50◦C Full-Wheatstone
bridge system 3.1% Force
-Graphite paste [9] - −10 to 95◦C Full-Wheatstone
bridge system - Strain 2.994
Graphite ink [10] - 20 to 120◦C Neutral axis
engineering - Strain 19.1
SWCNT/Graphene [13]
Layer 1: 0.016 wt % SWCNT, Layer 2: 0.3 wt %
Graphene
30 to 85◦
C
Stacked layers of thin films with an
opposite temperature
coefficient
<1% Strain 5.44
MWCNT/Graphene
0.1 wt % Hybrid (0.03 wt %
MWCNT, 0.07 wt % Graphene)
25 to 80◦C
Single layer thin film with hybrid nanocomposite
material
<0.5% Strain 16.21
4. Conclusions
In this study, a simple, fast and cost-effective fabrication technique for realizing a hybrid nanocomposite-based strain sensor with temperature self-compensation capability is presented. The hybrid nanocomposite is developed by using an optimized combination of nanomaterials having a positive temperature coefficient, such as graphene, and a negative temperature coefficient, such as MWCNT. Upon mixing these materials, the resulting hybrid material can be designed to be insensitive to temperature variation while retaining its strain sensing properties. The hybrid material design was optimized in terms of the concentration of the materials and the quality of dispersion. Raman spectroscopy and SEM imaging were performed to evaluate the material’s crystalline structure, as well as the dispersion quality of the hybrid nanostructure and how this nanostructure was affected by the dispersion medium. Upon investigating several combinations, the hybrid material based on THF as a dispersion medium with an ideal ratio of 70% graphene and 30% MWCNT performed as a strain sensor with a gauge factor of 16.21. The sensor was capable of measuring strain over 100 cycles, and was practically free from temperature influence, with a very low sensitivity of−0.0218Ω/◦
C in the range of 25 to 80◦C. The synthesized hybrid nanocomposite material exhibits both temperature self-compensating capabilities and good strain sensing behavior.
J. Compos. Sci.2019,3, 96 13 of 14
Funding:The research work is carried out under the “Landesinnovationsstipendium (100284169)” and the project “SenseCare (100270070)” supported by SAB and the European Social Fund (ESF).
Acknowledgments: We thank Nathanael Jöhrmann from the Professorship Materials and Reliability of Microsystems, Technische Universität Chemnitz for making the SEM imaging of the samples and Saravanan Palaniyappan from the Professorship of Composites and Material Compounds, Technische Universität Chemnitz for making the Raman spectroscopy analysis on the samples.
Conflicts of Interest:The authors declare no conflict of interest.
References
1. Bae, S.-H.; Lee, Y.; Sharma, B.K.; Lee, H.-J.; Kim, J.-H.; Ahn, J.-H. Graphene-based transparent strain sensor.
Carbon2013,51, 236–242. [CrossRef]
2. Hosseinzadeh, A.; Bidmeshkipour, S.; Abdi, Y.; Arzi, E.; Mohajerzadeh, S. Graphene based strain sensors: A comparative study on graphene and its derivatives.Appl. Surf. Sci.2018,448, 71–77. [CrossRef]
3. Tian, H.; Shu, Y.; Cui, Y.; Mi, W.; Yang, Y.; Xie, D.; Ren, T. Scalable fabrication of high-performance and flexible graphene strain sensors.Nanoscale2013,6, 699–705. [CrossRef] [PubMed]
4. Gong, S.; Wu, D.; Li, Y.; Jin, M.; Xiao, T.; Wang, Y.; Xiao, Z.; Zhu, Z.; Li, Z. Temperature-independent piezoresistive sensors based on carbon nanotube/polymer nanocomposite. Carbon2018, 137, 188–195. [CrossRef]
5. Bouhamed, A.; Müller, C.; Choura, S.; Kanoun, O. Processing and characterization of MWCNTs/epoxy nanocomposites thin films for strain sensing applications.Sens. Actuators A Phys.2017,257, 65–72. [CrossRef] 6. Zhao, J.; Dai, K.; Liu, C.; Zheng, G.; Wang, B.; Liu, C.; Chen, J.; Shen, C. A comparison between strain sensing behaviors of carbon black/polypropylene and carbon nanotubes/polypropylene electrically conductive composites.Compos. Part A Appl. Sci. Manuf.2013,48, 129–136. [CrossRef]
7. ¸Sanli, A.; Benchirouf, A.; Müller, C.; Kanoun, O. Piezoresistive performance characterization of strain sensitive multi-walled carbon nanotube-epoxy nanocomposites.Sens. Actuators A Phys.2017,254, 61–68. [CrossRef]
8. Sundararaman, V.; Rathod, V.T.; Mahapatra, D.R. Temperature compensation in CNT-composite distributed strain sensors. InSmart Sensor Phenomena, Technology, Networks, and Systems Integration; SPIE 9436; SPIE: Bellingham, WA, USA, 2015; p. 94360M.
9. Zymelka, D.; Togashi, K.; Ohigashi, R.; Yamashita, T.; Takamatsu, S.; Itoh, T.; Kobayashi, T. Printed strain sensor array for application to structural health monitoring.Smart Mater. Struct.2017,26, 105040. [CrossRef] 10. Bessonov, A.; Kirikova, M.; Haque, S.; Gartseev, I.; Bailey, M.J. Highly reproducible printable graphite strain
gauges for flexible devices.Sens. Actuators A Phys.2014,206, 75–80. [CrossRef]
11. De Venuto, D.; Carrara, S.; Cavallini, A.; De Micheli, G. pH sensing with temperature compensation in a Molecular Biosensor for drugs detection. In Proceedings of the 2011 12th International Symposium on Quality Electronic Design, Santa Clara, CA, USA, 14–16 March 2011; pp. 1–6.
12. Dinh, N.; Kanoun, O. Temperature-Compensated Force/Pressure Sensor Based on Multi-Walled Carbon Nanotube Epoxy Composites.Sensors2015,15, 11133–11150. [CrossRef] [PubMed]
13. Luo, S.; Liu, T. SWCNT/Graphite Nanoplatelet Hybrid Thin Films for Self-Temperature-Compensated, Highly Sensitive, and Extensible Piezoresistive Sensors.Adv. Mater. 2013,25, 5650–5657. [CrossRef] [PubMed] 14. Ghosh, S.; Nika, D.L.; Subrina, S.; Pokatilov, E.P.; Lau, C.N.; Balandin, A.A. Dimensional crossover of thermal
transport in few-layer graphene materials.Nat. Mater.2009,9, 555–558. [CrossRef] [PubMed]
15. Lee, W.; Kihm, K.D.; Ko, S.H. Thermal conductivity reduction of multilayer graphene with fine grain sizes.
JMST Adv.2019,1, 191–195. [CrossRef]
16. Osman, M.A.; Srivastava, D. Temperature dependence of the thermal conductivity of single-wall carbon nanotubes.Nanotechnology2001,12, 21. [CrossRef]
17. Kim, P.; Shi, L.; Majumdar, A.; McEuen, P.L. Thermal Transport Measurements of Individual Multiwalled Nanotubes.Phys. Rev. Lett.2001,87, 215502. [CrossRef] [PubMed]
J. Compos. Sci.2019,3, 96 14 of 14
19. Bokobza, L. Raman spectroscopic characterization of multiwall carbon nanotubes and of composites.
Express Polym. Lett.2012,6, 601–608. [CrossRef]