www.nonlin-processes-geophys.net/22/723/2015/ doi:10.5194/npg-22-723-2015
© Author(s) 2015. CC Attribution 3.0 License.
Multivariate localization methods for ensemble Kalman filtering
S. Roh1, M. Jun1, I. Szunyogh2, and M. G. Genton3
1Department of Statistics, Texas A&M University, College Station, TX 77843-3143, USA
2Department of Atmospheric Sciences, Texas A&M University, College Station, TX 77843-3148, USA 3CEMSE Division, King Abdullah University of Science and Technology, Thuwal 23955-6900, Saudi Arabia
Correspondence to: M. Jun ([email protected])
Received: 14 April 2015 – Published in Nonlin. Processes Geophys. Discuss.: 8 May 2015 Revised: 29 October 2015 – Accepted: 18 November 2015 – Published: 3 December 2015
Abstract. In ensemble Kalman filtering (EnKF), the small number of ensemble members that is feasible to use in a prac-tical data assimilation application leads to sampling variabil-ity of the estimates of the background error covariances. The standard approach to reducing the effects of this sampling variability, which has also been found to be highly efficient in improving the performance of EnKF, is the localization of the estimates of the covariances. One family of localization tech-niques is based on taking the Schur (element-wise) product of the ensemble-based sample covariance matrix and a cor-relation matrix whose entries are obtained by the discretiza-tion of a distance-dependent correladiscretiza-tion funcdiscretiza-tion. While the proper definition of the localization function for a single state variable has been extensively investigated, a rigorous defini-tion of the localizadefini-tion funcdefini-tion for multiple state variables that exist at the same locations has been seldom considered. This paper introduces two strategies for the construction of localization functions for multiple state variables. The pro-posed localization functions are tested by assimilating simu-lated observations experiments into the bivariate Lorenz 95 model with their help.
1 Introduction
The components of the finite-dimensional state vector of a numerical model of the atmosphere are defined by the spatial discretization of the state variables considered in the model. An ensemble-based Kalman filter (EnKF) data assimilation scheme treats the finite-dimensional state vector as a mul-tivariate random variable and estimates its probability dis-tribution by an ensemble of samples from the disdis-tribution. To be precise, an EnKF scheme assumes that the probability
distribution of the state is described by a multivariate normal distribution, and it estimates the mean and the covariance ma-trix of that distribution by the ensemble (sample) mean and the ensemble (sample) covariance matrix. The estimate of the mean and the estimate of the covariance matrix of the analy-sis distribution are obtained by updating the mean and the co-variance matrix of a background (prior) distribution based on the latest observations. The background distribution is resented by an ensemble of short-term forecasts from the pre-vious analysis time. This ensemble is called the background ensemble.
Because the number of background ensemble members that is feasible to use in a realistic atmospheric model is small, the estimates of weak covariances (the entries with small absolute values in the background covariance matrix) tend to have large relative estimation errors. These large rela-tive errors have a strong negarela-tive effect on the accuracy of an EnKF estimate of the analysis mean. The standard approach to alleviating this problem is to apply a physical-distance-dependent localization to the sample background covariances before their use in the state update step of the EnKF. In essence, localization is a method to introduce the empirical understanding that the true background covariances tend to rapidly decrease with distance into the state estimation pro-cess.
xa=xb+Ky◦−h xb
. (1)
The functionh(·)is the observation function, which maps the finite-dimensional state vector into observables. Thus,h(xb) is the ensemble mean of the prediction of the observations by the background. The matrix
K=PbHTHPbHT+R
−1
(2) is the Kalman gain matrix, where Pbis the background co-variance matrix, H is the linearization of h about xb, and R is the observation error covariance matrix. EnKF schemes usually avoid the explicit computation of the linearized ob-servation operator H by using approximations to PbHT and H PbHT that involve only the computation of h(xb) and
h(xb)(e.g., Houtekamer and Mitchell, 1998). The entryK ij
of K determines the effect of the jth observation on the
ith component of the analysis mean,xa. Under the standard assumption that the observation errors are uncorrelated, the matrix, R, is diagonal. Hence, the way the effect of the ob-servations is spread from the obob-servations to the different lo-cations and state variables is determined by Pband H. The sampling variability in the estimates of Pb affects the accu-racy of the information propagated in space and between the different state variables through the matrix products, PbHT and H PbHT. The goal of localization is to reduce the related effects of sampling variability on the estimates of K.
Over the years, many different localization methods have been proposed. Hamill et al. (2001), Houtekamer and Mitchell (1998, 2001), Hunt et al. (2007), Ott et al. (2004), and Whitaker and Hamill (2002) used localization functions which set the covariance to zero beyond a certain distance (localization radius). Jun et al. (2011) proposed a nonpara-metric statistical method to estimate the covariance. Ander-son (2007) used a hierarchical ensemble filter which esti-mates the covariance using an ensemble of ensemble filters. Bishop and Hodyss (2007, 2009a, b) adaptively determined the width of localization by computing powers of the sam-ple correlations. Buehner and Charron (2007) examined the spectral and spatial localization of error covariance. Ander-son and Lei (2013) and Lei and AnderAnder-son (2014) proposed an empirical localization function based on the output of an observing system simulation experiment.
The focus of the present paper is on the family of schemes that localize the covariances by taking the Schur (Hadamard) product of the sample background covariance matrix and a correlation matrix of the same size, whose entries are ob-tained by the discretization of a distance-dependent corre-lation function with local (compact) support (e.g., Hamill et al., 2001; Houtekamer and Mitchell, 2001; Whitaker and Hamill, 2002). Such a correlation function is usually called a
localization or taper function. The commonly used
localiza-tion funclocaliza-tions were introduced by Gaspari and Cohn (1999). Beyond a certain distance, all localization functions become
zero, forcing the filtered estimates of the background covari-ance between state variables at locations that are far apart in space to zero. This property of the filtered background co-variances can also be exploited to increase the computational efficiency of the EnKF schemes.
A realistic atmospheric model has multiple scalar state variables (e.g., temperature, coordinates of the wind vector, surface pressure, humidity). If a univariate localization func-tion, such as that described by Gaspari and Cohn (1999), is applied directly to a multivariate state vector (that is, the same localization function with the same localization pa-rameters is applied to each state variables) when the cross-covariances of multiple state variables is not negligible, it may introduce a new undesirable form of rank deficiency, despite the general significant increase of rank. The resulting localized background covariance matrix may not be positive definite. Because Pb is symmetric, its eigenvalues are real and non-negative, which implies that Pbis invertible only if it is also positive definite. The matrix Pb has non-negative eigenvalues and is invertible if it is positive definite. (An
n×nsymmetric matrix A is defined to be positive definite ifxTAx>0 for all nonzero vectorsx∈Rn.) Because the computation of the right-hand side of Eq. (2) does not re-quire the invertibility of Pb, the singularity of the localized Pbusually does not lead to a breakdown of the computations in practice. An ill-conditioned estimate of Pb, however, can degrade the conditioning (increase the condition number) of H PbHT+R, making the numerical computation of the right-hand side of Eq. (2) less stable. This motivates us to seek rigorously derived multivariate localization functions for en-semble Kalman filtering. As will be demonstrated, such rig-orously derived multivariate localization functions often pro-duce more accurate analyses than those that apply the same univariate localization functions to each scalar component of the state vector. Kang et al. (2011) also introduced a mul-tivariate localization method that zeros out covariances be-tween physically unrelated variables. Their primary motiva-tion for zeroing out such covariances, however, was to fil-ter apparent spurious covariances, rather than to preserve the positive definiteness of the background error covariance ma-trix.
different variables such as compactly supported correlation functions for multivariate Gaussian random fields.
The rest of the paper is organized as follows. Section 2 briefly describes EnKF and localization for the special case of two state variables. Section 3 describes the bivariate Lorenz 95 model we use to test our ideas. Section 4 sum-marizes the main results of the paper.
2 Methodology
2.1 Univariate localization
In principle, localization can be implemented by using fil-tered estimates of the background covariances rather than the raw sample covariances to define the matrix, Pb, used in the computation of K by Eq. (2). The filtered (localized) version of covariance matrix,ePb, is obtained by computing the Schur (element-wise) product:
e
Pb= ˆPb ◦ C, (3)
where C is a correlation matrix, which has the same dimen-sions as the sample covariance matrix,Pˆb. In practice, how-ever, the localization is often done by taking advantage of the fact that localization affects the analysis through PbHT and H PbHT, or, ultimately, through K. In particular – because a distance,d, can be defined for each entry,Kij, of K by the
distance between theith analyzed variable and thejth obser-vation – the simplest localization strategy is to set all entries,
Kij, that are associated with a distance longer than a
pre-scribed localization radius,R (d > R), to zero, while leav-ing the remainleav-ing entries unchanged (e.g., Houtekamer and Mitchell, 1998; Ott et al., 2004; Hunt et al., 2007).
Another approach is to localize PbHT and H PbHT by a tapering function (e.g., Hamill et al., 2001; Houtekamer and Mitchell, 2001). The usual justification for this approach is that the localized matrix products provide good approxima-tions of the products computed by using localized estimates of Pb. Note that PbHT is the matrix of background covari-ances between the state variables at the model grid points and at the observation locations, while H PbHT is the ma-trix of background covariances between the state variables at the observation locations. Thus, a distance can be associated with each entry of the two matrix products, which makes the distance-dependent localization of the two products possible. The approach becomes problematic, however, when h(·)is not a local function, which is the typical case for remotely sensed observations (Campbell et al., 2010).
We consider the situation where localization is applied di-rectly to the background error covariance matrix,Pˆb. Recall that the localized covariance matrix is expressed as in Eq. (3). In particular, C is a positive-definite matrix with strictly pos-itive eigenvalues, while the sample covariance matrix, Pˆb, may have zero eigenvalues (as it is only non-negative defi-nite). The localization in Eq. (3) helps to eliminate those zero
eigenvalues ofPˆband alleviates the related large relative es-timation errors. The positive definiteness of C ensures that localization does not introduce new zero eigenvalues in the process of eliminating the zero eigenvalues ofPˆb. The proper definition of the localization function that ensures that C is positive definite has been thoroughly investigated for the uni-variate case (N=1) in the literature (e.g. Gaspari and Cohn, 1999).
2.2 Multivariate localization
We now consider a model with multiple state variables (N >
1). For instance, we take a simple model based on the hydro-static primitive equations. This model solves the equations for the two horizontal components of wind, the surface pres-sure, the virtual temperature and a couple of atmospheric constituents. The state of the model is represented by the state vector,x=(x1,x2, . . . ,xN), wherexi,i=1, 2, . . . ,N,
represents the spatially discretized state of theith state vari-able in the model.
The sample background covariance matrix,Pˆb, can be par-titioned as
ˆ
Pb=
ˆ
Pb11 Pˆb12 · · · Pˆb1N
ˆ
Pb21 Pˆb22 · · · Pˆb2N
..
. ... . .. ...
ˆ
PbN1 PˆbN2 · · · PˆbN N
. (4)
The entries of the submatrices,Pˆbii,i=1, . . . ,N, are called the marginal covariances for theith state variable. In prac-tical terms if the ith state variable is the virtual tempera-ture, for instance, each diagonal entry ofPˆbii represents the sample variance for the virtual temperature at a given model grid point, while each off-diagonal entry ofPˆbii represents the sample covariances between the virtual temperatures at a pair of grid points. Likewise, the entries ofPˆbij,i6=j, are called the sample cross-covariances between the grid point values of theith and thejth state variables at pairs of loca-tions, where the two locations for an entry can be the same grid point.
We thus consider matrix-valued localization functions, ρ(d)= {ρij(d)}i,j=1,...,N, which are continuous functions of
d. The componentρij(d)ofρ(d)is the localization function
used for the calculation of the covariances included in the submatrix Pbij of Pb. Each entry of the localization matrix C is computed by considering the value of the appropriate component ofρ(d)for a particular pair of state variables and the separation distance,d, associated with the related entry ofPˆb.
In order to get a proper matrix-valued localization func-tion,ρ, a seemingly obvious approach to extend the results of Gaspari and Cohn (1999) would be to compute the entries of C based on a univariate correlation function for a multi-variate variable. That is, for the pair of state variablesiand
covari-ance matrix,Pˆbij, by multiplying a localization matrix from the same correlation function for alliandj. Formally, this would be possible because the distanced is uniquely defined for each entry ofPˆbthe same way in the multivariate case as in the univariate case. This approach, however, cannot guar-antee the positive definiteness of the resulting matrix, C. As a simple illustrative example, consider the situation where the discretized state vector has only two components that are defined by two different scalar state variables at the same lo-cation (e.g., the temperature and the pressure). In this case, if
nis the number of locations, the localization matrix for the two state variables together can be written as
C=
C0 C0 C0 C0
(5) independently of the particular choice of the localization function. HereC0is ann×nlocalization matrix from a uni-variate localization function. From Eq. (5), it is clear that
n eigenvalues of C are zero and the rank of C isn, while its dimensions are 2n×2n.
As in Eq. (2), although C is rank-deficient and thus so is the localized covariance matrixePb (and thusePb may be rank-deficient as well), we may still be able to calculate the inverse of HePbHT+R, as R is a diagonal matrix. The small-est eigenvalue of HePbHT+R is the smallest (positive) value of R, and thus the matrix, HePbHT+R, is still invertible and has positive eigenvalues. However, unless the diagonal ele-ments of R are large (which implies large observation error variance), the matrix HePbHT+R is seriously ill-conditioned and the computation of its inverse may be numerically unsta-ble. Therefore, the numerical stability of the computation of the inverse of the matrix heavily relies on the observation er-ror variance, which is an undesirable property.
We therefore propose two approaches to construct positive-definite (full rank) matrix-valued localization func-tions, ρ(d). The first proposed method takes advantage of the knowledge of a proper univariate localization function, e
ρ. Instead of using the same correlation function to local-ize multiple state variables, for a certain distance lag, we let ρ=
e
ρ·B, where B is anN×N symmetric, positive-definite matrix whose diagonal entries are 1. It can be easily verified that ρ is a matrix-valued positive-definite function, which makes it a valid multivariate localization function. For in-stance, in the hypothetical case where the two components of the state vector are two different state variables at the same location, making the choice
B=
1 β
β 1
(6) forβ, with|β|<1, leads to
C=
C0 βC0
βC0 C0
(7) rather than what is given in Eq. (5). Since the eigenvalues of the matrix B are 1±β >0, it can be easily verified that
the matrix in Eq. (7) is positive definite. For the case with more than two state variables (N≥3), the matrix B can be parametrized as B=L LT, where
L=
`1,1 0 · · · 0
`2,1 `2,2 · · · 0
..
. ... . .. 0
`N,1 `N,2 · · · `N,N
(8)
is a lower triangular matrix with the constraints that
i
P
j=1
`2i,j=1 and`i,i>0 for alli=1, . . . ,N. The constraints
are used to have the diagonal entries of B be 1. Other than these constraints, the elements of L can vary freely in order to guarantee the positive definiteness of B.
An attractive feature of this approach is that we can take advantage of any known univariate localization function to produce a multivariate localization function. However, the multivariate localization function from this approach is
sep-arable in the sense that the multivariate component (i.e., B)
and the localization function (i.e.,eρ) are factored. Another limitation of the approach is that the localization radius and decay rate are the same for each pair of state variables, leav-ing no flexibility to account for the potential differences in the correlation lengths and decay rate for the different state vector components.
The second proposed method takes advantage of the avail-ability of multivariate compactly supported functions from the spatial statistics literature. To the best of our knowledge, only a few papers have been published on this subject; one of them is Porcu et al. (2013). The function class they con-sidered was essentially a multivariate extension of the Askey function (Askey, 1973),f (d;ν,c)=(1−d
c) ν
+, withc,ν >0.
Here, x+=max(x, 0) for x∈R. For instance, a bivariate
Askey function, which is a special case of the results of Porcu et al. (2013), is given by (i,j =1, 2)
ρij(d;ν, c)=βij
1−d
c
ν+µij
+
, (9)
wherec >0,µ12=µ21≤12(µ11+µ22),ν≥ [12s] +2,βii=
1 (i=1, 2),β12=β21, and
|β12| ≤
0 (1+µ12)
0 (1+ν+µ12)
s
0 (1+ν+µ11) 0 (1+ν+µ22)
0 (1+µ11) 0 (1+µ22)
.
(10) Here,0(·)is the gamma function (e.g., Wilks, 2006) ands
is the dimension of the Euclidean space where the state vari-able is defined. If the state is defined at a particular instant on a grid formed by latitude, longitude, and height, thens=3. Here, [x] is the largest integer that is equal to or smaller than
0 10 20 30 40 50
0.0
0.2
0.4
0.6
0.8
1.0
Distance
Correlation
●
● Gaspari−Cohn Askey (ν=1) Askey (ν=2) Askey (ν=3) Askey (ν=4)
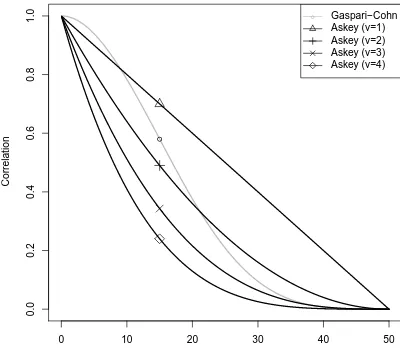
Figure 1. The Gaspari–Cohn covariance function with a
localiza-tion constantc=25 (support of 50) and the Askey covariance func-tionf (d;ν,c)=(1−d
c)ν+, with a support parameterc=50 and
various shape parameters.
from Eq. (10) that, if the scalars, µij, are chosen to be the
same for all values ofiandj, the condition onβ12forρto be valid is|β12| ≤1. (Note that the case of equality here, with the sameµij’s, reduces to the rank-deficient case where the
multivariate localization matrix has zero eigenvalues, simi-larly to the case ofβ=1 in Eq. 7.) For this choice, the second method is essentially the same as the first method with the Askey function set toeρ. The localization function given by Eq. (9) is more flexible than the functions of the first method with the Askey function set toeρbecauseµijcan be chosen to
be different for each pair of indexes,iandj. The localization length, however, is still the same for the different pairs of the state variables. The multivariate Askey function is formed by
ρij(d;ν, c)=cν+1B µij+1, ν+1
1−|d|
c
ν+µij+1
,
|d|< c (11)
and 0 otherwise, where ν≥(s+1)/2, µij =(µi+µj)/2,
andµi>0 for alli=1, . . . ,N. Here,Bis the beta function
(Porcu et al., 2013; Genton and Kleiber, 2015).
To illustrate the differences between the shape of the Gaspari–Cohn and the Askey functions, we show the Gaspari–Cohn function forc=25 and the univariate Askey function for c=50 and ν=1, . . . , 4 (Fig. 1). This figure shows that, for a given support, the Askey functions are nar-rower.
3 Experiments 3.1 The EnKF scheme
There are many different formulations of the EnKF update equations, which produce not only an updated estimate of the mean but also the ensemble of analysis perturbations that are added to the mean to obtain an ensemble of analyses. This ensemble of analyses serves as the ensemble of initial conditions for the model integration that produce the back-ground ensemble. In our experiments, we use the method of perturbed observations. It obtains the analysis mean and the ensemble of analysis perturbations by the equations
xa=xb+Ky−Hxb, (12)
x0ak=x0bk+Ky0ok−Hx0bk, (13) wherex0k,k=1, 2, . . . , M, are the ensemble perturbations andy0ok,k=1, 2, . . . ,M, are random draws from the proba-bility distribution of observation errors. As the notation sug-gests, we consider a linear observation function in our exper-iments. This choice is made for the sake of simplicity and limits the generality of our findings much less than the use of an idealized model of atmospheric dynamics.
For the case of multiple state variables, the ensemble members are considered to be in a single ensemble, that is, not being grouped into distinct subensembles.
3.2 The bivariate Lorenz model
Lorenz (1995) discussed the bivariate Lorenz 95 model, which mimics the nonlinear dynamics of two linearly cou-pled atmospheric state variables,XandY, on a latitude cir-cle. This model provides a simple and conceptually satis-fying representation of basic atmospheric processes but is not suitable for some atmospheric processes. The model 3 in Lorenz (2005) made it more realistic and suitable with sacri-fice of simplicity, by producing a rapidly varying small-scale activity superposed on the smooth large-scale waves. We use the Lorenz 95 model for simplicity in our following experi-ments.
In the bivariate Lorenz 95 model, the variable X is a “slow” variable represented by K discrete values,Xk, and
Y is a “fast” variable represented byJ×K discrete values. The governing equations are
dXk
dt = −Xk−1(Xk−2−Xk+1)−Xk−(ha/b)
J
X
j=1
Yj,k+F,
(14) dYj,k
dt = −abYj+1,k Yj+2,k−Yj−1,k
−aYj,k+(ha/b)Xk,
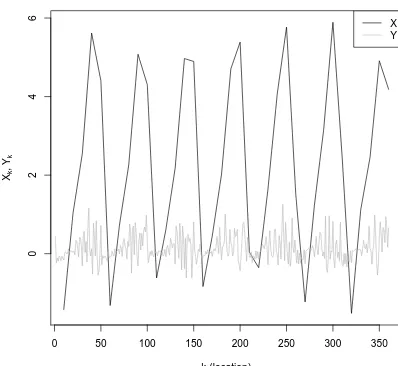
0 50 100 150 200 250 300 350 0 2 4 6 k (location) Xk , Yk X Y
Figure 2. A snapshot of the variablesX andY from a numerical integration of the system of Eqs. (14) and (15) withK=36,J=10, F=10,a=10,b=10, andh=2.
that is, Xk−K=Xk+K=Xk, and Yj,k−K=Yj,k+K=Yj,k.
In our experiments, K=36 and J=10. The parameter h
controls the strength of the coupling betweenXandY,a is the ratio of the characteristic timescales of the slow motion ofXto the fast motion ofY,bis the ratio of the characteristic amplitudes ofXtoY, andF is a forcing term. We choose the parameters to be a=10,b=10,F=10, andh=2. These values of the model parameters are equal to those originally suggested by Lorenz (1995), except for the value of the cou-pling coefficient h, which is twice as large in our case. We made this change in h to increase the covariances between the errors in the estimates of X and Y, which makes the model more sensitive to the choices of the localization pa-rameters. We use a fourth-order Runge–Kutta time integra-tion scheme with a time step of 0.005 nondimensional units, as Lorenz (1995) did. We define the physical distances be-tweenXk1 andXk2, betweenYj1,k1 andYj2,k2, and between
Xk1 andYj1,k2 by|10(k1−k2)|,|10(k1−k2)+j1−j2|, and
|10(k1−k2)−j1|, respectively. Figure 2 shows a typical state of the model for the selected parameters. The figure shows thatXtends to drive the evolution ofY: the hypothetical pro-cess represented byY is more active (its variability is higher) with higher values ofX.
3.3 Experimental design
Since the estimates of the cross-covariances play a particu-larly important role at locations where one of the variables is unobserved, we expect an improved treatment of the cross-covariances to lead to analysis improvements at locations where only one of the state variables is observed. This moti-vates us to consider an observation scenario in whichXand
Y are partially observed. The variableXis observed at 20 % of all locations, andY is observed at 90 % of the locations
● ● ● ● ● ● ● ● ● ● ● ● ● ● ● ● ● ● ● ● ● ● ● ● ● ● ● ● ● ● ● ● ● ● ● ● ● ● ● ● ● ● ● ● ● ● ● ● ● ● ● ● ● ● ● ● ● ● ● ● ● ● ● ● ● ● ● ● ● ● ● ● ● ● ● ● ● ● ● ● ● ● ● ● ● ● ● ● ● ● ● ● ● ● ● ● ● ● ● ● ● ● ● ● ● ● ● ● ● ● ● ● ● ● ● ● ● ● ● ● ● ● ● ● ● ● ● ● ● ● ● ● ● ● ● ● ● ● ● ● ● ● ● ● ● ● ● ● ● ● ● ● ● ● ● ● ● ● ● ● ● ● ● ● ●● ● ●●● ●●●● ● ●●●● ●●●●●●●● ●●●●●●●●●●●●●● ●●● ●●●●●●● ●●●● ●●●●●●●●●●● ●●●●●●●●●●●●●●●●●●●●●●●●●●●●●●●●●●●●●● ●●●● ●●●●●● ●●●●● ●●●● ●●●● ●●●●●●●●●●●●●●●●●●●●● ●●●●●● ● ●●● ● ● ●● ● ● ● ● ● ● ● ● ● X Y
Figure 3. For the partially observed case, locations of observations
ofXandY are indicated by the black dots and grey circles, respec-tively.
whereX is not observed. These observation locations for variablesX and Y are randomly chosen. Spatial locations of the partially observedX andY are illustrated in Fig. 3. The results from this experiment are compared to those from a control experiment, in which bothX andY are fully ob-served.
In the box plot figures in the next section, we compare the RMSE for four different localization schemes. We use the following notation to distinguish between them in the figures: 1. S1 – the bivariate sample background covariance is used
without localization;
2. S2 – same as S1 except that the cross-covariances be-tweenXandY are replaced by zeros;
3. S3 – a univariate localization function is used to filter the marginal covariances withinXandY, respectively, while the cross-covariances between X andY are re-placed by zeros;
4. S4 – one of the bivariate localization methods described in Sect. 2.2 is used to filter both the marginal and the cross-covariances.
In the experiments identified by S4, we consider two different bivariate localization functions: the first one is ρ(1)(·)= {βijρ(1)(·)}i,j=1,2, with βii=1 (i=1, 2) and
βij=β (i6=j), for some β such that |β|<1. We use the
fifth-order piecewise-rational function of Gaspari and Cohn (1999) to define the univariate correlation function, ρ(1), in the following form:
ρ(1)(d;c)=
−1
4(|d|/c)
5+1
2(d/c)
4+5
8(|d|/c)
3−5
3(d/c)
2+1, 0≤ |d| ≤c,
1 12(|d|/c)
5−1
2(d/c)
4+5
8(|d|/c)
3+5
3(d/c)
2−5(|d|/c)+4−2
3c/|d|, c≤ |d| ≤2c,
0, 2c≤ |d|.
(16)
This correlation function attenuates the covariances with in-creasing distance, setting all the covariances to zero beyond distance 2c. So this function has the support 2c. If|β|<1 and c is the same for both the marginal and the cross-covariances, the matrix-valued function,ρ(1), is positive
def-inite and of full rank. We test various values of the localiza-tion parameters candβ, and present the test results in the next section.
The second multivariate correlation function we consider, ρ(2), is the bivariate Askey function described in Sect. 2.2. In particular, we useµ11=0,µ22=2,µ12=1, andν=3. According to Eq. (10), for these choices of parameters, the one remaining parameter, β12, must be chosen such that
|β12| ≤0.79. 3.4 Results
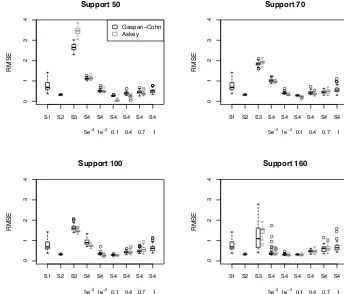
Figure 4 shows the distribution of RMSE for variableXfor different configurations of the localization scheme in the case where the state is only partially observed. This figure com-pares the Askey function and Gaspari–Cohn function which have the same support (localization radius), so setting all the covariances to zero beyond the same distance. We recall that, becauseXis much more sparsely observed thanY, we expect to see some sensitivity of the analyses ofXto the treatment
of the cross-covariance terms. The figure confirms this ex-pectation. A comparison of the results for configurations S1 and S2 suggests that ignoring the cross-covariances is a better strategy than using them without localization. This conclu-sion does not hold once a univariate localization is applied to the marginal covariances, as using configuration S3 produces worse results than applying no localization at all (S1).
Figure 4 also shows that the distribution of the state es-timation error is less sensitive to the choice of localization strategy for the larger values of support. Of all localization schemes, S4 withβ=0.1 performs best regardless of the lo-calization radius: the distribution of the state estimation er-ror is narrow with a mean value that is lower than those for the other configurations of the localization scheme. For this choice of localization scheme andβ, the Askey function pro-duces smaller errors than the Gaspari–Cohn function, partic-ularly for smaller localization radii.
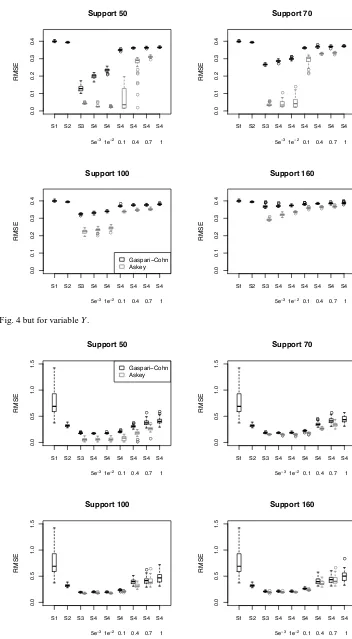
Figure 5 is the same as Fig. 4 but for variableYrather than for variableX. A striking feature of the results shown in this figure is that the Askey function clearly performs better than the Gaspari–Cohn function. Another obvious conclusion is that using a smaller localization radius (a lower value of sup-port) is clearly advantageous for the estimation ofY. This re-sult is not surprising, considering thatY is densely observed and its spatial variability is much higher than that ofX. In contrast to the results for variableX, configuration S3 pro-duces much more accurate estimates of variableY than do configurations S1 and S2. In addition, configuration S4 per-forms only slightly better, and only for the lowest value of support, than does configuration S3. The latter observations indicate that the marginal covariances play a more impor-tant role than do the cross-covariances in the estimation of the densely observedY. The proper filtering of the marginal covariances can thus greatly increase the accuracy of the es-timates ofY. In other words, the densely observedY is pri-marily estimated based on observations ofY. Hence, the low signal-to-noise ratio for the sample estimate of the marginal covariances forY greatly limits the value of the observations ofY at longer distances.
●
● ●
● ●
● ● ●●●
S1 S2 S3 S4 S4 S4 S4 S4 S4
0
1
2
3
4
Support 50
RMSE
●
●
● ● ● ● ●
● ●
5e−31e−2 0.1 0.4 0.7 1 Gaspari−Cohn Askey
● ● ●
●
●
● ●
● ● ● ●
S1 S2 S3 S4 S4 S4 S4 S4 S4
0
1
2
3
4
Support 70
RMSE
● ● ● ● ●
● ● ●
5e−31e−2 0.1 0.4 0.7 1
● ● ●
● ●
● ●
● ●●●● ● ● ●
S1 S2 S3 S4 S4 S4 S4 S4 S4
0
1
2
3
4
Support 100
RMSE ●●
● ● ● ●
● ●
●
5e−31e−2 0.1 0.4 0.7 1
● ● ● ●
● ●
● ● ● ●
● ●
● ●
S1 S2 S3 S4 S4 S4 S4 S4 S4
0
1
2
3
4
Support 160
RMSE
● ● ● ● ● ● ●
● ●
● ●
5e−31e−2 0.1 0.4 0.7 1
Figure 4. The box plot of RMSE for variableX in the case when the system is only partially observed. Results are shown for different localization strategies. For the definitions of localization strategies S1, S2, S3 and S4, see the text. The title of each panel indicates the localization radius (length of support). The lower and upper bounds of the box respectively give the 25th and 75th percentiles. The thick line going across the interior of the box gives the median. The whisker depends on the interquartile range (IQR), which is precisely equal to the vertical length of the box. The whiskers extend to the extreme values, which are no more than 1.5 IQR from the box. Any values that fall outside of the end points of whiskers are considered outliers, and they are displayed as circles. The numbers below S4 indicate the value ofβ. There is no box plot forβ=1 for the S4 with the Askey function, since the Askey function is not defined withβ=1 (|β| ≤0.79; see Sect. 3.3).
Figure 7 shows the distribution of the errors for variable
Y in the fully observed case. The best results are obtained by using a short localization radius with the Askey function, even though the variability of the error is relatively large in that case. The fact that localization strategies S3 and S4 per-form similarly well shows that the estimates of the cross-covariances do not play an important role in this case; that is,Xis primarily estimated based on observations ofX, and
Y is dominantly estimated based on observations ofY. We also investigated the performance of EnKF with a 500-member ensemble. The results for the 500-500-member ensemble are shown in Figs. 8 to 11. We use an inflation factor of 1.005 for 500 ensembles, because the optimal value of the inflation factor is typically smaller for a larger ensemble. The rank of the 500-member ensemble covariance matrix is significantly larger than that of the 20-member ensemble covariance ma-trix, as expected.
Figures 8 to 11 show that, overall, S4 still performs better than the other localization schemes regardless of the choice of localization radius, as in the case of the 20-member
en-semble. In particular, when observations are partially ob-served, S4 withβ=0.01 provides the smallest RMSE. The cross-correlation between X and Y, calculated using 500-member ensembles without assimilating any observation, varies from −0.4 to 0.4, which indicates that the cross-correlation between the two variables are not negligible. Therefore, improved treatment of cross-covariance tends to lead to an improved accuracy in the state estimation.
● ●
●
● ●
S1 S2 S3 S4 S4 S4 S4 S4 S4
0.0
0.1
0.2
0.3
0.4
Support 50
RMSE
● ●
● ●
● ●
● ● ● ● ●
●
● ●
● ● ● ●
●
5e−31e−2 0.1 0.4 0.7 1
● ● ●
● ●
S1 S2 S3 S4 S4 S4 S4 S4 S4
0.0
0.1
0.2
0.3
0.4
Support 70
RMSE
● ● ●
● ●
● ● ●
●
5e−31e−2 0.1 0.4 0.7 1
●
● ●
S1 S2 S3 S4 S4 S4 S4 S4 S4
0.0
0.1
0.2
0.3
0.4
Support 100
RMSE ●●●
●
5e−31e−2 0.1 0.4 0.7 1
Gaspari−Cohn Askey
● ●
● ●● ●●● ● ●●● ●
S1 S2 S3 S4 S4 S4 S4 S4 S4
0.0
0.1
0.2
0.3
0.4
Support 160
RMSE
● ●
● ● ●
● ●
5e−31e−2 0.1 0.4 0.7 1
Figure 5. Same as Fig. 4 but for variableY.
● ● ●
● ● ●●
● ●
● ●●
S1 S2 S3 S4 S4 S4 S4 S4 S4
0.0
0.5
1.0
1.5
Support 50
RMSE
● ● ● ● ● ●●
●
5e−31e−2 0.1 0.4 0.7 1
Gaspari−Cohn Askey
● ●
● ●
●
S1 S2 S3 S4 S4 S4 S4 S4 S4
0.0
0.5
1.0
1.5
Support 70
RMSE
● ●
● ●●● ●●●●
5e−31e−2 0.1 0.4 0.7 1
● ●
S1 S2 S3 S4 S4 S4 S4 S4 S4
0.0
0.5
1.0
1.5
Support 100
RMSE
● ● ●●●●
●
5e−3
1e−2 0.1 0.4 0.7 1
●
S1 S2 S3 S4 S4 S4 S4 S4 S4
0.0
0.5
1.0
1.5
Support 160
RMSE
●
● ●
● ●
5e−3
1e−2 0.1 0.4 0.7 1
● ● ●●
S1 S2 S3 S4 S4 S4 S4 S4 S4
0.0
0.1
0.2
0.3
0.4
Support 50
RMSE
●
● ● ●
● ● ● ● ● ●
5e−31e−2 0.1 0.4 0.7 1
● ●
● ●●
●
S1 S2 S3 S4 S4 S4 S4 S4 S4
0.0
0.1
0.2
0.3
0.4
Support 70
RMSE
● ● ●
● ●●
● ●
● ●●
● ●
● ● ● ● ●
●
5e−31e−2 0.1 0.4 0.7 1
● ●
S1 S2 S3 S4 S4 S4 S4 S4 S4
0.0
0.1
0.2
0.3
0.4
Support 100
RMSE
● ●●
● ● ●
● ●
5e−31e−2 0.1 0.4 0.7 1 Gaspari−Cohn Askey
S1 S2 S3 S4 S4 S4 S4 S4 S4
0.0
0.1
0.2
0.3
0.4
Support 160
RMSE
● ●
● ●●●
5e−31e−2 0.1 0.4 0.7 1
Figure 7. Same as Fig. 6 but for variableY.
● ● ● ● ● ● ● ● ● ●
● ● ●
● ●
S1 S2 S3 S4 S4 S4 S4 S4 S4
0.0
0.5
1.0
1.5
2.0
Support 50
RMSE
●
●
5e−31e−2 0.1 0.4 0.7 1 Gaspari−Cohn Askey
● ● ● ● ● ● ● ● ● ●
● ●
●
S1 S2 S3 S4 S4 S4 S4 S4 S4
0.0
0.5
1.0
1.5
2.0
Support 70
RMSE
● ●
5e−31e−2 0.1 0.4 0.7 1
● ● ● ● ● ● ● ● ● ●
● ● ●
●
● ● ●●
S1 S2 S3 S4 S4 S4 S4 S4 S4
0.0
0.5
1.0
1.5
2.0
Support 100
RMSE
●
5e−3
1e−2 0.1 0.4 0.7 1
● ● ● ● ● ● ● ● ● ●
● ● ● ●●
S1 S2 S3 S4 S4 S4 S4 S4 S4
0.0
0.5
1.0
1.5
2.0
Support 160
RMSE
● ●
5e−3
1e−2 0.1 0.4 0.7 1
● ● ● ● ● ● ● ● ● ●
● ● ● ● ●
S1 S2 S3 S4 S4 S4 S4 S4 S4
0.0
0.1
0.2
0.3
0.4
Support 50
RMSE
●
●
● ●●
5e−31e−2 0.1 0.4 0.7 1
● ● ● ● ● ● ● ● ● ●
● ● ●
●
S1 S2 S3 S4 S4 S4 S4 S4 S4
0.0
0.1
0.2
0.3
0.4
Support 70
RMSE
● ●
5e−31e−2 0.1 0.4 0.7 1
● ● ● ● ● ● ● ● ● ●
● ● ● ● ● ●
● ●
S1 S2 S3 S4 S4 S4 S4 S4 S4
0.0
0.1
0.2
0.3
0.4
Support 100
RMSE
●
5e−31e−2 0.1 0.4 0.7 1
● ● ● ● ● ● ● ● ● ●
● ● ● ●
S1 S2 S3 S4 S4 S4 S4 S4 S4
0.0
0.1
0.2
0.3
0.4
Support 160
RMSE
●
5e−31e−2 0.1 0.4 0.7 1 Gaspari−Cohn Askey
Figure 9. Same as Fig. 5 but for 500 ensemble members.
● ● ● ● ● ● ● ● ● ●
● ●
S1 S2 S3 S4 S4 S4 S4 S4 S4
0.0
0.2
0.4
0.6
Support 50
RMSE
5e−31e−2 0.1 0.4 0.7 1 Gaspari−Cohn Askey
● ● ● ● ● ● ● ● ● ●
● ●
S1 S2 S3 S4 S4 S4 S4 S4 S4
0.0
0.2
0.4
0.6
Support 70
RMSE
5e−31e−2 0.1 0.4 0.7 1
● ● ● ● ● ● ● ● ● ●
● ●
● ●
S1 S2 S3 S4 S4 S4 S4 S4 S4
0.0
0.2
0.4
0.6
Support 100
RMSE
5e−31e−2 0.1 0.4 0.7 1
● ● ● ● ● ● ● ● ● ●
● ● ● ●
●
● ● ●
●
●
S1 S2 S3 S4 S4 S4 S4 S4 S4
0.0
0.2
0.4
0.6
Support 160
RMSE
●
5e−31e−2 0.1 0.4 0.7 1
● ● ● ● ● ● ● ● ● ●
S1 S2 S3 S4 S4 S4 S4 S4 S4
0.0
0.1
0.2
0.3
0.4
Support 50
RMSE
5e−31e−2 0.1 0.4 0.7 1
● ● ● ● ● ● ● ● ● ●
S1 S2 S3 S4 S4 S4 S4 S4 S4
0.0
0.1
0.2
0.3
0.4
Support 70
RMSE
5e−31e−2 0.1 0.4 0.7 1
● ● ● ● ● ● ● ● ● ●
●
S1 S2 S3 S4 S4 S4 S4 S4 S4
0.0
0.1
0.2
0.3
0.4
Support 100
RMSE
5e−31e−2 0.1 0.4 0.7 1
● ● ● ● ● ● ● ● ● ●
● ●
●
S1 S2 S3 S4 S4 S4 S4 S4 S4
0.0
0.1
0.2
0.3
0.4
Support 160
RMSE
5e−31e−2 0.1 0.4 0.7 1 Gaspari−Cohn Askey
Figure 11. Same as Fig. 7 but for 500 ensemble members.
that the state estimation error is not sensitive but stable to the choice of localization radius.
Figures 10 and 11 show that the localization schemes S3 and S4 perform in a similar way, and obviously perform bet-ter than the other two localization schemes. This might imply that the cross-covariances do not have much influence on the state estimation in the fully observed case, once the covari-ances within each state variable are localized.
4 Discussion
The central argument of this paper is that applying a single localization function for the localization of covariances be-tween multiple state variables in an EnKF scheme may not sufficiently increase the rank of the estimate of the back-ground covariance matrix. In the light of this, we suggested two different approaches for the construction of positive-definite filtered estimates of the background covariance ma-trix. One of them takes advantage of the knowledge of a proper univariate localization function, whereas the other uses a multivariate extension of the Askey function. The re-sults of our numerical experiments show that a mathemat-ically proper localization function often leads to improved state estimates. The results of the numerical experiments also suggest that, of the two approaches we introduced, the one based on the Askey function produces more accurate state
es-timates than that based on the Gaspari–Cohn function. This fact, however, does not mean that the Askey function is al-ways superior to the Gaspari–Cohn function in other chaotic models or observation networks. Which correlation function is superior depends on what the true error correlation looks like.
Acknowledgements. The authors are grateful to the reviewers for valuable comments that significantly improved presenta-tion of the paper. M. Jun’s research was supported by NSF grant DMS-1208421, while I. Szunyogh’s research was supported by ONR Grant N000140910589. This publication is based in part on work supported by Award No. KUS-C1-016-04, made by King Abdullah University of Science and Technology (KAUST).
Edited by: Z. Toth
Reviewed by: two anonymous referees
References
Anderson, J. L.: Exploring the need for localization in ensemble data assimilation using a hierarchical ensemble filter, Physica D, 230, 99–111, 2007.
Askey, R.: Radial characteristic functions, technical report no. 1262, Mathematical Research Center, University of Wisconsin-Madison, Wisconsin-Madison, 1973.
Bishop, C. H. and Hodyss, D.: Flow adaptive moderation of spu-rious ensemble correlations and its use in ensemble based data assimilation, Q. J. Roy. Meteorol. Soc., 133, 2029–2044, 2007. Bishop, C. H. and Hodyss, D.: Ensemble covariances adaptively
lo-calized with ECO-RAP. Part 1: Tests on simple error models, Tellus A, 61, 84–96, 2009a.
Bishop, C. H. and Hodyss, D.: Ensemble covariances adaptively lo-calized with ECO-RAP. Part 2: A strategy for the atmosphere, Tellus A, 61, 97–111, 2009b.
Buehner, M. and Charron, M.: Spectral and spatial localization of background-error correlations for data assimilation, Q. J. Roy. Meteorol. Soc., 133, 615–630, 2007.
Campbell, W. F., Bishop, C. H., and Hodyss, D.: Vertical covariance localization for satellite radiances in ensemble Kalman filters, Mon. Weather Rev., 138, 282–290, 2010.
Du, J. and Ma, C.: Vector random fields with compactly supported covariance matrix functions, J. Stat. Plan. Infer., 143, 457–467, 2013.
Gaspari, G. and Cohn, S. E.: Construction of correlation functions in two and three dimensions, Q. J. Roy. Meteorol. Soc., 125, 723– 757, 1999.
Genton, M. G. and Kleiber, W.: Cross-covariance functions for mul-tivariate geostatistics (with discussion), Stat. Sci., 30, 147–163, 2015.
Hamill, T. M., Whitaker, J. S., and Snyder, C.: Distance-Dependent Filtering of Background Error Covariance Estimates in an En-semble Kalman Filter, Mon. Weather Rev., 129, 2776–2790, 2001.
Houtekamer, P. L. and Mitchell, H. L.: Data assimilation using an ensemble Kalman filter technique, Mon. Weather Rev., 126, 796– 811, 1998.
Houtekamer, P. L. and Mitchell, H. L.: A Sequential Ensemble Kalman Filter for Atmospheric Data Assimilation, Mon. Weather Rev., 129, 123–137, 2001.
Hunt, B. R., Kostelich, E. J., and Szunyogh, I.: Efficient data as-similation for spatiotemporal chaos: A local ensemble transform Kalman filter, Physica D, 230, 112–126, 2007.
Jun, M., Szunyogh, I., Genton, M. G., Zhang, F., and Bishop, C. H.: A Statistical Investigation of the Sensitivity of Ensemble-Based Kalman Filters to Covariance Filtering, Mon. Weather Rev., 139, 3036–3051, 2011.
Kang, J.-S., Kalnay, E., Liu, J., Fung, I., Miyoshi, T., and Ide, K.: “Variable localization” in an ensemble Kalman filter: Applica-tion to the carbon cycle data assimilaApplica-tion, J. Geophys. Res., 116, D09110, doi:10.1029/2010JD014673, 2011.
Kleiber, W. and Porcu, E.: Nonstationary Matrix Covariances: Com-pact Support, Long Range Dependence and Quasi-Arithmetic Constructions, Stoch. Env. Res. Risk. A., 29, 193–204, 2015. Lei, L. and Anderson, J.: Comparison of empirical localization
tech-niques for serial ensemble Kalman filters in a simple atmospheric general circulation model, Mon. Weather Rev., 141, 4140–4153, 2014.
Lorenz, E. N.: Predictability – A problem partly solved, vol. 1, ECMWF, Reading, Berkshire, UK, 1995.
Lorenz, E. N.: Designing chaotic models, J. Atmos. Sci., 62, 1574– 1587, 2005.
Ott, E., Hunt, B. R., Szunyogh, I., Zimin, A. V., Kostelich, E. J., Corazza, M., Kalnay, E., Patil, D. J., and Yorke, J. A.: A local ensemble Kalman filter for atmospheric data assimilation, Tel-lus A, 56, 415–428, 2004.
Porcu, E., Daley, D. J., Buhmann, M., and Bevilacqua, M.: Radial basis functions with compact support for multivariate geostatis-tics, Stoch. Env. Res. Risk. A., 27, 909–922, 2013.
Whitaker, J. S. and Hamill, T. M.: Ensemble data assimilation with-out perturbed observations, Mon. Weather Rev., 130, 1913–1924, 2002.
Wilks, D. S.: Statistical methods in the atmospheric sciences, Aca-demic Press, Amsterdam, 2006.
Zhang, H. and Du, J.: Covariance Tapering in Spatial Statistics, edited by: Mateu, J. and Porcu, E., Graficas Castaen, s.l., Spain,