www.the-cryosphere.net/9/1523/2015/ doi:10.5194/tc-9-1523-2015
© Author(s) 2015. CC Attribution 3.0 License.
Meteorological, elevation, and slope effects
on surface hoar formation
S. Horton1, M. Schirmer1,a, and B. Jamieson1
1Department of Civil Engineering, University of Calgary, Alberta, Canada
acurrently at: Centre for Hydrology, University of Saskatchewan, Saskatchewan, Canada
Correspondence to: S. Horton ([email protected])
Received: 30 January 2015 – Published in The Cryosphere Discuss.: 23 March 2015 Revised: 14 June 2015 – Accepted: 25 July 2015 – Published: 7 August 2015
Abstract. Failure in layers of buried surface hoar crystals (frost) can cause hazardous snow slab avalanches. Surface hoar crystals form on the snow surface and are sensitive to micro-meteorological conditions. In this study, the role of meteorological and terrain factors was investigated for three layers of surface hoar in the Columbia Mountains of Canada. The distribution of crystals over different elevations and as-pects was observed on 20 days of field observations during a period of high pressure. The same layers were modelled over simplified terrain on a 2.5 km horizontal grid by forcing the snow cover model SNOWPACK with forecast weather data from a numerical weather prediction model. Modelled surface hoar growth was associated with warm air temper-atures, high humidity, cold surface tempertemper-atures, and low wind speeds. Surface hoar was most developed in regions and elevation bands where these conditions existed, although strong winds at high elevations caused some model discrep-ancies. SNOWPACK simulations on virtual slopes systemat-ically predicted smaller surface hoar on south-facing slopes. In the field, a complex combination of surface hoar and sun crusts were observed, suggesting the simplified model did not adequately resolve the surface energy balance on slopes. Overall, a coupled weather–snow cover model could benefit avalanche forecasters by predicting surface hoar layers on a regional scale over different elevation bands.
1 Introduction
Surface hoar (frost) is a type of ice crystal that forms on the snow surface (Fierz et al., 2009). Failure in layers of buried surface hoar crystals can release hazardous snow slab avalanches. The formation of surface hoar crystals is sensi-tive to micro-meteorological conditions, which makes their distribution in complex terrain difficult to predict.
2012; Shea and Jamieson, 2011) and shading by terrain and vegetation (Lutz and Birkeland, 2011).
The meteorological factors that affect surface hoar forma-tion apply over various spatial scales (Schweizer and Kro-nholm, 2007). Layers often form across entire mountain ranges (>100 km) during periods of high pressure (Haegeli and McClung, 2003), and vary at regional scales (10 km) due to local air masses and clouds. At basin or drainage scales (1 km), layers vary with slope aspect, incline, and elevation due to variations in wind, radiation, and valley clouds (Fe-ick et al., 2007; Colbeck et al., 2008; Schweizer and Kron-holm, 2007). At a slope scale (100 m), layers can vary due to vegetation, ground roughness, and local winds (Bellaire and Schweizer, 2011). In Canada, public avalanche forecast-ers communicate the distribution of hazardous surface hoar layers for general elevation and aspect bands on a regional scale.
Surface hoar layers could potentially be mapped with spa-tial weather and terrain inputs. The SNOWPACK model has been applied on a grid in complex terrain with downscaled weather inputs in Alpine3D (Lehning et al., 2006); how-ever, gridded surface hoar formation with such a model has not been verified. Helbig and van Herwijnen (2012) devel-oped a gridded surface hoar model using terrain-based rules (i.e. sky view and sun exposure), but did not account for me-teorological conditions. Meme-teorological data from a regional scale numerical weather prediction (NWP) model have been used to model surface hoar (Bellaire et al., 2011, 2013; Bel-laire and Jamieson, 2013; Horton et al., 2014). Forecast data from an NWP model with 15 km resolution were in-put into SNOWPACK, and the resulting surface hoar lay-ers were verified with study plot observations from Mt Fi-delity in Glacier National Park, Canada. While the results were promising, they did not take advantage of the spatially continuous data available from NWP models. Furthermore, Schirmer and Jamieson (2015) suggest high-resolution NWP models (e.g. 2.5 km) offer large improvements over regional models in complex terrain.
The goal of this study was to investigate how meteoro-logical and terrain factors influence surface hoar formation. Surface hoar layers were spatially modelled over simplified terrain by forcing SNOWPACK with weather data from a high-resolution NWP model (2.5 km horizontal resolution). The model results are compared to field observations to ex-plain when and where surface hoar formed, and to determine whether hazardous layers could be predicted with a coupled weather–snow cover model.
2 Methods 2.1 Field studies
Field studies were done in the Columbia Mountains of British Columbia at Glacier National Park (GNP) and around
Park boundary Field campaign HRDPS grid point Weather station
GNP Blue River
20 km
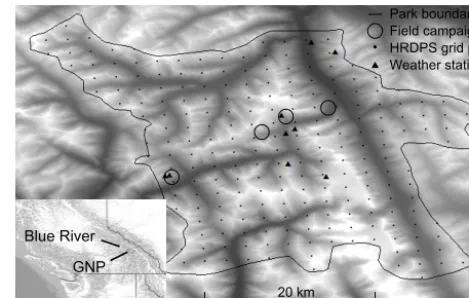
Figure 1. Map of Glacier National Park (GNP) with the locations of field campaigns, High-Resolution Deterministic Prediction Sys-tem (HRDPS) grid points, and weather stations (30 m digital eleva-tion model basemap from DMTI Spatial). Inset map shows south-western Canada and the location of GNP and Blue River.
the town of Blue River (Fig. 1). The mountains have a tran-sitional snow climate with deep snowpacks and critical lay-ers of surface hoar and melt–freeze crusts (Haegeli and Mc-Clung, 2003). Valleys are densely forested up to treeline el-evations around 2000 m, with expansive alpine and glaciated regions above treeline, and rocky peaks reaching elevations greater than 3000 m.
The distribution of surface hoar crystals was observed dur-ing 20 field campaigns between 15 January and 10 Febru-ary 2014. Three layers formed over this period of relatively high pressure. Snowfall buried the layers on 22, 29 January, and 10 February, which are the dates used to identify each layer. A typical field campaign consisted of travelling by ski from the valley bottom to the top of the treeline (between el-evations of 1000 and 2300 m). Between 5 and 15 sites were chosen along the routes to sample surface hoar over a range of elevations and slope aspects.
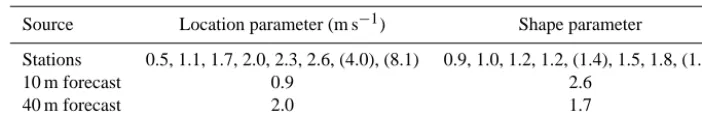
Table 1. Weibull distribution parameters fitted to station and forecast wind speeds (ridgetop station values in brackets).
Source Location parameter (m s−1) Shape parameter
Stations 0.5, 1.1, 1.7, 2.0, 2.3, 2.6, (4.0), (8.1) 0.9, 1.0, 1.2, 1.2, (1.4), 1.5, 1.8, (1.9)
10 m forecast 0.9 2.6
40 m forecast 2.0 1.7
2.2 Numerical weather forecasts
Numerical weather data were collected from 225 grid points in GNP and 168 grid points around Blue River (Fig. 1). The data were produced by the High-Resolution Determin-istic Prediction System (HRDPS) operated by Environment Canada (Erfani et al., 2005). The HRDPS, also known as GEM-LAM, is a numerical weather prediction model with a 2.5 km horizontal grid. The model is initiated four times a day to provide operational forecasts over southwestern Canada. Time series were produced with the data from the 06:00 and 18:00 coordinate universal time initiations, and in-cluded air temperature, relative humidity, wind speed, wind direction, incoming shortwave radiation, incoming longwave radiation, and precipitation. The first 6 h of forecast val-ues were neglected to minimize errors from model spin-up (Weusthoff et al., 2010). Air temperature and humidity were forecast for 2 m above ground, while wind speed and wind direction were forecast for 10 and 40 m above ground.
Forecasts were compared with air temperature, rela-tive humidity, and wind speed measurements from auto-matic weather stations in GNP (Fig. 1). The park operates nine automatic weather stations at elevations relevant for avalanche forecasting along the Trans-Canada Highway cor-ridor (Schweizer et al., 1998). The 10 and 40 m wind speeds were compared because operational experience found that 10 m HRDPS wind speeds were unreliable in GNP. The fore-cast wind speeds were fit to two-parameter Weibull distri-butions (Table 1), where the location parameter describes the centre of the distribution and the shape parameter de-scribes the spread (Stull, 2014, p. 645). Weibull distributions were also fit to wind speed measurements from eight sta-tions with anemometers roughly 10 m above ground. Two of the stations were located on wind exposed ridgetops, while the other six were relatively sheltered. The 10 m forecasts winds were lighter and did not have as much spread as the station measurements (i.e. smaller location parameter and larger shape parameter). The 40 m forecast winds had a sim-ilar location parameter to the sheltered stations (2.0 m s−1) and a more realistic shape parameter. Accordingly, surface hoar was modelled with 40 m HRDPS winds, as they better represented typical 10 m speeds at sheltered sites.
2.3 Surface hoar model
Surface hoar formation was modelled with the Swiss snow cover model SNOWPACK (version 3.2.1). The model uses
weather inputs to reconstruct the structural, thermal, and me-chanical properties of the snow cover over the winter sea-son (Lehning et al., 2002). Layers of surface hoar are added by the deposition of water vapour onto the surface. Depo-sition is driven by the turbulent flux of latent heat, which is modelled with a bulk method. The bulk method assumes down-gradient fluxes proportional to a turbulent transfer co-efficient. The transfer coefficient is calculated at each time step using wind speed and assuming neutral atmospheric sta-bility (as verified by Stoessel et al., 2010). Surface hoar can be removed from the surface by vapour fluxes away from the surface, surface melting, or when wind speeds surpass a user-defined threshold (3.5 m s−1). Hachikubo (2001) found vapour deposition rates decreased at wind speeds greater than 3.5 m s−1. Crystal size was calculated from the deposit mass by assuming a layer density of 30 kg m−3 (Horton et al., 2014).
SNOWPACK simulations were done with forecast weather data from HRDPS grid points in GNP and around Blue River. Flat field simulations at each grid point were used to map the regional distribution of surface hoar lay-ers (Sect. 3.3.1) and examine the effect of grid point ele-vation (Sect. 3.3.2). Virtual slope simulations were done at each grid point to model the predominant effects of slope incline and aspect (Sect. 3.3.3). Slope simulations in SNOW-PACK adjust the incoming shortwave and longwave radia-tion based on slope geometry (Helbig et al., 2010), while other weather inputs remain constant. Sky view factor, terrain shading, and effects of wind direction such as snow transport are neglected. To illustrate the effects of slope incline, vir-tual slope simulations were done on north- and south-facing slopes with inclines of 15, 30, and 45◦. To illustrate the ef-fects of aspect, simulations were done on 30◦slopes in eight cardinal directions.
2.4 Analysis of meteorological inputs
(i.e. hourly crystal growth rate). Growth rates were positive when crystals increased in size and were negative when crys-tals shrank or disappeared. The pooled set of meteorological inputs and modelled growth rates consisted of 448 651 time steps with positive growth rates, 189 269 time steps with neg-ative growth rates, and 32 126 time steps with no change in crystal size. Modelled growth rates were compared to input values of air temperature, relative humidity, wind speed, and incoming longwave radiation, along with modelled values of snow surface temperature.
3 Results and discussion 3.1 Meteorological effects
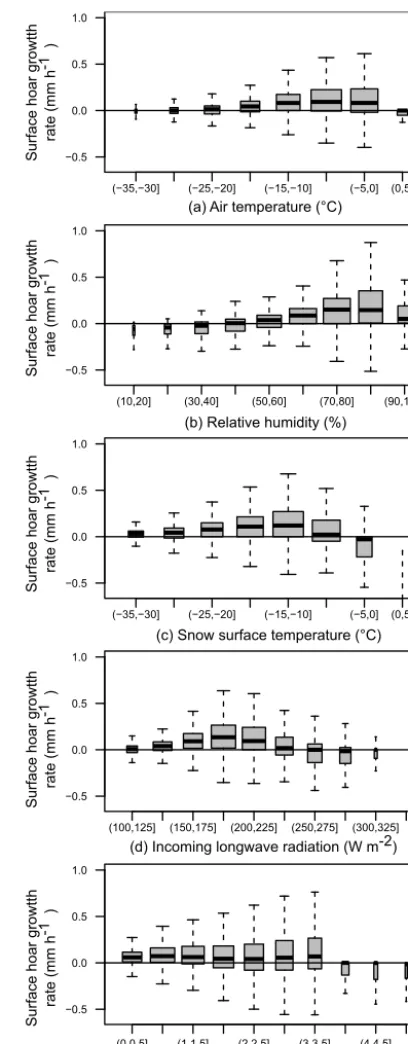
The distribution of surface hoar layers depends on changes in meteorological conditions over space and time. In this section, the meteorological conditions associated with sur-face hoar formation modelled by SNOWPACK are summa-rized. The amount of water vapour available to form surface hoar depended on both relative humidity and air tempera-ture, as cold air held less moisture (i.e. lower absolute humid-ity). The highest modelled growth rates were associated with air temperatures between −10 and 0◦C (Fig. 2a), with less growth at colder air temperatures. The highest growth rates were also associated with relative humidity between 70 and 90 % (Fig. 2b). While high relative humidity should favour surface hoar growth, values greater than 90 % may have oc-curred during periods with more cloud cover and therefore less radiative cooling. Surface hoar shrinkage was common when the relative humidity was less than 50 %.
Cold surface temperatures also favour surface hoar growth, such as on nights with low incoming longwave ra-diation when radiative cooling is dominant (Slaughter et al., 2011). The highest surface hoar growth rates were associ-ated with incoming longwave radiation between 175 and 200 W m−2 and modelled surface temperatures between
−20 and−10◦C (Fig. 2c–d). Growth may have slowed dur-ing periods with less incomdur-ing longwave radiation and colder surface temperatures because the absolute humidity of the air would likely be lower. Surface temperatures above−5◦C were associated with surface hoar shrinkage, as the vapour fluxes may have been away from the surface or the crystals would melt at 0◦C.
Wind speeds below 1.5 m s−1 typically resulted in sur-face hoar growth (Fig. 2e), while wind speeds between 1.5 and 3.5 m s−1 resulted in either growth or shrinkage. Since SNOWPACK calculates both sensible and latent heat fluxes, the snow surface is likely to warm from sensible heat transport at higher wind speeds (Hachikubo and Aki-taya, 1997), which could shrink surface hoar. Surface hoar never grew in the model when the wind speed exceeded the 3.5 m s−1 threshold. While the concept of a threshold wind speed agrees with field experience, the interactions between
(−35,−30] (−25,−20] (−15,−10] (−5,0] (0,5] −0.5
0.0 0.5 1.0
(10,20] (30,40] (50,60] (70,80] (90,100] −0.5
0.0 0.5 1.0
(−35,−30] (−25,−20] (−15,−10] (−5,0] (0,5] −0.5
0.0 0.5 1.0
(100,125] (150,175] (200,225] (250,275] (300,325] −0.5
0.0 0.5 1.0
(0,0.5] (1,1.5] (2,2.5] (3,3.5] (4,4.5] −0.5 0.0 0.5 1.0 S ur face h oa r gr ow tth rate ( m m h
-1 )
S ur face h oa r gr ow tth rate ( m m h
-1 )
S ur face h oa r gr ow tth rate ( m m h
-1 )
S ur face h oa r gr ow tth rate ( m m h
-1 )
S ur face h oa r gr ow tth rate ( m m h
-1 )
(a) Air temperature (°C)
(b) Relative humidity (%)
(c) Snow surface temperature (°C)
(d) Incoming longwave radiation (W m-2)
(e) Wind speed (m s-1)
A
ir t
em
pe
ratur
e
(°
C)
Abbott (2130 m) Fidelity (1905 m) Rogers Pass (1305 m)
Alpine (> 2200 m) Treeline (1800 - 2200 m) Below treeline (< 1800 m)
0
-10
-20
A
ir t
em
pe
ratur
e
(°
C) 0
-10
-20
(a) Stations
(b) HRDPS
15 Jan 20 Jan 25 Jan 30 Jan 4 Feb 9 Feb
Figure 3. Air temperatures (a) measured at stations and (b) forecast by the High-Resolution Deterministic Prediction System (HRDPS) in Glacier National Park. Forecasts were grouped by grid point elevation, with 35 alpine points (>2200 m), 92 treeline points (1800 to 2200 m), and 98 below treeline grid points (<1800 m). The median temperature in each band is shown. Surface hoar crystals were buried on 22, 29 January, and 10 February as indicated by the vertical dashed lines.
surface hoar and strong winds should be investigated further, ideally under controlled laboratory settings.
Modelled surface hoar growth was associated with mete-orological conditions that agree with common field experi-ence, such as during clear and calm nights (Slaughter et al., 2011). The largest growth rates occurred with warm temper-atures, humid air, cold surface tempertemper-atures, and low wind speeds. However, these conditions did not always coexist, as interactions between meteorological inputs appeared to limit growth in some cases. For example, cold temperatures and clear skies limited the potential moisture supply. Such inter-actions are evident in Fig. 2 and likely affect the distribution of surface hoar layers, as meteorological conditions vary over complex terrain.
Whether using measured or forecast weather data, errors in the meteorological inputs would affect modelled surface hoar formation. The impact would depend on the ity of the model, which would likely be similar to sensitiv-ity analysis of Slaughter (2010, p. 176), who found modelled vapour fluxes were sensitive to incoming longwave radiation, air temperature, wind speed, and relative humidity. The fol-lowing section evaluates the forecast meteorological inputs.
3.2 Weather forecast evaluation
Weather conditions measured at stations in GNP during a high-pressure period were compared to HRDPS forecasts at corresponding elevation bands in Figs. 3–5. Measured air temperatures were warmer when the 22 and 29 Jan-uary layers formed than when the 10 FebrJan-uary layer formed (Fig. 3). Forecast air temperatures had similar temporal trends. Weather station measurements suggest the atmo-sphere was stable during the study period, with obvious tem-perature inversions between 17 and 22 January and between 6 and 9 February. Lapse rates forecast by the HRDPS were
close to neutral for most of the period (median value of
−6.0◦C km−1), although they were slightly weaker during the inversions (−3 to 5◦C km−1). It appears the HRDPS un-derestimated cool air pooling in the valleys, which agrees with Vionnet et al. (2014) who found HRDPS forecasts had warm biases in valleys and cold biases in the mountains. Cold air pooling could slow surface hoar growth in valley bottoms by reducing the moisture content of the air and by causing katabatic winds (Feick et al., 2007).
Relative humidity measured in GNP fluctuated between 20 and 80 % during clear weather periods and were higher during precipitation events on 15, 22, and 29 January, and 10 February (Fig. 4). Forecast humidity was typically drier than measured values, but had similar temporal trends. Dry biases have been reported in NWP forecast verifications over western Canada (Bellaire et al., 2011; Mailhot et al., 2012; Vionnet et al., 2014). Valley clouds were observed in GNP between 23 to 25 January and may explain some of the dry biases. Valley clouds likely caused higher humidity at the stations, but forecast humidity remained low, suggest-ing the HRDPS did not predict valley clouds (Mo et al., 2012). Valley clouds affect surface hoar formation by provid-ing moisture near the top of the cloud (Colbeck et al., 2008), but this process would be difficult to model without precise and accurate cloud forecasts, and thus was probably not re-solved. Relative humidity measured at the stations typically decreased with elevation, while forecast humidity increased slightly (Fig. 4). In both cases, the absolute humidity usually decreased because of colder air temperatures.
Re
la
tive hu
m
id
ity
(%)
Abbott (2130 m) Fidelity (1905 m) Rogers Pass (1305 m)
Alpine (> 2200 m) Treeline (1800 - 2200 m) Below treeline (< 1800 m)
Re
la
tive hu
m
id
ity
(%)
100
75
50
25
100
75
50
25
(a) Stations
(b) HRDPS
15 Jan 20 Jan 25 Jan 30 Jan 4 Feb 9 Feb
Figure 4. Relative humidity (a) measured at stations and (b) forecast by the High-Resolution Deterministic Prediction System (HRDPS) in Glacier National Park. Same format as Fig. 3.
Wind
sp
ee
d (
m
s
-1) Abbott (2130 m)
Fidelity (1905 m) Rogers Pass (1305 m)
Alpine (> 2200 m) Treeline (1800 - 2200 m) Below treeline (< 1800 m)
(a) Stations
(b) HRDPS 10
5
0
Wind
sp
ee
d (
m
s
-1 ) 10
5
0
15 Jan 20 Jan 25 Jan 30 Jan 4 Feb 9 Feb
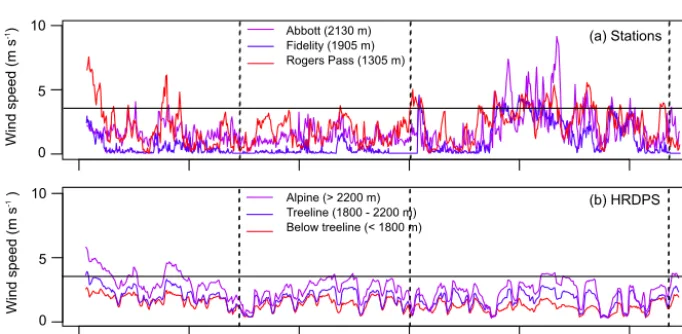
Figure 5. Wind speeds (a) measured at stations and (b) forecast by the High-Resolution Deterministic Prediction System (HRDPS) in Glacier National Park. The 3.5 m s−1threshold is shown with a horizontal line. Same format as Fig. 3.
While forecast wind speeds usually increased with elevation, measured winds were primarily influenced by local topogra-phy. For example, the low-elevation station at Rogers Pass experiences gap winds and was often windier than sheltered stations at higher elevations. Such local effects were not ex-pected to be resolved with wind forecasts on a 2.5 km hori-zontal grid (Vionnet et al., 2014). Previous studies required grid resolutions on the order of 5 to 100 m to resolve phenom-ena in complex terrain such as thermal winds (Chow et al., 2006; Mott et al., 2014) and ridgetop recirculations (Rader-schall et al., 2008). Furthermore, even when these phenom-ena are resolved, they cannot be forecast without precise ini-tial conditions. Feick et al. (2007) commented that the inabil-ity to forecast wind at relevant scales is one of the biggest limitations in forecasting surface hoar size. In recognition of this limitation, HRDPS wind speeds should be considered re-gional rather than local forecasts.
While not shown, high-elevation HRDPS grid points also had more precipitation, less incoming longwave radiation,
and more incoming shortwave radiation. This resulted in large diurnal radiation fluctuations and colder snow surface temperatures at high-elevation grid points. Radiation fore-casts were not verified with station measurements, but agree with common experience (Liston and Elder, 2006).
3.3 Surface hoar distribution
1400 1600
1600
1600
1600
1800
1800
1800
1800 2000
2000
2000
2200
2200 2200
2400
30
20
10
0 S
ur
face
h
oa
r
si
ze (
m
m
)
1400 1600
1600
1600
1600
1800
1800
1800
1800 2000
2000
2000
2200
2200 2200
2400
1400 1600
1600
1600
1600
1800
1800
1800
1800 2000
2000
2000
2200
2200 2200
2400
(a) 22 January (b) 29 January (c) 10 February
Figure 6. Modelled surface hoar sizes at High-Resolution Deterministic Prediction System (HRDPS) grid points in Glacier National Park on (a) 22 January, (b) 29 January, and (c) 10 February. Black contour lines show the topography of Glacier National Park resolved by the model.
15 Jan 20 Jan 25 Jan 30 Jan 4 Feb 9 Feb
Figure 7. Modelled surface hoar sizes at High-Resolution Deterministic Prediction System (HRDPS) grid points grouped by elevation bands in Glacier National Park. Same format as Fig. 3.
3.3.1 Regional effects
Surface hoar modelled on the HRDPS grid was clustered in sub-regions in GNP (Fig. 6). For example, surface hoar was only modelled in the west end of the park on 22 January and was larger in the west end on 29 January. Regional patterns usually corresponded with patterns in the meteorological in-puts. In this case, forecast humidity was typically higher in the west due to orographic lift, which caused more surface hoar growth. Similarly, regions with strong winds or above-freezing temperatures had less surface hoar.
While field campaigns were done in different sub-regions, it was difficult to get a single representative crystal size to compare with the model. In general, the field campaigns found larger surface hoar in the west end of the park. For example, on 21 January, the largest surface hoar observed in the west end of the park (Mt Fidelity) was 15 mm, but the fol-lowing day the largest surface hoar in the centre of the park (Hermit Mountain) was only 8 mm. Similarly, on 28 January the largest surface hoar observed on Mt Fidelity was 18 mm, compared to 14 mm the previous day in the centre of the park (Ursus Minor Mountain). On 6 February, surface hoar up to 12 mm was observed in the east end of the park (Tup-per Mountain), compared to 8 mm the following day in the centre of the park (Ursus Minor Mountain). While only point observations, the field campaigns support some of the trends in Fig. 6 and suggest layers of surface hoar could be mapped on a regional scale.
Given the clustering of weather inputs and modelled sur-face hoar, the HRDPS probably did not resolve processes at 2.5 km resolution (i.e. basin-scale). Semi-variogram
analy-sis (not shown) found forecast variables were usually auto-correlated up to 20 km away. This distance may correspond to the effective resolution of the HRDPS, or perhaps the ac-tual scale of weather systems. Variations within sub-regions primarily resulted from elevation differences between neigh-bouring grid points. Accordingly, field observations are com-pared to surface hoar modelled at HRDPS grid points within a 10 km radius in the upcoming sections (roughly 50 grid points).
3.3.2 Elevation effects
Surface hoar size (mm)0 10 20 1000
1500 2000 2500
Surface hoar size (mm)0 10 20 Surface hoar size (mm)0 10 20 Surface hoar size (mm)0 10 20
E
le
vatio
n (
m
)
(a) St. Anne / 21 Jan (b) St. Anne / 27 Jan (c) Ursus Minor / 27 Jan (d) Ursus Minor / 7 Feb
Figure 8. Surface hoar sizes observed over different elevations on Mont-Sainte-Anne and Ursus Minor Mountain (red dots). Black dots show the sizes modelled at grid points within a 10 km radius of the mountains, and the moving average with a black line.
15 Jan 20 Jan 25 Jan 30 Jan 4 Feb 9 Feb
S
ur
face
h
oa
r
size
(
m
m
)
20
10
0
North 45° North 30° North 15° Flat South 15° South 30° South 45°
Figure 9. Modelled surface hoar sizes on north- and south-facing slopes with various inclines. Simulations were done with SNOWPACK using forecasts from the High-Resolution Deterministic Prediction System at 92 grid points at treeline elevations (1800 to 2200 m) in Glacier National Park. The median crystal sizes for each slope are shown.
Surface hoar was observed over a range of elevations in the flat fields on Mont-Sainte-Anne near Blue River and Ursus Minor Mountain in GNP. Observed crystal sizes on Mont-Sainte-Anne typically decreased with elevation on 21 Jan-uary (Fig. 8a). Strong winds appeared to limit growth at the high-elevation sites, as signs of recent wind transport were evident in the field. At nearby HRDPS grid points, large forecast wind speeds limited surface hoar formation at many points, resulting in little to no modelled surface hoar. A sub-set of the grid points were not affected by strong winds and modelled crystal sizes increased with elevation. The choice of the 3.5 m s−1threshold wind speed clearly impacted which grid points had modelled surface hoar.
The same sites on Mont-Sainte-Anne were visited on 27 January (Fig. 8b), but this time surface hoar increased in size with elevation. No signs of wind transported snow were evident at the high-elevation sites. The same day on Ursus Minor Mountain in GNP, observed surface hoar also increased in size with elevation (Fig. 8c). Mild temperatures and calm winds over this period likely allowed surface hoar growth at alpine sites. Sizes modelled at HRDPS grid points near each mountain on 27 January were variable, but typi-cally increased with elevation. An exception was some of the highest elevation grid points near Mont-Sainte-Anne, where modelled surface hoar was smaller. On 7 February, observed and modelled crystal sizes typically decreased with elevation on Ursus Minor Mountain (Fig. 8d), as high-elevation sites experienced cold, dry, and windy conditions.
While the HRDPS modelled general elevation patterns, surface hoar sizes at neighbouring grid points were highly
variable and sensitive to the wind speed threshold. Further-more, the field observations were also variable, making quan-titative verification difficult. Avalanche practitioners often observe surface hoar layers over specific elevation bands where specific meteorological conditions exist. Accurate and precise NWP model forecasts are needed to model these ef-fects. The HRDPS appears to forecast some general eleva-tion trends, but will probably not pinpoint specific elevaeleva-tion bands.
3.3.3 Slope effects
SNOWPACK simulations on virtual slopes systematically predicted less surface hoar on slopes exposed to solar radi-ation (Fig. 9). North-facing slopes consistently had large sur-face hoar regardless of slope incline, but south-facing slopes were very sensitive to slope incline. Steep south slopes had a diurnal cycle of surface hoar growth and melt, particularly during warm periods such as 24 to 26 January. As a result, extended periods of clear weather often resulted in major dif-ferences between surface hoar modelled on north and south slopes, such as the 29 January layer.
Surface hoar observed on large open slopes had less con-sistent patterns over different aspects. Slopes at treeline el-evations often had comparable or even larger surface hoar on south slopes than on adjacent north slopes (Fig. 10). Al-though care was taken to choose slopes with similar sky view (>75 %), slope angle (20 to 30◦), and wind exposure, minor
(18 mm)
(16 mm) (25 mm)
N E S W N
0 10 20
(14 mm)
N E S W N N E S W N
(27 mm) (19 mm)
N E S W N
(15 mm)
N E S W N
0 10 20
(30 mm)
N E S W N N E S W N
S
ur
face
h
oa
r
size
(
m
m
)
(a) Fidelity / 21 Jan (b) Fidelity / 24 Jan (c) Ursus Minor / 27 Jan (d) St. Anne / 27 Jan
(e) Fidelity / 28 Jan (f) Diamond / 28 Jan (g) Hermit / 4 Feb
S
ur
face
h
oa
r
size
(
m
m
) Observed (no crust)Observed with crust
Crust thickness Virtual slopes
(15 mm)
Figure 10. Surface hoar sizes observed at treeline elevations over different slope aspects during seven field campaigns. Surface hoar sizes observed without underlying sun crusts are shown with solid red dots, while surface hoar sizes observed with underlying sun crusts are shown with hollow red dots (and the thickness of the crust to the right). Black lines show the median size modelled on slopes at eight cardinal aspects with 30◦inclines. Slope simulations were done with forecast data from grid points at treeline elevations within a 10 km radius of the mountain.
A more prominent impact of solar radiation was the for-mation of sun crusts beneath the surface hoar crystals due to sub-surface warming (Birkeland, 1998). Sun crusts were regularly observed on south slopes between 15 and 29 Jan-uary (e.g. Fig. 10a–f), but were rarely observed afterwards (e.g. Fig. 10g). Colder air temperatures in February likely offset radiative warming. Surface hoar crystals were not nec-essarily smaller on south slopes after sun crusts formed. For example, on 21 January, the south slope on Mt Fidelity had an 18 mm thick sun crust underneath 9 mm surface hoar crys-tals, which were larger than crystals observed at any of the adjacent slopes (Fig. 10a). In other cases, surface hoar was smaller when overlying sun crusts (e.g. Fig. 10b–f), particu-larly when overlying thick crusts. SNOWPACK simulations on south-facing slopes rarely modelled sun crusts, suggest-ing sub-surface meltsuggest-ing by solar radiation may not have been accurately simulated.
Virtual slope simulations in SNOWPACK may exagger-ate radiation effects on surface hoar. Incoming radiation on slopes is adequately modelled in SNOWPACK (Helbig et al., 2010), but the complete surface energy balance may not be. A major simplification is that turbulent fluxes on slopes are modelled with the same turbulent transfer coefficient as a flat field. In reality, turbulent fluxes (including vapour fluxes) are influenced by slope factors such as small-scale terrain fea-tures, vegetation, and local winds. These factors likely influ-enced the different sizes of surface hoar observed on slopes (Fig. 10). Also, turbulent fluxes on slopes likely offset the effects of radiation fluxes, as observed in snowmelt stud-ies (e.g. Mott et al., 2011). While SNOWPACK has a rela-tively sophisticated snow surface energy balance model, pro-cesses that affect surface hoar formation on slopes are clearly
more complex. A comprehensive model would need to re-solve high-resolution wind fields, along with improved mod-elling of turbulent fluxes, radiation absorption by the surface, snowmelt, terrain and vegetation shading, and local sky view effects from topography and vegetation.
4 Conclusions
Surface hoar formation modelled with the snow cover model SNOWPACK was associated with warm air temperatures, high humidity, cold surface temperatures, and low wind speeds. Meteorological factors influenced which surface hoar layers had large crystals, as well as the regions and eleva-tion bands where they formed. Low elevaeleva-tions typically had favourable humidity and wind speeds, while high elevations had favourable surface temperatures. These offsetting effects made surface hoar formation favourable at treeline elevations for two layers, and at below treeline elevations for another layer. Field observations typically agreed with modelled el-evation patterns, although there were some discrepancies at high elevations where the effect of strong winds was diffi-cult to model. Factors affecting surface hoar formation on slopes were highly variable and thus difficult to model by only accounting for slope incline and aspect. SNOWPACK systematically predicted less surface hoar on slopes exposed to solar radiation; however, this was not necessarily observed in the field, as solar radiation tended to form sun crusts under surface hoar rather than reduce surface hoar growth.
scale during a period of high pressure. Some elevation ef-fects were modelled, but improving the modelling of surface hoar formation under windy conditions would help simula-tions at high elevasimula-tions. Finer-scale meteorological phenom-ena, such as valley clouds and local winds, were not ade-quately resolved by the weather model, but should improve in the future with better-quality NWP models. The surface hoar model could be improved by downscaling meteorologi-cal data to account for lometeorologi-cal terrain features (e.g. Liston and Elder, 2006), modelling sky view effects such as vegetation and terrain shading (e.g. Helbig et al., 2010; Lutz and Birke-land, 2011), and improving modelled fluxes on slopes.
Acknowledgements. We thank the ASARC field team for collecting
field data and our host operations – Avalanche Control Section of Glacier National Park and Mike Wiegele Helicopter Skiing. We are grateful to Miguel Trembley and Catherine Brown for providing data, and Erik Kulyk for preparing the NWP data. We thank Charles Fierz and Mathias Bavay for help with SNOWPACK. For their financial support we thank TECTERRA, Canadian Pacific Canadian Avalanche Association, Natural Sciences and Engineering Research Council of Canada, HeliCat Canada, Canadian Avalanche Foundation, Parks Canada, Mike Wiegele He-licopter Skiing, Canada West Ski Areas Association, Backcountry Lodges of BC Association, Association of Canadian Mountain Guides, Teck Mining Company, Canadian Ski Guide Association, Backcountry Access, and the BC Ministry of Transportation and Infrastructure Avalanche and Weather Programs. We also thank the reviewers of this paper.
Edited by: P. Marsh
References
Bellaire, S. and Jamieson, B.: Forecasting the formation of critical snow layers using a coupled snow cover and weather model, Cold Reg. Sci. Technol., 94, 37–44, 2013.
Bellaire, S. and Schweizer, J.: Measuring spatial variations of weak layer and slab properties with regard to snow slope stability, Cold Reg. Sci. Technol., 65, 234–241, 2011.
Bellaire, S., Jamieson, J. B., and Fierz, C.: Forcing the snow-cover model SNOWPACK with forecasted weather data, The Cryosphere, 5, 1115–1125, doi:10.5194/tc-5-1115-2011, 2011. Bellaire, S., Jamieson, J. B., and Fierz, C.: Corrigendum to
“Forc-ing the snow-cover model SNOWPACK with forecasted weather data” published in The Cryosphere, 5, 1115–1125, 2011, The Cryosphere, 7, 511–513, doi:10.5194/tc-7-511-2013, 2013. Birkeland, K.: Terminology and predominant processes associated
with the formation of weak layers of near-surface faceted crystals in the mountain snowpack, Arct. Alp. Res., 30, 1–12, 1998. Brun, E., David, P., Sudul, M., and Brunot, G.: A numerical model
to simulate snow-cover stratigraphy for operational avalanche forecasting, J. Glaciol., 38, 13–22, 1992.
CAA – Canadian Avalanche Association: Observation Guide-lines and Recording Standards for Weather, Snowpack and Avalanches, Canadian Avalanche Association, Revelstoke, Canada, 2014.
Chow, F. K., Weigel, A. P., Street, R. L., Rotach, M. W., and Xue, M.: High-resolution large-eddy simulations of flow in a steep Alpine valley, Part I: Methodology, verification, and sen-sitivity experiments, J. Appl. Meteorol. Clim., 45, 63–86, 2006. Colbeck, S.: On the micrometeorology of surface hoar growth on
snow in mountainous area, Bound.-Lay. Meteorol., 44, 1–12, 1988.
Colbeck, S., Jamieson, B., and Crowe, S.: An attempt to describe the mechanism of surface hoar growth from valley clouds, Cold Reg. Sci. Technol., 54, 83–88, 2008.
Erfani, A., Mailhot, J., Gravel, S., Desgagné, M., King, P., Sills, D., McLennan, N., and Jacob, D.: The high resolution limited area version of the global environmental multiscale model and its potential operational applications, in: Proceedings of the 11th Conf. on Mesoscale Processes, Albuquerque, NM, USA, 2005.
Feick, S., Kronholm, K., and Schweizer, J.: Field observations on spatial variability of surface hoar at the basin scale, J. Geophys. Res.-Earth, 112, F02002, doi:10.1029/2006JF000587, 2007. Fierz, C., Armstrong, R., Durand, Y., Etchevers, P., Greene, E.,
Mc-Clung, D., Nishimura, K., Satyawali, P., Sokratov, S.: The Inter-national Classification of Seasonal Snow on the Ground, IHP-VII Technical Documents in Hydrology No. 83, IACS Contribution No. 1, UNESCO-IHP, Paris, 2009.
Foehn, P.: Simulation of surface-hoar layers for snow-cover models, Ann. Glaciol., 32, 19–26, 2001.
Hachikubo, A.: Numerical modelling of sublimation on snow and comparison with field measurements, Ann. Glaciol., 32, 27–32, 2001.
Hachikubo, A. and Akitaya, E.: Effect of wind on surface hoar growth on snow, J. Geophys. Res.-Atmos., 102, 4367–4373, 1997.
Haegeli, P. and McClung, D. M.: Avalanche characteristics of a tran-sitional snow climate – Columbia Mountains, British Columbia, Canada, Cold Reg. Sci. Technol., 37, 255–276, 2003.
Helbig, N. and van Herwijnen, A.: Modeling the spatial distribution of surface hoar in complex topography, Cold Reg. Sci. Technol., 82, 68–74, 2012.
Helbig, N., Loewe, H., Mayer, B., and Lehning, M.: Explicit val-idation of a surface shortwave radiation balance model over snow-covered complex terrain, J. Geophys. Res., 115, D18113, doi:10.1029/2010JD013970, 2010.
Horton, S., Bellaire, S., and Jamieson, B.: Modelling the forma-tion of surface hoar layers and tracking post-burial changes for avalanche forecasting, Cold Reg. Sci. Technol., 97, 81–89, 2014. Lehning, M., Bartelt, P., Brown, B., and Fierz, C.: A physical SNOWPACK model for the Swiss avalanche warning: Part III: Meteorological forcing, thin layer formation and evaluation, Cold Reg. Sci. Technol., 35, 169–184, 2002.
Lehning, M., Voelksch, I., Gustafsson, D., Nguyen, T. A., Staehli, M., and Zappa, M.: ALPINE3D: a detailed model of mountain surface processes and its application to snow hydrol-ogy, Hydrol. Process., 20, 2111–2128, 2006.
Liston, G. E. and Elder, K.: A meteorological distribution system for high-resolution terrestrial modeling (MicroMet), J. Hydrom-eteorol., 7, 217–234, 2006.
Mailhot, J., Milbrandt, J., Giguère, A., McTaggart-Cowan, R., Er-fani, A., Denis, B., Glazer, A., and Vallée, M.: An experimental high-resolution forecast system during the Vancouver 2010 Win-ter Olympic and Paralympic Games, Pure Appl. Geophys., 171, 209–229, 2012.
Mo, R., Joe, P., Isaac, G., Gultepe, I., Rasmussen, R., Milbrandt, J., McTaggart-Cowan, R., Mailhot, J., Brugman, M., and Smith, T.: Mid-mountain clouds at Whistler during the Vancouver 2010 Winter Olympics and Paralympics, Pure Appl. Geophys., 171, 157–183, 2012.
Mott, R., Egli, L., Grünewald, T., Dawes, N., Manes, C., Bavay, M., and Lehning, M.: Micrometeorological processes driving snow ablation in an Alpine catchment, The Cryosphere, 5, 1083–1098, doi:10.5194/tc-5-1083-2011, 2011.
Mott, R., Daniels, M., and Lehning, M.: Atmospheric Flow De-velopment and Associated Changes in Turbulent Sensible Heat Flux over a Patchy Mountain Snow Cover, J. Hydrometeorol., 16, 1315–1340, doi:10.1175/JHM-D-14-0036.1, 2014.
Raderschall, N., Lehning, M., and Schaer, C.: Fine-scale modeling of the boundary layer wind field over steep topography, Water Resour. Res., 44, W09425, doi:10.1029/2007WR006544, 2008. Schirmer, M. and Jamieson, B.: Verification of analysed and
fore-casted winter precipitation in complex terrain, The Cryosphere, 9, 587–601, doi:10.5194/tc-9-587-2015, 2015.
Schweizer, J. and Kronholm, K.: Snow cover spatial variability at multiple scales: characteristics of a layer of buried surface hoar, Cold Reg. Sci. Technol., 47, 207–223, 2007.
Schweizer, J., Jamieson, J. B., and Skjonsberg, D.: Avalanche fore-casting for transportation corridor and backcountry in Glacier National Park (BC, Canada), 25 Years of Snow Avalanche Re-search, 12–16 May 1998, Voss, Norway, 238–243, 1998.
Shea, C. and Jamieson, B.: Spatial distribution of surface hoar crys-tals in sparse forests, Nat. Hazards Earth Syst. Sci., 10, 1317– 1330, doi:10.5194/nhess-10-1317-2010, 2010.
Shea, C. and Jamieson, B.: Sun effect on surface hoar illustrated by three case studies, Cold Reg. Sci. Technol., 68, 99–105, 2011. Slaughter, A. E.: Numerical analysis of conditions necessary for
near-surface snow metamorphism, PhD thesis, Montana State University, Bozeman, Montana, USA, 2010.
Slaughter, A. E., Adams, E., Staron, P., Shertzer, R., Walters, D., McCabe, D., Catherine, D., Henninger, I., Leonard, T., Coop-erstein, M., and Munter, H.: Field investigation of near-surface metamorphism of snow, J. Glaciol., 57, 441–452, 2011. Stoessel, F., Guala, M., Fierz, C., Manes, C., and Lehning, M.:
Micrometeorological and morphological observations of surface hoar dynamics on a mountain snow cover, Water Resour. Res., 46, W04511, doi:10.1029/2009WR008198, 2010.
Stull, R.: Practical Meteorology: an Algebra Based Survey of At-mospheric Science, University of British Columbia, Vancouver, Canada, 2014.
Vionnet, V., Bélair, S., Girard, C., and Plante, A.: Wintertime sub-kilometer numerical forecasts of near-surface variables in the Canadian Rocky Mountains, Mon. Weather Rev., 143, 666–686, 2014.