www.atmos-meas-tech.net/7/1873/2014/ doi:10.5194/amt-7-1873-2014
© Author(s) 2014. CC Attribution 3.0 License.
CloudSat-constrained cloud ice water path and cloud top height
retrievals from MHS 157 and 183.3 GHz radiances
J. Gong1,2and D. L. Wu2
1University Space Research Association, Columbia, MD, USA
2Climate and Radiation Branch, MC 613.2, NASA/Goddard Space Flight Center, Greenbelt, MD, USA Correspondence to: J. Gong (jie.gong@nasa.gov)
Received: 29 May 2013 – Published in Atmos. Meas. Tech. Discuss.: 4 September 2013 Revised: 13 May 2014 – Accepted: 14 May 2014 – Published: 26 June 2014
Abstract. Ice water path (IWP) and cloud top height (ht) are two of the key variables in determining cloud radiative and thermodynamical properties in climate models. Large uncer-tainty remains among IWP measurements from satellite sen-sors, in large part due to the assumptions made for cloud microphysics in these retrievals. In this study, we develop a fast algorithm to retrieve IWP from the 157, 183.3±3 and 190.3 GHz radiances of the Microwave Humidity Sounder (MHS) such that the MHS cloud ice retrieval is consistent with CloudSat IWP measurements. This retrieval is obtained by constraining the empirical forward models between col-located and coincident measurements of CloudSat IWP and MHS cloud-induced radiance depression (Tcir) at these chan-nels. The empirical forward model is represented by a look-up table (LUT) ofTcir–IWP relationships as a function ofht and the frequency channel. Withhtsimultaneously retrieved, the IWP is found to be more accurate. The useful range of the MHS IWP retrieval is between 0.5 and 10 kg m−2, and agrees well with CloudSat in terms of the normalized prob-ability density function (PDF). Compared to the empirical model, current operational radiative transfer models (RTMs) still have significant uncertainties in characterizing the ob-servedTcir–IWP relationships. Therefore, the empirical LUT method developed here remains an effective approach to re-trieving ice cloud properties from the MHS-like microwave channels.
1 Introduction
Ice clouds have profound impacts on the global energy bud-get (Stephens et al., 1990), hydrological cycle (Chahine, 1992), atmospheric structure (Ramaswamy and Ramanathan, 1989) and circulation (Richter and Rasch, 2008). Cloud ice water amount is one of the largest sources of uncertainty in quantifying cloud–climate feedbacks and sensitivities. For example, the mean cloud ice water path (IWP) ranges from 10 to 120 g m−2in the tropics among a variety of global cli-mate models (GCMs) in the most recent 20th century Cou-pled Model Intercomparison Project Phase 5 (CMIP5) runs (Li et al., 2012). Accurate cloud IWP measurements are criti-cally needed to guide model developments and reduce model uncertainties.
in the assumptions made for the IWP retrieval. On the other hand, passive satellite sensors have limited penetration capa-bility to observe thick and dense ice clouds from space. As a result, only partial columns of IWP (pIWP) can be measured by passive sensors, and the column bottom varies with at-mospheric absorption, cloud amount, droplet size and phase, and cloud top height. These uncertainties about cloud col-umn create additional errors in the IWP retrieval using pas-sive sensors.
As an active sensor, CloudSat radar provides an unprece-dented opportunity to measure the ice water content (IWC) profile and its vertical integral (i.e., IWP) globally since 2006. The CloudSat cloud ice retrieval still depends on the cloud microphysics constrained by in situ and ground-based observations (Austin et al., 2009). CloudSat data are confined in a narrow curtain (∼1 km width) along the orbital track, and thus are used mostly for climatological and case stud-ies. Like other A-train sun-synchronous satellites, it samples only two local solar times (01:30 and 13:30 LST) of the cloud diurnal cycle. However, CloudSat data still provide the best characterization of the vertical distribution of global cloud ice (Eliasson et al., 2011), and can be used to cross-calibrate other techniques, especially the passive sensors with limited vertical resolution. (Wu et al., 2009).
Passive nadir-viewing microwave techniques such as Ad-vanced Microwave Sounding Unit-B (AMSU-B) and the Mi-crowave Humidity Sensor (MHS) have an advantage over in-frared/visible sensors in penetrating deeper into cloud layers to measure IWP. More importantly, MHS has a swath width of∼2300 km to capture synoptic-mesoscale systems in mo-tion as well as variabilities not captured from the curtain-only sampling by CloudSat. Instead of slicing a single ver-tical cross section of a hurricane, the entire cyclonic struc-ture can be mapped out with one MHS orbit. Since 1998, satellites carrying instruments like AMSU-B and MHS have been operational and now fly across the Equator at more than eight local solar times every day, the mosaic of which can be used for cloud diurnal cycle studies. Moreover, at microwave frequencies ice scattering signals are approximately linearly proportional to cloud ice amount in the path, resulting in a relatively straightforward relationship between IWP and cloud-induced radiance depression (Wu et al., 2009). These advantages make nadir-viewing microwave sensors attractive for monitoring global long-term IWP.
Retrieval of IWP requires radiative transfer models (RTMs) or forward models that relate cloud ice to the mea-sured radiance. The cloud ice models can be formulated ei-ther theoretically or empirically. RTMs are also widely used in climate models but primarily for calculating clear-sky radiative forcing from atmosphere gas, cloud, aerosol and surface. Although studies demonstrated the use of RTMs for IWP retrievals from AMSU-B/MHS channels, consid-erable uncertainties exist with RTMs in representing com-plex physical processes (e.g., land surface radiative fluxes, ice particle shape) and with oversimplified assumptions (e.g.,
plane-parellel atmosphere and cloud layers, cloud droplet size distribution, etc.). The errors in liquid drop size, sur-face emission/scattering, cloud layer height, and water va-por amount can all degrade the quality of the retrieved IWP. For example, the current operational IWP retrieval algorithm from Microwave Surface and Precipitation Products System (MSPPS), which is based upon a two-stream approximated radiative model solution (Zhao and Weng, 2002) at AMSU-B 89 and 150 GHz channels, was found to under-estimate IWP in comparison with other observations (Wu et al., 2009; Waliser et al., 2009; Eliasson et al., 2011; Chen et al., 2011). Contamination of cloud ice retrievals was also found over snowy/icy surfaces (Wu et al., 2009).
While further improvements are still needed for ice scat-tering calculation in the microwave RTMs, empirical forward models have been used for cloud retrievals (Holl et al., 2010). Empirical approaches establish some ad hoc relationships between cloud ice variables and radiance/reflectivity mea-surements from the data themselves. Such empirical forward models are developed from a finite ensemble of observations, and are therefore limited to specific conditions, environments and dynamic ranges of the cloud variable of interest. The al-gorithms are usually fast in the form of a look-up table (LUT) and bypass the complex microphysical calculation in cloudy-sky radiative transfer in individual cases. Empirical methods have also been used in surface remote sensing where land properties are too complicated to be modeled or validated (e.g., Pulliainen and Hallikainen, 2001).
In this paper, we develop an empirical model and retrieval algorithms for IWP using cloud-induced radiance depression (Tcir) from MHS at 157, 183.3±3 and 190.3 GHz. The empir-ical forward model is obtained by regressing MHSTcir radi-ances on collocated CloudSat IWP and cloud top height mea-surements in the tropics. The sequential estimation method is then used to retrieve IWP for all MHS footprints. The instru-ments and methodology will be described in Sect. 2, followed by the detailed retrieval algorithm in Sect. 3. An evaluation of the retrieved products and the associated errors is going to be given in Sect. 4, followed by the summary in Sect. 5.
2 Instruments, data, and methods 2.1 Description of data sets and models
2.1.1 MHSTB, IWP and historical issues
MHS is a cross-track scanning radiometer aboard the Na-tional Oceanic and Atmospheric Administration (NOAA) satellite 18, 19, European Organisation for the Exploitation of Meteorological Satellites (EUMETSAT) Metop-A, and Metop-B, which is a slightly improved version of AMSU-B onboard NOAA-15, 16, and 17. MHS makes 90 footprints (with a beam width of 1.1◦) continuously in each cross-track scan and the outermost scan angle is ±48.95◦ from nadir. For NOAA-18, the MHS scan and satellite orbital altitude produce a nadir footprint size of 16 km at half-power field of view (FOV) and a swath width of 2200 km. The FOV size and swath vary slightly among satellites due to different orbital altitudes. MHS has five microwave channels, which are 89, 157, 183.3±1, 183.3±3 and 190.3 GHz (for AMSU-B, the second and last channels are 150 and 183.3±7 GHz, respec-tively). For consistency, these channels are labeled as CH#1– CH#5 hereafter. MHS CH#1, CH#2 and CH#5 are vertically polarized, and the other two are horizontally polarized (for AMSU-B, all five channels are vertically polarized). The designed radiometric noises (N E1T) for CH#1–CH#5 are 0.22, 0.34, 0.51, 0.40, and 0.46 K, respectively (John et al., 2012). The 89 and 157 GHz are window channels, and those around 183.3 GHz water vapor absorption line are designed to profile the atmospheric water vapor. Under clear-sky con-ditions, the peak sensitivity of these 183.3 GHz channels oc-curs in the upper, middle and lower tropospheres, respec-tively. NOAA-15, 16, 17, 18 and 19 orbits drift slowly with time, while Metop-A and Metop-B are maintained at a sun-synchronous orbit with fixed Equator passing time (EPT).
For ice particle scattering measurement, the higher-frequency channels (157, 183.3 and 190.3 GHz) work bet-ter for IWP retrievals because the Mie scatbet-tering is propor-tional to frequency to the fourth power. Scattering-based mi-crowave cloud remote sensing has some unique properties as well as limitations. First, it penetrates deeper into ice clouds than IR and visible techniques for cloud ice measurements, but can become saturated for very optically thick clouds (Seo and Liu, 2006; Arriaga, 2000). In the case of saturation, only partial cloud ice column pIWP can be retrieved. As shown in Seo and Liu (2006), the window channels near 183.3 GHz can penetrate a cloud layer with IWP as large as 10 kg m−2, which covers most of the IWP values observed by Cloud-Sat. However, in the case of graupels, or frontal astrostratus clouds, saturation may occur (Arriaga, 2000). Saturation is also more prominent in the oblique views than nadir (where the line-of-sight path is longer).
Secondly, among all MHS/AMSU-B channels, CH#3 is most sensitive to water vapor because it is adjacent to the 183.3 GHz water vapor absorption line. The absorption from upper tropospheric water vapor, so-called “water va-por screening”, prevents CH#3 from seeing the surface and clouds in the lower troposphere. To some extent, CH#4 has quite amount of water vapor screening and can observe some
ice clouds, but remains little contaminated by the surface un-less at dry, high latitudes. In other words, CH#4 can be used to distinguish between surface and clouds in the situation where other channels have difficulties, as will be shown in Sect. 2.1.3.
Lastly, microwave radiances are dependent on scan angle at these frequencies. Under clear-sky conditions, the radi-ance may decrease with scan angle from nadir, as a function of the cosine of angle, due to the increasing path length at line of sight (LOS). This is similar to the 6.7 µm IR chan-nel where the longer LOS path gives a weighting function at a higher altitude, or cold temperature (Soden, 1998). Under the cloudy-sky condition, the radiance scan dependence may vary with cloud inhomogeneity as cloud size and distribution are often not homogeneous. In addition to the atmosphere-induced scan angle dependence, there are some instrument errors in all five channels that are scan dependent and asym-metric about nadir. These instrumental errors can severely degrade the quality of the retrieved IWP if not properly cor-rected. For example, there was a radio-frequency interference (RFI) problem in CH#3 and CH#4 of AMSU-B (Atkinson, 2001; Buehler et al., 2005), and gain variations/degredations are found in CH#3–CH#5 of AMSU-B on NOAA-16 and NOAA-17 (John et al., 2013). MHS exhibits smaller scan-dependent biases than AMSU-B, but suspicious behaviors have been reported for CH#3 on NOAA-18 and NOAA-19 and Metop-A (John et al., 2013). The MHS instruments on NOAA-18 and Metop-A have so far shown the best overall radiometric calibration for all five channels. Since NOAA-18 has the closest EPT with CloudSat, it is used in this study to develop the cloud ice retrieval constrained by CloudSat. The radiances from CH#3 are not used because they are rel-atively noisier and provide little information on cloud ice. As in the main weather prediction centers, we use the Ad-vanced Television and Infrared Observational Satellite Op-erational Vertical Sounder (ATOVS) and the Advanced Very High Resolution Radiometer (AVHRR) pre-processing pack-age (AAPP, v7) developed by Numerical Weather Prediction Satellite Application Facilities (NWP SAF) to process the L1B radiance data to obtain the further quality-controlled and calibrated L1C data. In the NOAA-18 MHS L1C data we have not found any systematic instrumental error.
data, now integrated into the MSPPS in the CLASS website, will also be used in this study for comparisons.
2.1.2 CloudSat IWC
Launched into the A-train in April 2006, CloudSat has a 94 GHz cloud profiling radar (CPR) to provide continuous cloud profiles along its nadir track. A CPR FOV size is 1.3×1.7 km. The cloud ice water content (IWC) product from 2B-CWC-RO (R04) is used in this study, which as-sumes a gamma size distribution of cloud ice particles. The CloudSat IWC retrieval is limited when the temperature is above 0◦C; so is the liquid water content (LWC) retrieval at temperatures below−20◦C. Between 0 and−20◦C, IWC and LWC are retrieved separately and linearly interpolated to the intermediate temperature range (details of the algorithm can be found in Austin et al., 2009). Thus, large uncertainties are expected for this mixed-phase cloud regime, and/or in the ice cloud cases with large snow/graupel particles present. The vertical resolution of the IWC profile is 250 m. In our study, we interpolate it vertically to an evenly spaced grid (250 m resolution), and integrate the IWC between surface and 19 km to compute the total IWP. We also integrate the IWC profile from different bottom heights to represent the pI-WPs measured by MHS channels better. Compared with Holl et al. (2010), who used the CloudSat total column IWP prod-uct, our IWC integration approach is more meaningful for comparison with pIWP seen from MHS water vapor chan-nels, although the pIWP value is calculated on a profile-by-profile basis. Hereafter, we use IWP as the abbreviation of pIWP in our study to represent the MHS cloud ice column.
CloudSat IWC has been validated with in situ, ground-based and other satellite IWC measurements (e.g., Austin et al., 2009; Wu et al., 2009; Protat et al., 2009). The un-certainty is claimed to be up to 40 % (Austin et al., 2009), which is much smaller than the divergences among various satellites and models, the latter of which often exceed 100 % (Waliser et al., 2009; Eliasson et al., 2011). In this study, we treat CloudSat IWP as the “truth” to constrain the retrieved MHS IWP difference relative to that of CloudSat. Moreover, since microwave penetrates much deeper into ice clouds than IR/VIS channels, we expect our CloudSat-constrained algo-rithm to yield a better retrieval at large IWP values.
2.1.3 Radiative transfer models (RTMs) and computation ofTcir
The first step in cloud ice retrieval is to determine ice cloud-induced brightness temperatureTcirfrom raw radiance mea-surements (Wu et al., 2009, 2014). In this study,Tcir (cloud-induced radiance) is defined as the difference between the measured radiance, TB, and modeled clear-sky background (also called “cloud-cleared radiance”),Tccr:
Tcir≡TB−Tccr. (1)
Tcir also serves as a critical variable for cloud detection since every measurement has an uncertainty that may lead to a false alarm.Tcir error is largely affected by uncertainty in the estimatedTccr. Various methods have been developed to improve the accuracy ofTccrestimation. Generally speak-ing,Tccrcan be obtained using statistical differences between cloudy and clear skies (Wu et al., 2005), or using the radia-tive transfer model to estimate the clear-sky background from the current atmospheric state. Here we use the second ap-proach with the best estimate of local atmospheric state vari-ables (e.g., temperature, pressure, water vapor, ozone) and surface conditions (e.g., surface temperature, surface type) from a MERRA three-hourly assimilation data set from in-terpolation of adjacent grid points and closest local time. We allow relative humidity to exceed 100 % in computing clear-sky radiation. We also used the MERRA six-hourly finer-grid analysis product and European Re-Analysis Interim (ERA-Interim) data, but no statistically significant difference inTccr distribution is found among the results so far in the tropics and subtropics.
The JCSDA CRTM v2.0.5 model is employed to calcu-lateTccr. CRTM is a fast radiative transfer model that uses an advanced doubling–adding method (Liu and Weng, 2006) to compute the radiances and radiance Jacobians at the top of the atmosphere for various instruments, with wavelengths ranging from visible to submilimeter. It includes scattering calculations for cloud, aerosol, gas molecules and surface if specified. As the key backbone of data assimilation (DA) sys-tems, the CRTM has incorporated most space-borne instru-ment information (e.g., spectral frequency, filter shape, and scan pattern), including AMSU-B and MHS. Therefore, it is also our objective to calibrate our cloud ice retrieval with this widely used CRTM forTccrestimation so that the IWP out-puts can be ready for the DA applications.
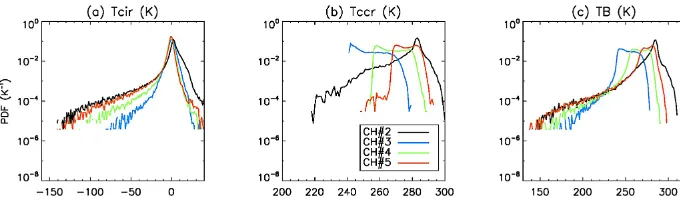
Figure 1 presents the probability density functions (PDFs) ofTcir,TccrandTBfrom a month’s worth of MHS nadir mea-surements in the tropics. WarmerTBvalues are mostly from the clear sky or surface, while colderTBare the cases of ice clouds or snow/icy surfaces at a high elevation. TheTBPDFs all have a broad peak with a standard deviation (σ) that is so wide that the empirical 3σ cloud detection method (i.e., TBpeak−3σ <0 for cloud detection) used by many previous
Figure 1. Probability density functions ofTcir(a),Tccr(b) andTB(c) for CH#2 (black), CH#3 (blue), CH#4 (green) and CH#5 (red). Samples are from the NOAA-18 MHS nadir view during August 2010 in the tropics ([25◦S, 25◦N]).
radiances is characterized by this standard deviationσ, which can be computed from this portion of PDF.
However, the CRTM does not always improve cloud de-tection. For example, the width of the CH#2TcirPDF is not much narrower than that ofTB, indicating limited skills of the CRTM in capturing the clear-sky variability. Large error in the calculatedTccris found over mountains and arid areas, where it remains challenging for the CRTM to model sur-face contributions at CH#2. When excluding all land cases, the CH#2 Tcir can produce a PDF with a narrower width around zero (not shown). On average, theTcirerror is∼5 K (one standard deviation), although it may vary from 7.5 to 10 K. In the cloud ice retrieval later on, the generic value of 5 K is used for all channels. In addition toTcir standard de-viation, we also calculate Tcir bias for each MHS channel since the clear-sky PDF should peak at zero. We find that the CRTM has a cold bias (∼2 K) at 157 GHz (see Appendix B for details), whereas the bias is negligible for other channels (Fig. 6).
Moreover, Fig. 1a also reveals the dynamic range and pen-etration depth of the four MHS channels in measuring cloud ice. Ch#2 penetrates deepest into clouds. Benefitting from its low frequency (157 GHz) at which cloud scattering and wa-ter vapor absorption is lowest among the MHS channels, it produces the longest cloud PDF tail (black line in Fig. 1a). On the other end, CH#3 has the most absorption from wa-ter vapor, showing the smallestTcirdynamic range. It has a slightly broader distribution in the positive half ofTcirPDF, compared to those of CH#4 and CH#5, indicating that ei-ther the upper-tropospheric water vapor from MERRA or the CRTM calculation at CH#3 contains greater uncertainty.
Two popular operational RTMs are also used to explore how the observed Tcir–IWP relationship is simulated by models. These two RTMs are CRTM, and a multi-stream “cloudy-sky radiance model” (CRM) that is currently used by the Microwave Limb Sounder (MLS) team to retrieve ice cloud properties (Wu and Jiang, 2004). They both show a certain lack of ability to capture the observed Tcir–IWP re-lationship, which results in large biases in data assimilation and increases the uncertainty of IWP retrieval (Appendix C).
2.2 Collocated and coincident MHS-CloudSat measurements
Collocated and coincident measurements (collocations here-after for briefness) are the incidences where two or more sensors observe the same location at the same time. These measurements provide useful pairs for instrument calibration (e.g., John et al., 2012), cross-validation of a particular vari-able (e.g., Wang et al., 2010), or development of new retrieval methods (e.g., Lamquin et al., 2008). In this paper, we will be focusing on the last application.
The requirements for collocated–coincident measure-ments may vary, depending on the variability of the specific variable. Since most of the atmospheric state variables (e.g., wind, temperature, humidity) change relatively slowly and continuously with space and time compared to fast processes like clouds, their requirements for collocation and coinci-dence should be a bit more relaxed and the allowed windows for space and time should be consistent. In other words, the uncertainty of collocation due to spatial variations should be comparable to one of coincidence due to temporal variations. Another factor in defining the requirements for collocation and coincidence is to assure enough samples for statistics. For the A-train sensors, sample size is usually not a problem. On the other hand, such a near-perfect collocation is rare between radiosonde and Global Positioning System (GPS) measurements (Sun et al., 2010). Neither occurs frequently for two satellites that run in different orbits. Adjustment of the collocating criteria becomes necessary and important in these situations.
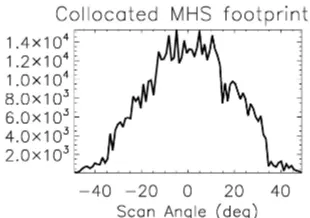
Figure 2. Total number of collocated and coincident MHS foot-prints as a function of scan angle between June 2006 and March 2011.
distance criteria. The sensitivity of the retrieval algorithm to the choice of collocation criteria will be discussed in the next section.
Because of the close orbits between NOAA-18 and Cloud-Sat, the number of collocated measurements peaks at the MHS nadir angle and drops off similarly at the left and right view angles (Fig. 2). There is no significant scan angle-dependent sampling bias, which would be a factor to consider in the derivedTcir−IWP relationship. The number of collo-cations decreases sharply at oblique views with scan angle θ >35◦, which may affect the statistical significance of the derivedTcir−IWP relationship.
In the case of highly inhomogeneous clouds, larger uncer-tainty is expected for the IWP within MHS FOV, as CloudSat footprints cover at most 6.7 % of the area of an MHS foot-print. As a matter of fact, multiple CloudSat cloud profiles often correspond to an MHS footprint because the CloudSat footprint (∼1.5 km) is much smaller than the spatial range of the defined collocation. Thus, we average all the CloudSat IWP values within the collocated MHS FOV to represent the mean IWP for the MHS footprint. The same procedure is ap-plied to calculate the mean cloud top height (ht) at that MHS footprint, where each individual CloudSathtis obtained by searching for the highest level where IWC>10 mg m−3.
3 EmpiricalTcirmodel and IWP retrieval
3.1 EmpiricalTcir–IWP relationships
For nadir-viewing sensors like MHS/AMSU-B, negativeTcir is caused primarily by ice cloud scattering instead of by emis-sion. Mie theory shows thatTciris proportional to cloud IWP at microwave wavelengths and to the fourth power of fre-quency. As the ice cloud becomes radiatively thick, cloud self-extinction preventsTcirfrom penetrating deeper to sense the entire IWP, but rather, it has a sensitivity to pIWP. Hence, an empiricalTcir−IWP relationship is derived in the follow-ing format:
Tcir=Tcir0·(1−e−IWP/H), (2)
whereTcir0is the coldest Tcir(i.e., saturation value) and H is the parameter to determine whereTcirbecomes saturated. Both Tcir0 andH depend on frequency and can vary with cloud top height (ht), instrument view angle, and temperature lapse rate (γ) in the upper troposphere. In this study, since we focus on the tropical region where the lapse rate variation is small, these parameters are assumed to be only a function of channel frequency and cloud top height. For small IWP values,Tcir'Tcir0(−IWP/H ), which is a linear relationship as described by Wu and Jiang (2004) for Aura MLS. As also suggested by Wu and Jiang (2004),Hcould be a function of cloud profile shape and the ice-to-water mixing ratio inside clouds, but these dependencies have secondary effects on the Tcir–IWP relationship.
To derive the empiricalTcir–IWP relationship, we first sort all collocated measurements, CloudSat IWP (averaged onto MHS footprints) and MHSTcirat near-nadir views (scan an-gle∈ [−5◦,5◦]), to generate a joint PDF separately for each
MHS channel. As shown in Fig. 3, the Tcir–IWP relation-ships are scattered with the PDF peaks in good agreement with Eq. (2). We then fit the 2-D PDF to obtainTcir0andH parameters in Eq. (2), which is the solid curve in Fig. 3. The fitting is carried out as follows: (1) to determineTcir0from the coldestTcir. We search all 2010 MHS nadir data and the coldestTcir asTcir0 for each channel. (2) We then compute H in Eq. (2) with the ordinary least squares method by fit-ting theTcirand IWP values at peak 2-D PDF (black dots in Fig. 3) using theTcir0derived from step 1.
The fitted curves represent bulk characteristics of the joint PDF. Compared to a linear fit, the residual variances de-creased by at least 50 %. However, the joint PDF of CH#3, showing a steeper relationship forTcirand IWP at colderTcir values, is not represented well by Eq. (2). Moreover,TcirPDF becomes flat at small IWP values (IWP<0.5 kg m−2), indi-cating the lower limit ofTcir sensitivity to IWP. The spread of 2-D PDF reflects both natural variability and collocation error of the Tcir–IWP relationship. One of the cloud vari-abilities that affect theTcir–IWP relationship is the cloud top height (ht).
Figure 3. Contours of 2-D PDFs (normalized by the maximum value of the histogram) of collocated CloudSat IWP (abscissa, av-eraged onto MHS footprints) and MHSTcir (ordinate) for CH#2– CH#5 at near-nadir views (scan angle∈ [−5◦,5◦]). Black dots lo-cate the peak of the 2-D PDFs, and the thick solid lines are regres-sion curves using Eq. (2).
15.5 km are too few to obtain a statistically robustTcir–IWP relationship.
Fig. 4 shows thatTciris more sensitive to IWP for clouds with higher ht, except for CH#3, where the situation is re-versed. This variation inTcirsensitivity is expected, accord-ing to the sensitivity expression from a conceptual cloud scat-tering model (Eq. 6.3 in Wu and Jiang, 2004)
Tcir τceff
≈Tscat−TAB, (3)
whereτceff is the cloud effective optical depth that is posi-tively correlated with IWP,Tscatis the cloud scattering radi-ance from a convolution of the upwelling and downwelling radiation, andTABis the background clear-sky radiance be-neath the cloud. For a given channel,TABremains the same no matter how thick or thin the ice cloud is. For thick, highht clouds,Tscatis colder due to more contributions from higher altitudes, resulting in a larger Tcir sensitivity to IWP. The CRM used by Wu and Jiang (2004) for Aura MLS predicts a similar but weakerhtdependence, due to the fact that MLS is
Table 1. Look-up table for the parameters of the jointI W P–ht re-trieval.
Tcir0 c0 c1 c2
[K] [kg m−2] [g m−3] [mg m−4] CH#2 −172 21.45 −1.9875 0.5625
CH#4 −140 17.021 −0.4078 0
CH#5 −155 29.6511 −2.26214 0.038156
a limb sounder that observes the cloud side in its LOS rather than the cloud top seen from a nadir sensor.
Since we do not have an accurate model ofH dependence onht, a quadratic function is assumed to interpolate and ex-trapolate H (ht)to the cases beyond the values at the ob-served ht, i.e., ht=10, 12 and 14 km. The coefficients in Eq. (4) are solved from the observedH values for threeht groups with the mean values at 10, 12 and 14 km. Including Tcir0, all the parameters of the empirically derivedTcir−IWP relationships for CH#2, CH#4 and CH#5 are listed in the look-up table 1.
H=c0+c1ht+c2h2t (4)
The ht-dependent H parameter allows a simultaneous re-trieval ofhtand IWP. By including or constraininghtin the retrieval, it improves the IWP retrieval. Other approaches, e.g., using IR channels from the CO2slicing method (Kahn et al., 2008) may be used in the future to constrainhtin the IWP retrieval. As seen in Fig. 4, the error bar for each of the three cloud groups is smaller than one without the height separation. Relaxing the collocation requirements would in-crease the number of measurements for statistics, but we find that it does not reduce the error bar of the derivedTcir−IWP relationship.
To complete the empirical model for theTcir−IWP rela-tionship, we need to extend the parameters listed in Table 1 from the near-nadir case to all MHS scan angles. For off-nadir views, to account for longer off-off-nadir LOS (ζ is the local zenith angle), theTciroff−nadir needs to be multiplied by
cosζ to achieve an equivalent nadir Tcir, assuming plane-parallel cloud layers. This is not a bad assumption in the case where clouds are not opaque. For opaque clouds, inhomo-geneity plays a more important role in relating off-nadir and nadir views. In other words, the scan-angle correction forTcir is a function ofTcir as well. Thus, we develop an empirical solution for this correction, which is given in Appendix A. 3.2 Joint retrieval of IWP andht
Figure 4. PDF peaks (uncertainties given as error bars) and the cor-responding regression lines based on Eqs. (2) and (4) for clouds withhtbetween 13.5 and 14.5 km (black), 11.5 and 12.5 km (blue) and 9.5 and 10.5 km (red) for CH#2–CH#5 at near-nadir views.
Eq. (5) below:
x(q+1)=x(q)+Sx[KTS−y1(y−Tcir(q)))+Sa−1(a−x(q))] (5) (q) annotates the qth step of iteration. In our case, x= [IWP, ht]is the retrieved result,y= [Tcir2, Tcir4, Tcir5]is the
observation, and Tcir(q) can be calculated using Eq. (2) and x(q). K is the Jacobian matrix, which is defined as
K= "∂Tcir
∂IWP ∂Tcir
∂ht
# =
" Tcir0
H ·e
−IWP/H −Tcir0·IWP
H2 ·e
−IWP/H·(c
1+2c2ht) #
. (6)
Plotted in Fig. 5 are the analytical solutions of K using the coefficients listed in Table 1 and Eq. (6). ∂Tcir/∂IWP (left column of Fig. 5) monotonically increases with IWP for all three channels without any singularity point or mul-tiple solutions. However,∂Tcir/∂ht (right column of Fig. 5) has a singularity point atht=18 km for CH#2, where mul-tiple solutions exist. For CH#5, mulmul-tiple solutions can also occur forht. If we define the bottom of the∂Tcir/∂ht curve as htcritical, then the smaller the IWP is, the higherhtcritical is.
For instance,htcritical at IWP = 3.0 kg m
−2is 18 km, meaning that if the cloud hasht>18 km and IWP = 3.0 kg m−2, the
Figure 5. Analytical solutions of the two components of the Jaco-bian matrix K:∂Tcir/∂IWP with fixedht(left) and∂Tcir/∂htwith fixed IWP (right). For the left column, the fixedhtvalue increases from 6 (thin, blue) to 20 km (thick, red) with an interval of 2 km. For the right column, the fixed IWP value increases from 0.5 (thin, blue) to 18 kg m−2(thick, red) with an interval of 2.5 kg m−2.
retrievedhthas a possibility of being underestimated. The K matrix responses at CH#2 and CH#5 suggest that theht re-trieval could significantly underestimate the truth when cloud top is above 18 km, especially for thick, dense clouds.
a= [IWP0, ht0]is the a priori (initial guess) ofx. In
prac-tice, ifTcirfrom all three channels is less than−5 K, there is a strong possibility of ice cloud presence, andht0is set to 5 km
to speed up the convergence of the iteration. Otherwise,ht0
is set to 0 km instead. The initial guess of IWP0is always set to 0. Once the iteration begins,ais forced to equal tox(q)to avoid “artificial preference” of retrievals to the a priori. That is to say, the last term on the right-hand side of Eq. (5) can be eliminated. The total number of iteration steps is set to 20 re-gardless of whether the final results converge or not. Within each iteration, IWP(q)is not allowed to exceed 25 kg m−2or become negative, and theh(q)t value must be within the range of [0, 18] km. The lower bounds assure physically meaning-ful solutions. The upper bound of ht is where CH#2 and CH#5 are problematic in retrieving a trustablehtwith the set of coefficients listed in Table 1. Therefore, the protection of thehtsolution again significantly under-evaluates theht for those high, dense clouds. Nevertheless, IWP rarely exceeds 25 kg m−2, and the monochromaticity ofK with respect to IWP assures the robustness of IWP retrievals.
iteration, which needs to be small in very nonlinear cases where multiple solutions exist and large steps could result in an unstable retrieval. Since the retrieval function is mono-tonic for all channels, a large stepSa= [6 kg m−2, 6 km]2is chosen, as in the so-called Newtonian iteration, to acceler-ate the retrieval convergence. OnceSyandSaare fixed,Sxat each iteration step can then be calculated from Eq. (5), which is shown as Eq. (7):
Sx= [KTS−y1K+S−a1]−1. (7) The retrieval is not carried out if Tcir at all three chan-nels is greater than 5 K, a strong indication of a clear sky. In that case, we directly assign a clear-sky flag to the scene. CH#2 radiance is excluded for retrievals over arid areas be-cause of its contamination by surface signals. This is real-ized by checking land pixels with Tcir<−5 K for all three channels (i.e., ice cloud likely). As long as this criterion is not satisfied, only CH#4 and CH#5 are used for the retrieval over land, whereas CH#2 is always used over oceans. Af-ter retrieval, the IWP value that has the standard deviation (√Sx[1]) greater than or equal to itself is flagged as “bad quality”; so isht. The rest is flagged as “good quality”.
4 Assessment of IWP andhtretrievals
Comparisons of IWP retrievals have been challenging and sometimes even confusing because not all sensors measure the same portion of pIWP. Different cloud bottom and top heights can affect the cloud ice sensitivity and retrieval re-sults. For MHS, the channel penetration depth varies with water vapor loading above cloud and with liquid water amount inside clouds if it is a mixed-phase case. In addition, cloud inhomogeneity along LOS introduces more uncertain-ties to this comparison task. Active microwave sensors such as CloudSat do not have the penetration depth issue for most clouds. In this study we treat its IWP as the truth when com-paring it with the measurements from passive sensors (e.g., Wu et al., 2009). Since the retrieval algorithm developed here is constrained by CloudSat IWP, the IWP retrieved from MHS is expected to be statistically close to CloudSat cloud ice. In other words, MHS penetration depth is “extrapolated” to reveal the total column IWP using this algorithm. In this section we compare the PDFs of monthly IWP as well as the mean IWP maps for MHS and CloudSat data.
4.1 Comparison of IWP PDFs
Normalized PDF has been used to compare the cloud ice products and sensitivities from multiple sensors (Su et al., 2009; Wu et al., 2009). The fundamental assumption of this approach is that cloud ice should have the same probability distribution if both sensors are measuring the same ensem-ble of clouds (e.g., in similar latitude regions and local time). Unlike the apple-to-apple comparison, vast data can be di-gested in one PDF plot that reveals ample information. The
Figure 6. PDFs of CloudSat IWP (grey thick line; smoothed over 15 CloudSat footprints and integrated between 5 and 19 km), all re-trieved MHS IWP (black solid line; from all views), rere-trieved MHS IWP that is quality controlled (black dots), and MSPPS IWP (black crosses; from all views; from NOAA-18 only) for August 2010 in the tropics.
basic philosophy of this approach is that the variable of in-terest should have the same probability of observing a certain value with what nature shows within the product’s visibility range. Therefore, if the probability is smaller (greater) than that from the truth, the variable (e.g., cloud occurring fre-quency) is under-(over-)estimated. The PDF comparison also overcomes the instrument geometry difference, as explained in Wu et al. (2009).
As expected for the CloudSat-constrained retrieval, MHS IWP PDF agrees well with CloudSat, as shown by the grey and black lines in Fig. 6. The decreasing probability with IWP reflects the natural variability of cloud ice. CloudSat IWPs here are 15-FOV averaged values in order to mimic the MHS footprint diameter, which is slightly steeper than the original (non-averaged) PDF, or a higher (lower) possi-bility at smaller (larger) IWP. The averaging effect (<10 % in PDF values) is negligible compared to the differences among various data sets/retrievals. When all good and bad retrievals from the 90 MHS views are included, the PDF (solid black line) in Fig. 6 rises more sharply at small IWPs (∼500 g m−2) due to the arbitrary retrieval suppression for negative IWP values and false detection of clear-sky scenes. The dropping PDF at IWP<500 g m−2 is mostly noise. When the quality flag is applied to exclude bad retrievals, the PDF (dots) agrees better with CloudSat at IWP>300 g m−2. At large values (>8×10³g m−2), our algorithm tends to slightly over-estimate IWP when compared to CloudSat.
Figure 7.Tcirat CH#2 (a), CH#4 (b) and CH#5 (c) and retrieved NOAA-18 MHS IWP (d),ht(e) and MSPPS IWP (f) for Hurricane Earl at 01:54 LST on 31 August 2010 (Cuba is the island to the left of the plot). The IWP (ht) calculated from the collocated and coincident CloudSat overpasses (averaged onto MHS footprints) are marked by color crosses that share the same color bars with MHS. Note that the blank in the IWP map means that the IWP retrieval is not performed or has failed because it is below the sensitivity level of this algorithm, while CloudSat overpasses show a zero IWP value in most places away from the hurricane.
bias was also reported in other studies (e.g., Waliser et al., 2009; Eliasson et al., 2011).
The quality of our cloud ice retrieval is demonstrated clearly in a scene over Hurricane Earl on 31 August 2010 (Fig. 7a–c).Tcirin all three MHS channels captured the struc-ture of Hurricane Earl very well, showing the eye, eye wall and spiral rain bands. CH#2 radiances, penetrating the deep-est, reveal more ice cloud structures than other channels. The retrieved IWP from our algorithm (Fig. 7d) retains most of the fine structures in CH#2 and also shows a hint of an ad-ditional two outer arms. Although the values of these arms are below the noise level, they are probably real because they are also present in the geostationary satellite IR im-age (not shown). The IWP from CloudSat overpasses (col-ored crosses) have slightly larger values than MHS, whereas MSPPS operational IWP (Fig. 7f) are significantly smaller than CloudSat and our retrievals. This hurricane case also highlights the value of MHS IWP in studying the 2-D at-mospheric dynamics and cloud structures that are not cap-tured by the CloudSat curtain sampling. Using the CloudSat-constrained IWP measurements, we can obtain good spatial and temporal coverage from the MHS/AMSU-B sensors on-board all operational satellites.
Retrieved ht (Fig. 7e) also agree reasonably well with CloudSat, especially at the hurricane periphery and the eye wall, but are lower by∼4 km over the hurricane deck (13 km versus >18 km). This is probably due to the fact that the cloud top at the deck is dominantly higher than that at the hurricane periphery, i.e., higher than 18 km. They hence ex-ceed the upper limit of the reliable ht retrieval range from
our algorithm. Pixel-by-pixel comparisons are done for some other cases that have CloudSat cloud tops lower than 18 km, and thehtretrieval seems quite promising (not shown). Nev-ertheless, thehtretrieval here is mainly to improve IWP re-trieval, rather than the purpose of scientific study.
As the first CloudSat-calibrated column-wise IWP mea-surement that has excellent spatial coverage, the MHS IWP retains numerous potential usages for model input, for val-idation of other instrument measurements and for model-observation comparisons in the future.
4.2 Geographic distribution of IWP
Figure 8. Monthly averaged IWP from CloudSat and MHS ascending (a, b) and descending (c, d) orbits during August 2010. MHS IWP is averaged over all views. Data are sampled to 5◦×5◦grid boxes.
day–night differences in ice cloud thickness seen in CloudSat are also evident in the MHS maps, e.g., in central America and central Africa.
Interestingly, in the scatter plot of MHS and CloudSat IWPs at a logarithm scale, the correlation is not along the 1 : 1 line, showing a higher bias in MHS at smaller IWP values. The overall regression yields IWPCloudSat=(0.83± 0.017)IWPMHS−14.7 [g m−2], shown as the blue dots in Fig. 9b. The−14.7 g m−2offset partly comes from elevated topographies, e.g., the Andes, and from deserts, e.g., central Australia. The bias is slightly worse during night (MHS de-scending orbit) than during the day (MHS ade-scending orbit). If CH#2 is included for the MHS IWP retrievals over land, the high bias would increase over Australia, which may sug-gest a warm bias in MERRA surface temperature or aprob-lem with surface emmisivity in that region during nighttime (i.e., a cold bias ofTcirfor CH#2). It is suggested that our re-trieval algorithm has some limitations over complicated sur-face conditions, which will be discussed in the next section. Part of the−14.7 g m−2offset is caused by the fact that MHS tends to slightly over-estimate IWP with respect to Cloud-Sat, especially for thick and dense clouds. Besides, CloudSat probably misses some convections due to its sampling bias, for instance, over the Amazon rainforest and the maritime continent. Visual comparison between MODIS ice cloud op-tical depth (Fig. 7 of Meyer et al., 2007) and MHS IWP shows better agreement in these regions. It is worth mention-ing that collocated MHS-CloudSat retrieved IWP showed the same feature. However, by subtracting the square root of the error (Sx), MHS IWP does not have such a positive bias (not shown). Therefore, despite the fact that MHS is still noisy below 0.5 kg m−2at a single retrieval, the error estimation is very reasonable, and helps in filtering out the bad retrievals. 4.3 Limitations of the algorithm
The empirical forward model (Tcir–IWP relationships) and retrieval algorithm presented in this paper are designed for tropical regions and have difficulties in retrieving IWP over
Figure 9. (a) is the same as Fig. 6, except from different latitude bins (see sub-titles for the latitude range). (b) is the scatter plot of MHS (abscissa) and CloudSat (ordinate) gridded monthly mean IWP for latitude bins between[25◦S, 25◦N] (blue filled dots),[25◦, 30◦] N, and S (light blue triangle). The map grid size is 5◦×5◦, and data are then smoothed by a two-point window along latitude and longitude before making the scatter plot. The black thick (thin) line marks the 1 : 1 (1 : 5 and 5 : 1) ratio.
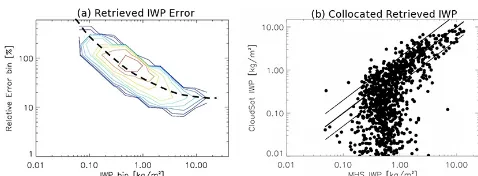
Figure 10. (a) PDF of relative error (√SIWP/IWP, %) of one-month retrieved IWP between 30◦S and 30◦N. Contours are in log scale. The peak of the PDF is roughly marked by hand to rep-resent an exponential decrease (thick dashed line). (b) Collocated CloudSat-MHS IWP retrievals for July 2010 within the same lati-tude band. The thick solid line is the 1 : 1 line, and the other two thin solid lines mark the 1 : 2 and 2 : 1 ratios, respectively.
The parameters in Table 1 assume that the atmospheric temperature lapse rate γ is constant in the tropics. As pre-dicted by Wu and Jiang (2004) using CRM, the Tcir–IWP relationship is also a function ofγ (Fig. 6.10 therein). Eval-uating the PDFs of retrieved IWP outside the tropics, we find that the PDF of extratropical IWP starts to oscillate at its large-value tail (Fig. 9a) compared with that in the trop-ics (Fig. 6). The quality-controlled PDF in this case is still comparable with CloudSat PDF though for this bin assum-ing a 100 % tolerance level of the PDF difference. Hence, our algorithm is expected to perform well within latitudes of 30◦N, S, but degrades in the extratropics. The mean vertical temperature profiles are also similar to those in the tropics up to 30◦in latitude (Fig. 6.9 in Wu and Jiang, 2004). At middle
to high latitudes beyond 30◦, the quality-controlled PDFs are
too low or even alter its shape, and the retrieved MHS IWP merely correlate with CloudSat IWP (not shown). In future algorithm development, γ should be treated as an indepen-dent variable, such that the algorithm can be applied for IWP retrievals at higher latitudes.
Liquid clouds occur frequently below 5 km, where temper-ature is usually greater than 0◦C (Riedi et al., 2001), which may have little impact on CH#4 but can significantly af-fect CH#2 and CH#5Tcir. For deep convective clouds, liquid droplets can be lifted to a much higher altitude. The mixing of liquid droplets into ice cloud enhances the cloud emission contribution at microwave frequencies and hence decreases theTcirsensitivity to IWP. Wu and Jiang (2004) showed that this impact could be as large as 30–50 % in a strong mixed-phase case, which alters the relationship in Eq. (2) with dif-ferent parameters. Therefore, mixed-phase clouds can con-tribute significantly to the spread of the 2-D PDF shown in Figs. 3 and 4.
Water vapor above and inside cloud plays a screening role in reducing the sensitivity to IWP, in a way similar to liquid droplets. Since CH#4 and CH#5 are water vapor channels, they are sensitive to the water vapor abundance above and inside ice clouds. As a result,Tccrcalculation could be biased
if MERRA water vapor is too dry or too wet above clouds. The water vapor impact was only evaluated using CRM with different water vapor profiles, assuming variability within the uncertainty of observed upper-troposphere water vapor. The water vapor impact is found to be small and negligible in these CRM simulations (less than 5 % with doubling water vapor amount above clouds).
4.4 Error analysis
The retrieval error (Sx) provides a direct estimate of the re-trieval uncertainty. This uncertainty is completely indepen-dent of CloudSat IWP retrieval uncertainty. There are fur-ther sources of error, for example, the imperfect “coincident collocation”, the uncertainty induced by limited collocation samples, cloud misclassifications, etc. The total error is a combination of the three. This section will be focused on de-lineating the error sources and quantifying them one by one. The retrieval errorSxis a dependent of the observational uncertainties from MHS (Sy) and from the forward model (K matrix), represented by Eq. (7). For small IWP values (thin ice cloud),Sx is dominated by Sy (i.e., MHS instru-ment noise). SinceSy is fixed at 5 K for all three channels, this algorithm loses its sensitivity for IWP values smaller than 0.5 kg m−2, which is evident in Figs. 9a and in 10b. For large IWP values (thick or precipitating ice cloud),Sxis con-trolled by the uncertainty of the forward model. In the case whenTcir saturates (i.e., smaller thanTcir0 in Table 1), the forward model uncertainty is infinite as the Jacobian curve of the K matrix with respect to IWP flattens out fromTcir0 onward. However, the K matrix is still very sensitive to IWP as long asTcirdoes not saturate, as shown in Fig. 5. There-fore, the induced error inSxfrom the forward model uncer-tainty is relatively small for large IWP values. This is con-firmed by Fig. 10a, where the percentage range of retrieval error (√SIWP/IWP) decreases quickly from above 100 % at small IWP values to as low as 20 % at large IWP values (IWP>1 kg m−2). Error is also reflected in the retrieval re-sults, shown in one month’s worth of collocated CloudSat-MHS IWP retrievals in Fig. 10b. It is apparent that collocated retrievals are highly agreeable above 1 kg m−2, while MHS tends to overestimate thin cloud IWP.
misclassification as described in the above paragraph. How-ever, imperfect clear-sky background (Tccr) can also cause a bias in Tcir, which can also induce cloud misclassification. One thing to notice is that the error of clear-sky radiance is internally included in Sy, asSy is directly estimated from TB–Tccr.
As truth is not given in our case, CloudSat is again used as the “truth” since the philosophy of this paper is to align MHS measurements with those of CloudSat. Two types of cloud misclassification exist: for one thing, MHS treats a footprint as an ice cloud being present, but collocated Cloud-Sat measurements averaged onto the same MHS footprint do not report a positive IWP value. This is named “Type I” mis-classification; for the other, which is on the contrary, it is called “Type II” misclassification. All collocated CloudSat-MHS observations between 30◦S and 30◦N are compared
through the entire year of 2010 to generate the statistics. For Type I misclassification, there is an 18.1 % chance that MHS will detect an ice cloud but CloudSat will not, among which only 1 % of the MHS retrieval reports an IWP greater than 0.5 kg m−2 (noise level). That means that using our tech-nique, MHS nearly never misclassifies a clear-sky scene as cloudy sky and reports an IWP value beyond its noise level. Interestingly, the 18.1 % misclassification cases do not pre-fer mountain or snowy regions like the Andes, albeit there is a slight enhancement of occurring frequency over the Aus-tralian desert. The latter is expected as discussed in Sect. 4.3. For Type II misclassification, there is a 45.8 % chance that CloudSat will detect an ice cloud but MHS will not. Among these cases, 90.5 % of the time CloudSat reports an IWP value less than 0.5 kg m−2. All in all, our technique shows a very strong confidence level for retrieved values greater than the detection threshold (2 and 4 % misclassification rate for Type I and II, respectively), which means that our tech-nique nearly never misses a thick ice cloud, even when the surface signal is complicated. On the other hand, our tech-nique misses or gives large retrieval uncertainties of thin ice clouds like cirrus, which are not very important hydrologi-cally (Fig. 8) but are important to the radiation budget.
It is difficult to justify the magnitude of other errors, which are blended in the error bars of the fitted curves in Fig. 4. The IWP error bar can be as large as ±1 kg m−2at IWP = 3 kg m−2 for CH#4. Given the fact that the retrieval error should be smaller than any of the error bars generated from each individual channel, it is fairly reasonable to claim that the total retrieval error would be smaller than 100 % when the retrieved IWP is beyond the detection threshold.
The overall retrieval error from this algorithm is quite small. As a matter of fact, it reflects the “precision” of the instrument and the forward model rather than the total er-ror. One should always keep in mind that this is the error on top of the CloudSat IWP retrieval uncertainties. SPARE-ICE by Holl et al. (2014) showed a larger error in general, but their algorithm could quantitatively evaluate the contri-bution from each source, including CloudSat itself. The two
algorithms are not directly comparable since we are under different metrics. Our algorithm meets the goal presented at the beginning, that to make cross-platform, cross-instrument consistent retrievals.
5 Conclusions
A fast empirical forward model built uponTcir–IWP relation-ships at MHS 157, 183.3±3 and 190.3 GHz channels is de-veloped and used to retrieve tropical cloud IWP from MHS radiance measurements. TheTcir–IWP relationships at these channels are dependent on cloud top heighthtin the tropics (Fig. 4), and the algorithm for retrieving IWP andht simulta-neously can improve the IWP accuracy. The IWP PDFs from MHS and CloudSat retrievals agree quite well, as expected for this constrained empirical forward model, over a wide dy-namic range of cloud ice (IWP = 0.5–10 kg m−2, Fig. 6). The retrieval errors are also about the same magnitude (smaller than 100 %, Fig. 10). The empirical forward model is valid for clouds withht lower than 18 km and IWP greater than 0.5 kg m−2, but only in the tropics between 30◦S and 30◦N at present (Fig. 9). Beyond that latitude range, temperature lapse rate variations need to be taken into account to refine theTcir−IWP relationship. In addition, the algorithm is not accurate for retrieving IWP over elevated and arid topogra-phy (Fig. 8).
Producing a CloudSat-consistent MHS IWP product has several direct benefits and important implications for study-ing clouds. Firstly, it helps to extend CloudSat cloud cov-erage with a wider swath width because frequent sampling from different operational satellites will allow frequent up-dates of fast-evolving weather phenomena such as hurri-canes and frontal systems. The new data can be used to im-prove weather prediction (e.g., cloud diurnal cycle) and long-term regional climate monitoring (e.g., IWP trend). Sec-ondly, our improved IWP retrieval method renders gener-ally larger IWP values than the NOAA operational product (Figs. 6 and 7). The approach we implemented with high-frequency microwave channels improves cloud detection in scenes with high IWP. Compared with CloudSat monthly cli-matology as well as the single-orbit measurements, we found that our results are closer to the CloudSat integrated ice wa-ter path. Thirdly, we show that replacing the 89 GHz chan-nel with 183.3 GHz chanchan-nels for cloud ice retrieval reduces false detection of ice clouds and improves sensitivity to IWP as the higher-frequency channels are more sensitive to ice particle scattering. Lastly, the derived empiricalTcir−IWP relationships can be used to evaluate RTM simulations of cloudy-sky radiances, validate model assumptions, and im-prove model skills for data assimilation applications in the future (Fig. C1).
the NOAA and Metop operational satellites for obtaining a longer data record and more frequent coverage. It can also be applied to other instruments that have the same combina-tion of channels, for example the Advanced Technology Mi-crowave Sounder (ATMS) onboard the Suomi-NPP satellite, or the Special Sensor Microwave Imager/Sounder (SSMI/S) onboard the Air Force F-16, F-17 and F-18 satellites.
Appendix A: Converting off-nadirTcirto nadirTcir
The collocation occurrences near outmost views are too few to form a statistically meaningfulTcir–IWP relationship, as shown in Fig. 2. An alternative way is to seek a conversion factor such that the PDF of converted off-nadirTcirmatches that of the nadirTcir, in which case the nadirTcir–IWP rela-tionship can then be applied.
If the cloud layer can be assumed to be plane-parallel and is not completely opaque to MHS, PDFside·cosζ=PDFnadir roughly holds (thick solid lines in Fig. A1a), whereζ is the zenith angle. This relationship means that, with equal proba-bility of seeing a cloud, the off-nadir cloudTciris colder than that from the nadir view, mainly due to the longer integration length of cloud water paths. However, such a relationship be-gins to lose its validity as the ice clouds become opaque at oblique views. As shown in Fig. A1b, the PDF curves be-come much more flat atTcir= −100 K compared with those atTcir= −50 K. A factor of cos(ζ /2.1)can roughly capture such a view dependency. In the most extreme case, where Tcirsaturates at all view angles, the PDFs should become in-dependent of the view angle, where the factor can be set as cos(ζ /∞).
By definingF =cos(ζ /fac), we can convert the off-nadir Tcirto the equivalent nadirTcirby multiplying the former by F, i.e.,
Tcir|side·F =Tcir|equivalent nadir. (A1) fac=f (Tcir, CH#) is a function of Tcir and the choice of channel number, which is estimated from the observation to follow such relationships:
fac(CH#2)=
0.7764·e−0.0077Tcir ifT
cir>−120 K
1 if 0.7764·e−0.0077Tcir <1
100 ifTcir≤ −120 K
(A2)
fac(CH#4)=
0.0013·e−0.1034Tcir ifT
cir>−120 K
1 if 0.0013·e−0.1034Tcir <1
100 ifTcir≤ −80 K
(A3)
fac(CH#5)=
0.8160·e−0.0098Tcir ifT
cir>−120 K
1 if 0.8160·e−0.0098Tcir <1
100 ifTcir≤ −120 K
(A4)
Appendix B: Correction ofTcirfor CH#2
As shown by the black line in Fig. 1a, the PDF peak forTcir of CH#2 is at 2 K instead of 0 K at the nadir view. Further
Figure A1. PDF ofTcirin the range of [−100,−99 K] (a) and [−50, −49 K] (b) as a function of scan angle derived from a month of NOAA-18 MHSTcirdata (December 2010). Thick solid curves are calculated from the mean PDF values averaged over the 10 nadir-view FOVs divided by a factor of cos(ζ /2.1)(a) and cosζ(b), re-spectively, and are used to fit the observed PDF curves.ζ is the zenith angle.
examination of other months ofTcir PDFs for this channel shows the same warm bias (named as 1T). At off-nadir views,1T becomes smaller, which follows the theoretical clear-sky limb-darkening curve1Tnadir·cosζ=1Tside. This means that the estimatedTccrfor clear skies has a systematic error at 157 GHz, which could originate from the inaccuracy of MERRA surface emissivity or errors inside CRTM. To ac-count for this offset, allTcirvalues for CH#2 are subtracted from this offset before carrying out the retrieval:
Tcir(CH#2)=Tcir(CH#2)calculated−2·cosζ (B1)
Appendix C: Comparison with RTM simulations As one of the most important motivations of this work, it is worthwhile checking whether the existing operational RTMs can reproduce the observedTcir–IWP relationship. Some re-search RTMs that have more sophisticated radiative trans-fer treatment produced comparable results with observations (e.g., Davis et al., 2007; Kulie et al., 2010). However, some of the major operational RTMs still have large biases in high-frequency microwave channels, which result in poor usage of cloudy/precipitating scenes observed by instruments such as MHS and SSMI. The goals of this exercise are hence to quan-tify operational model uncertainties and to determine how reliable these RTMs are for calculating cloudy-sky radiances as observed by satellite microwave channels/instruments. We would also like to identify possible causes of these model er-rors and develop a quick remedy for these operational mod-els. Since this problem by itself is very complicated, it will only be touched briefly in the appendices here, and a paper to explore further details is underway.
to generate MLS cloud products. In both models, three ice clouds are fed in one by one, with cloud bottoms at 7.5 km and cloud tops at 10, 12 and 14 km, respectively. Two cloud shapes (convection with anvil cloud top; Gaussian shape) are tested. Since their results differ little, the first cloud shape is applied to all following studies. US standard atmosphere in the tropics is used as the background atmosphere. For the cloud droplet size distribution, CRM has several options. Only McFarquhar–Heymsfield (MH) and Gamma distribu-tions are tested with different combinadistribu-tions of parameter val-ues. MH distribution was applied to deliver MLS IWC prod-ucts (Wu et al., 2009), and Gamma size distribution was as-sumed for CloudSat ice water product retrievals (Austin et al., 2009). In CRTM, only the cloud ice effective radius is tunable with fixed-width Gamma size distribution assump-tion. Both models and the observation are compared at nadir view only.
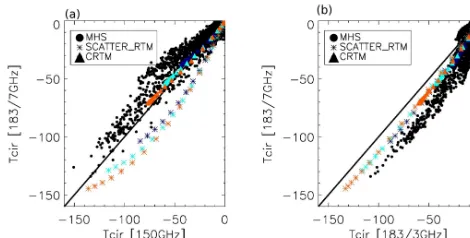
Comparing Tcir responses from different channels to the same cloud is a straightforward yet very effective way of presenting many of the differences. As one can see from Fig. C1a, CH#2 should have a larger response to thin and medium thick clouds, and the penetration depths of CH#2 and CH#5 are about the same when they encounter dense and thick clouds. RawTBfrom the two channels showed the same features (not shown). CRTM produces almost identical reposes for CH#2 and CH#5, both of which are however too weak compared with the observation (triangles). CRM pro-duces comparable dynamical ranges ofTcir, with an effective radius of 160 µm and a width parameter of 2 (refer to Evans et al. (1998) for the format of the Gamma distribution), but it always generates a weaker response for CH#2, contradicting the observation (crosses), while theTcir–IWP relationship for CH#5 is simulated quite well. The main caveat of CRM is that it only considers scattering while ignoring the ice emis-sion. The observed CH#2 / CH#5Tcirratio suggests that ice cloud emission offsets as much as 30 % of the cloud scat-tering impact for thin and medium thick clouds, while cloud scattering dominates for dense and thick clouds. Moreover, liquid droplets in mixed-phase clouds could contribute more to the emissions and further reduce the CH#5Tcirresponse. That may explain the difference between CRTM and the ob-servation.
The models simulate the observedTcirratio between CH#4 and CH#5 better, as shown in Fig. C1b. Nevertheless, mod-els tend to over-predict the CH#4 response. Because CH#4 is closer to the 183.3 GHz water vapor absorption line, it is
Figure C1. Scatter plots ofTcirrelationships between CH#2 and CH#5 (a), and CH#4 and CH#5 (b) from observedTcir at MHS nadir view (black dots), simulatedTcirfrom CRTM (colored trian-gles) and from CRM (colored stars). Blue/cyan/red colors represent cloud layer with tops at 10, 12 and 14 km and bottoms at 7.5 km in the simulations.
more sensitive to water vapor variations than CH#5. There-fore, the air above the cloud top might have been drier than the ambient air to lead to a smaller magnitude of CH#4Tcir. This derivation is supported by some observational evidences for deep convective clouds (e.g., Chae et al., 2011). Again, CRTM overall produces weaker Tcir, probably due to the heavy extrapolation from thin cloud LUT to thicker clouds, and the narrow fixed-width Gamma size distribution.
Acknowledgements. This work is performed at the NASA
Goddard Space Flight Center with support from the NASA NNH10ZDA001N-ESDRERR (Earth System Data Records Un-certainty Analysis) project. The authors are grateful to S. Buehler, V. John, I. Moradi, and S. Wong for helpful discussions and comments. We thank the two anonymous referees for their reviews. AAPP is provided by the EUMETSAT network of satellite applica-tion facilities.
Edited by: D. Cimini
References
Amiridis, V., Wandinger, U., Marinou, E., Giannakaki, E., Tsekeri, A., Basart, S., Kazadzis, S., Gkikas, A., Taylor, M., Baldasano, J., and Ansmann, A.: Optimizing CALIPSO Saharan dust retrievals, Atmos. Chem. Phys., 13, 12089–12106, doi:10.5194/acp-13-12089-2013, 2013.
Atkinson, N. C.: Calibration, monitoring and validation of AMSU-B, Adv. Space. Res., 28, 117–126, 2001.
Austin, R. T., Heymsfield, A. J., and Stephens, G. L.: Retrievals of ice cloud microphysical parameters using the CloudSat millimeter-wave radar and temperature, J. Geophys. Res., 114, D00A23, doi:10.1029/2008JD010049, 2009.
Arriaga, A.: Technical memorandum No.5: Microwave Humidity Sounder (MHS) simulations with a radiative transfer model, EU-METSAT technical report, 2000.
Buehler, S. A., Kuvatov, M., and John, V. O.: Scan asym-metries in AMSU-B data, Geophys. Res. Lett., 32, L24810, doi:10.1029/2005GL024747, 2005.
Chae, J. H., Wu, D. L., Read, W. G., and Sherwood, S. C.: The role of tropical deep convective clouds on temperature, water vapor, and dehydration in the tropical tropopause layer (TTL), Atmos. Chem. Phys., 11, 3811–3821, doi:10.5194/acp-11-3811-2011, 2011.
Chahine, M. T.: The hydrological cycle and its influence on climate, Nature, 359, 373–380, 1992.
Chen, F. W. and Staelin, D. H.: AIRS/AMSU/HSB precip-itation estimates, IEEE T. Geosci. Remote, 41, 410–417, doi:10.1109/TGRS.2002.808322, 2003.
Chen, W.-T., Woods, C. P., Li, L. F., Waliser, D. E., Chern, J.-D., Tao, W.-K., Jiang, J. H., and Tompkins, A. M.: Partition-ing CloudSat Ice Water Content for Comparison with Upper-Tropospheric Ice in Global Atmospheric Models, J. Geophys. Res., 116, D19206, doi:10.1029/2010JD015179, 2011.
Davis, C. P., Evans, K. F., Buehler, S. A., Wu, D. L., and Pumphrey, H. C.: 3-D polarised simulations of space-borne passive mm/sub-mm midlatitude cirrus observations: a case study, Atmos. Chem. Phys., 7, 4149–4158, doi:10.5194/acp-7-4149-2007, 2007. Eliasson, S., Buehler, S. A., Milz, M., Eriksson, P., and John, V.
O.: Assessing observed and modelled spatial distributions of ice water path using satellite data, Atmos. Chem. Phys., 11, 375– 391, doi:10.5194/acp-11-375-2011, 2011.
Evans, K. F., Walter, S. J., Heymsfield, A. J., and Deeter, M. N.: Modeling of Submillimeter Passive Remote Sensing of Cirrus Clouds, J. Appl. Meteorol., 37, 184–205, 1998.
Ferraro, R.: NOAA AIWP algorithm website, available at: http://www.star.nesdis.noaa.gov/corp/scsb/mspps/algorithms. html#AIWP(last access: 23 June 2014), 2007.
Gong, J. and Wu, D. L.: View-angle dependent AIRS cloudiness and radiance variance: analysis and interpretation, J. Geophys. Res., 118, 2327–2339, doi:10.1002/jgrd.50120, 2013.
Holl, G., Buehler, S. A., Rydberg, B., and Jiménez, C.: Collocat-ing satellite-based radar and radiometer measurements – method-ology and usage examples, Atmos. Meas. Tech., 3, 693–708, doi:10.5194/amt-3-693-2010, 2010.
Holl, G., Eliasson, S., Mendrok, J., and Buehler, S. A.: SPARE-ICE: Synergistic ice water path from passive operational sensors, J. Geophys. Res., 119, 1504–1523, 2014.
John, V. O., Holl, G., Buehler, S. A., Candy, B., Saunders, R. W., and Parker, D. E.: Understanding inter-satellite biases of mi-crowave humidity sounders using global SNOs, J. Geophys. Res., 117, D02305, doi:10.1029/2011JD016349, 2012.
John, V. O., Holl, G., Atkinson, N., and Buehler, S. A.: Monitoring scan asymmetry of microwave humidity sounding channels using simultaneous all angle collocations (SAACs), J. Geophys. Res., 118, 1536–1545, doi:10.1002/jgrd.50154, 2013.
Kahn, B. H., Chahine, M. T., Stephens, G. L., Mace, G. G., Marc-hand, R. T., Wang, Z., Barnet, C. D., Eldering, A., Holz, R. E., Kuehn, R. E., and Vane, D. G.: Cloud type comparisons of AIRS, CloudSat, and CALIPSO cloud height and amount, At-mos. Chem. Phys., 8, 1231–1248, doi:10.5194/acp-8-1231-2008, 2008.
Kulie, M. S., Bennartz, R., Greenwald, T. J., Chen, Y., and Weng, F.: Uncertainties in Microwave Properties of Frozen Precipita-tion: Implications for Remote Sensing and Data Assimilation, J. Atmos. Sci., 67, 3471–3487, doi:10.1175/2010JAS3520.1, 2010. Lamquin, N., Stubenrauch, C. J., and Pelon, J.: Upper tro-pospheric humidity and cirrus geometrical and optical thickness: relationships inferred from 1 year of collocated AIRS and CALIPSO data, J. Geophys. Res., 113, D00A08, doi:10.1029/2008JD010012, 2008.
Li, J.-L., Li, F., Waliser, D. E., Chen, W.-T., Guan, B., Kubar, T., Stephens, G., Ma, H.-Y., Deng, M., Donner, L., Seman, C., and Horowitz, L.: An observationally based evaluation of cloud ice water in CMIP3 and CMIP5 GCMs and contemporary reanal-yses using contemporary satellite data, J. Geophys. Res., 117, D16105, doi:10.1029/2012JD017640, 2012.
Liu, Q. and Weng, F.: Advanced Doubling–Adding Method for Ra-diative Transfer in Planetary Atmospheres, J. Atmos. Sci., 63, 3459–3465, 2006.
Livesey, N. J., Snyder, W. V., Read, W. G., and Wagner, P. A.: Retrieval algorithms for the EOS Microwave Limb Sounder (MLS), IEEE T. Geosci. Remote., 44, 1144–1155, doi:10.1109/TGRS.2006.872327, 2006.
Meyer, K., Yang, P., and Gao, B.-C.: Tropical ice cloud op-tical depth, ice water path, and frequency fields inferred from the MODIS level-3 data, Atmos. Res., 85, 171–182, doi:10.1016/j.atmosres.2006.09.009, 2007.
McFarquhar, G. M. and Heymsfield, A. J.: Parameteri-zation of tropical cirrus ice crystal size distributions and implications for radiative transfer: results from CEPEX, J. Atmos. Sci., 54, 2187–2200, doi:10.1175/1520-0469(1997)054<2187:POTCIC>2.0.CO;2, 1997.
Protat, A., Bouniol, D., Delanoe, J., O’Connor, E., May, P. T., Plana-Fattori, A., Hasson, A., Gorsdorf, U., and Heymsfield, A. J.: As-sessment of Cloudsat Reflectivity Measurements and Ice Cloud Properties Using Ground-Based and Airborne Cloud Radar Ob-servations, J. Atmos. Ocean. Tech., 26, 1717–1741, 2009. Pulliainen, J. and Hallikainen, M.: Retrieval of Regional Snow
Wa-ter Equivalent from Space-Borne Passive Microwave Observa-tions, Remote. Sens. Environ., 75, 76–85, 2001.
Ramaswamy, V. and Ramanathan, V.: Solar absorption by cirrus clouds and the maintenance of the tropical upper troposphere thermal structure, J. Atmos. Sci., 46, 2293–2310, 1989. Richter, J. and Rasch, P.: Effects of convective momentum transport
on the atmospheric circulation in the Community Atmosphere Model, version 3, J. Climate, 21, 1487–1499, 2008.
Riedi, J., Goloub, P., and Marchand, R. T.: Comparison of POLDER cloud phase retrievals to active remote sensors measurements at the ARM SGP site, Geophys. Res. Lett., 28, 2185–2188, 2001. Rodgers, C. D.: Inverse methods for atmospheric science, theory
and practice, World Scientific, 2000.
Seo, E.-K. and Liu, G.: Determination of 3-D cloud ice water con-tents by combining multiple data sources from satellite, ground radar, and a numerical model, J. Appl. Meteorol., 45, 1494–1504, doi:10.1175/JAM2430.1, 2006.
Soden, B. J.: Tracking upper tropospheric water vapor radiances: A satellite perspective, J. Geophys. Res., 103, 17069–17081, doi:10.1029/98JD01151, 1998.
Stephens, G. L., Tsay, S. C., Stackhouse, P. W., and Flatau, P. J.: The relevance of the microphysical and radiative properties of cirrus clouds to climate and climatic feedback, J. Atmos. Sci., 47, p. 1742, 1990.
Su, H., Jiang, J. H., Stephens, G. L., Vane, D. G., and Livesey, N. J.: Radiative effects of upper tropospheric clouds observed by Aura MLS and CloudSat, Geophys. Res. Lett., 36, L09815, doi:10.1029/2009GL037173, 2009.
Sun, B., Reale, A., Seidel, D. J., and Hunt, D. C.: Comparing radiosonde and COSMIC atmospheric profile data to quantify differences among radiosonde types and the effect of imper-fect collocation on comparison statistics, J. Geophys. Res., 115, D23104, doi:10.1029/2010JD014457, 2010.
Waliser, D. E., Li, J.-L. F., Woods, C. P., Austin, R. T., Bacmeister, J., Chern, J., Genio, A. D., Jiang, J. H., Kuang, Z., Meng, H., Minnis, P., Platnick, S., Rossow, W. B., Stephens, G. L., Sun-Mack, S., Tao, W.-K., Tompkins, A. M., Vane, D. G., Walker, C., and Wu, D.: Cloud ice: A climate model challenge with signs and expectations of progress, J. Geophys. Res., 114, D00A21, doi:10.1029/2008JD010015, 2009.
Wang, L.-K., Wu, X.-Q., Goldberg, M., Cao, C.-Y., Li, Y.-P., and Sohn, S.-H.: Comparison of AIRS and IASI radiances us-ing GEOS imagers as transfer radiometers toward climate data record, J. Appl. Meteor. Clim., 49, 478–492, 2010.
Weng, F., Zhao, L., Ferraro, R. R., Poe, G., Li, X., and Grody, N. C.: Advanced microwave sounding unit cloud and precipitation algo-rithms, Radio Sci., 38, 8068, doi:10.1029/2002RS002679, 2003. Wu, D. L. and Jiang, J. H.: EOS MLS Algorithm Theoretical Basis for Cloud Measurements, Technical Report, Jet Propulsion Lab-oratory, D-19299/CL#04-2160, ATBD-MLS-06, 2004.
Wu, D. L., Read, W. G., Dessler, A. E., Sherwood, S. C., and Jiang, J. H.: UARS/MLS Cloud Ice Measurements: Implications for H2O Transport near the Tropopause, J. Atmos. Sci., 62, 518–530, 2005.
Wu, D. L., Austin, R. T., Deng, M., Durden, S. L., Heymsfield, A. J., Jiang, J. H., Lambert, A., Li, J.-L., Livesey, N. J., McFar-quhar, G. M., Pittman, J. V., Stephens, G. L., Tanelli, S., Vane, D. G., and Waliser, D. E.: Comparisons of global cloud ice from MLS, CloudSat, and correlative data sets, J. Geophys. Res., 114, D00A24, doi:10.1029/2008JD009946, 2009.
Wu, D. L., Lambert, A., Read, W. G., Eriksson, P., and Gong, J.: MLS and CALIOP cloud ice measurements in the upper tropo-sphere: A constraint from microwave on cloud microphysics, J. Appl. Meteorol. Clim., 53, 157–165, doi:10.1175/JAMC-D-13-041.1, 2014.


![Figure A1. PDF ofspectively, and are used to fit the observed PDF curves.NOAA-18 MHScalculated from the mean PDF values averaged over the 10 nadir-view FOVs divided by a factor of cos− Tcir in the range of [−100, −99 K] (a) and [−50,49 K] (b) as a function](https://thumb-us.123doks.com/thumbv2/123dok_us/94862.1509929/15.612.308.546.65.177/figure-ofspectively-observed-mhscalculated-values-averaged-divided-function.webp)