www.solid-earth.net/7/285/2016/ doi:10.5194/se-7-285-2016
© Author(s) 2016. CC Attribution 3.0 License.
Classification and quantification of pore shapes in sandstone
reservoir rocks with 3-D X-ray micro-computed tomography
Mayka Schmitt1,2, Matthias Halisch2, Cornelia Müller2, and Celso Peres Fernandes1
1Porous Media and Thermophysical Properties Laboratory (LMPT), Mechanical Engineering Department, Federal University of Santa Catarina, Florianópolis – SC, 88040-900, Brazil
2Leibniz Institute for Applied Geophysics (LIAG), Dept. 5 – Petrophysics & Borehole Geophysics, GEOZentrum Hannover, Stilleweg 2, 30655 Hannover, Germany
Correspondence to: Matthias Halisch (matthias.halisch@liag-hannover.de)
Received: 3 November 2015 – Published in Solid Earth Discuss.: 4 December 2015 Revised: 19 January 2016 – Accepted: 22 January 2016 – Published: 15 February 2016
Abstract. Recent years have seen a growing interest in the characterization of the pore morphologies of reservoir rocks and how the spatial organization of pore traits affects the macro behavior of rock–fluid systems. With the availabil-ity of 3-D high-resolution imaging, such as x-ray micro-computed tomography (µ-CT), the detailed quantification of particle shapes has been facilitated by progress in computer science. Here, we show how the shapes of irregular rock par-ticles (pores) can be classified and quantified based on binary 3-D images. The methodology requires the measurement of basic 3-D particle descriptors (length, width, and thickness) and a shape classification that involves the similarity of arti-ficial objects, which is based on main pore network detach-ments and 3-D sample sizes. Two main pore components were identified from the analyzed volumes: pore networks and residual pore ganglia. A watershed algorithm was ap-plied to preserve the pore morphology after separating the main pore networks, which is essential for the pore shape characterization. The results were validated for three sand-stones (S1, S2, and S3) from distinct reservoirs, and most of the pore shapes were found to be plate- and cube-like, ranging from 39.49 to 50.94 % and from 58.80 to 45.18 % when the Feret caliper descriptor was investigated in a 10003 voxel volume. Furthermore, this study generalizes a practical way to correlate specific particle shapes, such as rods, blades, cuboids, plates, and cubes to characterize asymmetric parti-cles of any material type with 3-D image analysis.
1 Introduction
measure-286 Mayka Schmitt et al.: Classification and quantification of pore shapes in sandstone reservoir rocks ments has not been comprehensively reported in the
litera-ture.
X-ray miccomputed tomography (x-ray µ-CT) is a ro-bust technique that allows the three-dimensional (3-D) in-vestigation of many materials and enables the quantification of relevant microstructural features. Although the applica-tion of µ-CT in the geosciences was previously introduced by Ketcham and Carlson (2001) and Ketcham (2005), many investigations that analyze irregular particle shapes are still performed with 2-D approaches (Buller et al., 1990; Zhang et al., 2016; Petrak et al., 2015). So far, µ-CT studies of 3-D features have mostly been related to the characterization of volcanic rocks (Eiríksson et al., 1994; Riley et al., 2003; Shea et al., 2010; Vonlanthen et al., 2015) or spheroidal ob-jects (Robin and Charles, 2015), and these features are usu-ally described by means of equivalent size or shape param-eters, such as roundness or aspect ratio (Little et al., 2015; Saraji and Piri, 2015). Nevertheless, these intuitive descrip-tors provide more qualitative denotation and might obscure information regarding the original particle shape. Recently, McGrath et al. (2015) reported the difficulty in characteriz-ing the 2-D and 3-D shapes of “free gold” particles in a flash flotation by means of circularity and sphericity. These au-thors concluded that these measurements cannot adequately describe the diverse shapes of irregularly shaped particles. Available high-resolution techniques might provide qualita-tive and quantitaqualita-tive pore structure information. However, many materials, including sedimentary rocks, lack informa-tion regarding the deep comprehension of irregular particle (pores or grains) shape analysis and a systematic way of clas-sifying it, e.g., describing it to be similar to artificial object forms. A detailed pore shape characterization is necessary among many applications and can be used to infer the domi-nant mechanisms that act in a heterogeneous rock in response to its macro properties. Additionally, numerical methods and pore shape description are essential to optimize and to study parameter variations that influence laboratory measurements systematically.
In this study, the pore shapes of three sandstone rocks from distinct fields were analyzed and classified based on the x-ray µ-CT approach. This method involves counting and mea-suring detached pore objects directly from three-dimensional images. The 3-D images of the analyzed rocks were acquired at similar resolutions, and two main pore constituents were identified and defined: (i) main connected pore networks and (ii) disconnected pore ganglia. A watershed algorithm was applied to separate the main pore networks into individual pores to preserve the essential pore morphology, and the most suitable marker extent parameter (as it will be discussed in Sect. 3.2.) was defined. Three subsamples with volumes of 10003, 5003, and 2503voxels were extracted from each rock to investigate the effect of sample size on the pore shape classification. The advantage of using the proposed approach is that shape parameters can be calculated directly from the preserved pore textures with no need for equivalent volume
(sphere or resistor) conversion, which creates inaccurate re-sults for the shape classification. Additionally, the image vi-sualization and analysis are completely automated and per-formed in the Avizo Fire software for an unlimited number of particles, which are geometrically described to facilitate the quantification analysis.
1.1 Geometrical aspects of 3-D particles
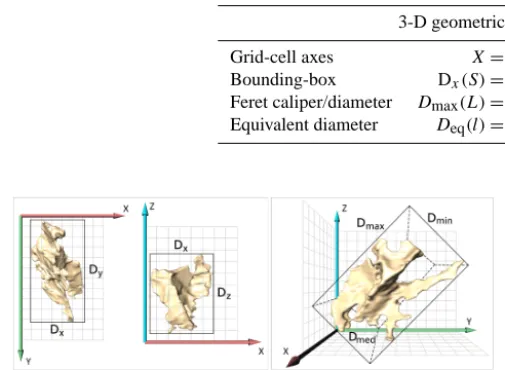
To describe and quantify a particle form (in this case, pores) in three dimensions, morphological parameters such as length, width, and thickness are required. These 3-D pa-rameters must be perpendicular to each other but do not need to intersect at a common point (Blott and Pye, 2008). To per-form the pore shape classification approach that is proposed and described in this work, we conventionally assigned the following practice for the geometrical descriptor of individ-ual particles:(L) is the longest pore dimension, (l) is the longest pore dimension that is perpendicular toL, and(S)is the smaller pore dimension and perpendicular to bothLand l. In practice, two methods were applied to measureL,l, and S from the 3-D irregular shaped objects, such as the pores that were found in the analyzed sedimentary rocks: (i) the bounding-box (BB) and (ii) the Feret caliper (FC) geome-tries.
In bounding-box analysis, the object coordination system follows the same as what is acquired for the 3-D sample vol-ume, namely,L,l, andS; the large, medium, and small sizes from the boxing-based volume have axes ofX,Y, andZ. In Feret caliper analysis, a maximum length (L) and a minimum width (S) caliper diameter that belong to the same plane are initially determined from all the object orientations, while l is the maximal diameter 90◦ from the width. Hence, the
Feret dimension of a 3-D particle is defined as the normal distance between two parallel tangent planes that touch the particle’s surface. Because this value depends on the parti-cle’s orientation, a measurement for one single particle has little significance; therefore, measurements in 31 directions were taken from the image analysis software to determine the particle length (maximum length of Feret distribution) and width (minimum width of Feret distribution). Figure 1 shows the differences in the geometrical parametersL,land Mfor bounding-box (a) and Feret caliper (b) methods, which are drawn in a three-dimensional pore particle. The shown particle was detached from the main pore network of rock S1(2503voxels) after applying the “Bin3” marker extent in the watershed algorithm and choosing the third highest 3-D length from the 25 highest 3-D volume particles. Table 1 de-picts the values (in micrometers) of the grid-cell axes and 3-D geometrical parameters of the analyzed pore particle. The Feret caliper led to a value ofLthat is approximately 10 % higher than what is measured from the bounding-box calculation.
Table 1. 3-D geometrical parameters of the detached particle from the main pore network of rock S1in the 2503voxel volume, as shown in Fig. 1.
3-D geometrical parameters (µm)
Grid-cell axes X=200 Y =300 Z=250
Bounding-box Dx(S)=170 Dy(L)=295 Dz(l)=212 Feret caliper/diameter Dmax(L)=326 Dmin(S)=169 Dmed(l)=318 Equivalent diameter Deq(l)=117
Figure 1. 3-D geometrical descriptors for the bounding-box (a) and Feret caliper (b) methods withL,l, andMcorresponding toDy, Dz, andDx(a) andDmax,Dmed, andDmin(b).
This feature is the equivalent diameter (EqD), which gives the analyzed object a corresponding spherical diameter size with equal voxel volume. Although this parameter is fre-quently used in the literature for 3-D pore structural descrip-tion (Cnudde et al., 2011; Van Dalen and Koster, 2012), the error in the particles’ thickness determination can be consid-erably high depending on the object’s shape, especially for very irregular ones. In this study, the pore shapes were clas-sified by considering the equivalent diameter as the thickness (l) descriptor in the Feret caliper analysis; the mismatches that were found in the results are discussed.
1.2 Theoretical background for pore shape classification and quantification
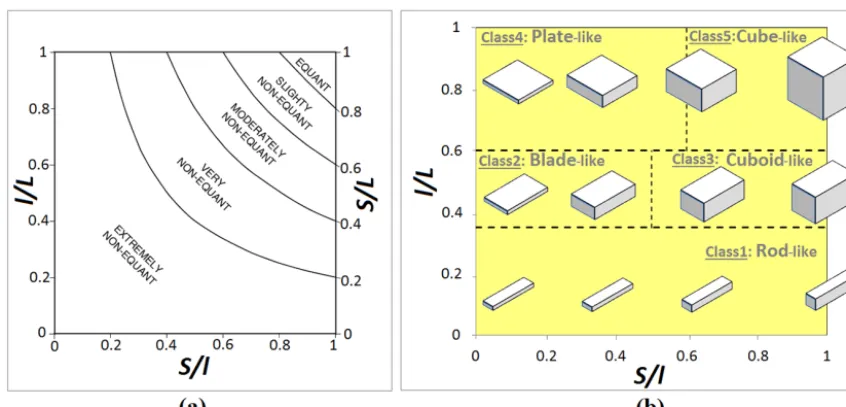
The relationship between the thickness and the length of a particle(l/L) has long been used to indicate its elongation (Lüttig, 1956), while the true flatness is best described by its width divided by thickness (S/ l). Regardless, the degree of sphericity or roundness, “equancy”, has been used to de-scribe equidimensional particles; Krumbein (1941) dede-scribed equant forms as being spherical, withL=l=S. According to Blott and Pye (2008), a particle form can be qualitatively described in terms of its deviation from equancy; specifically, the equancy degree is defined by the combination of flatness and elongation. Figure 2a depicts five classes of equancy that are defined at 0.2 intervals for a qualitative classification of particle equancy plotted on a Zingg diagram (Blott and Pye, 2008).
The methodology that is used in the present work to quan-tify sandstones’ pore shapes is based on the espoused pore
shape classification in Fig. 2b. This classification follows the original approach of Zingg’s (1935) diagram, which was deeply discussed by Blott and Pye (2008) and applied re-cently by Soete et al. (2015) while studying travertines. As one can see in Fig. 2b, cubes are particles with compara-ble L, l, and S; rods are objects that are characterized by a much largerL and by the smallestS, which is similar to the thickness (l); and plates have equivalentL andS and, conversely, much smallerl. Blott and Pye (2008) discussed a classification by Sneed and Folk (1958), but the former authors consider that the original terminology that was pro-posed by Zingg (1935) is more appropriate for use in most natural sedimentary environments, providing a more even distribution of the form continuum. The so-called Zingg dia-gram was applied in the field of mineralogy to classify rocks by their shape. In mineralogy, two measurements differ if the ratio of the smaller one over the bigger one is larger than 0.6. However, the diagram thresholds may vary based on the application of distinct research fields because the tech-nical cleanliness typically considers particles fibrous if their aspect ratio is 0.1 (Vecchio et al., 2011). Similar to Soete et al. (2015), who analyzed travertine rocks, we used the diagram in Fig. 2b to classify and validate pore shapes in sandstone samples by considering artificial objects as having shapes. Thus, when applying the proposed pore shape clas-sification, individual pores are denominated according to the respective class numbers: class 1 (rod-like), class 2 (blade-like), class 3 (cuboid-(blade-like), class 4 (plate-(blade-like), and class 5 (cube-like). By using an identical 3-D subsample of volumes and images that were acquired roughly in the same resolu-tion, the geometrical pore descriptors and shapes of three sandstone fields were systematically studied and quantified as follows.
2 Methodology
288 Mayka Schmitt et al.: Classification and quantification of pore shapes in sandstone reservoir rocks
Figure 2. Pore shape classification for equancy based on theS/Lratio (a); classes of pore-shape-like artificial objects (b) plotted on a Zingg diagram (modified from Blott and Pye, 2008; Soete et al., 2015).
the x-ray µ-CT parameters that were used in the analyses is provided as follows.
2.1 Sandstone samples
Three different sandstones from German reservoir fields were investigated:
– Bentheimer sandstone (S1), Lower Cretaceous (Valangin);
– Obernkirchen sandstone (S2), middle Cretaceous (Wealden); and
– Flechtingen sandstone (S3), middle Permian (Rotliegend).
The Bentheimer sandstone is part of the lower Valanginium sequence, which is associated with the Lower Cretaceous (approximately 140–134 million years old) and it is comparable to the well-known Berea and Fontainebleau sandstone. This sandstone was segmented into three lithostratigraphical units according to Kem-per (1968): lower Bentheimer sandstone, intermediate Romberger, and upper Bentheimer sandstone (also known as flasered sandstone). This rock has been petrographically classified as quartz sandstone with low clay and silt content (< 8 vol%). The grain size varies between very fine and coarse, although fine grains are predominant. In general, the components are well rounded and well sorted, excluding partial content of stable and unstable heavy minerals and feldspars. Stadtler (1998) provided a comprehensive and more detailed description of the S1-type sandstone.
The Obernkirchen sandstone is part of the upper Berria-sium (also known as the Wealden sequence, approximately
145–150 million years old), which is associated with the Lower Cretaceous and forms the lower transition to the Juras-sic. In principle, this rock is comparable to the S1rock type, despite containing better sorted grains and a higher degree of clay cementation. According to Hafner (1987), this sand-stone is characterized by a homogeneous and fine-grained matrix structure, which is sometimes interrupted by thin clayey layers. Additionally, feldspar minerals indicate strong mechanical influences, which results in a higher degree of degradation than for the S1sandstone. The pore space is filled with different types of cementation, mostly carbonate and clay minerals (Börner et al., 2011).
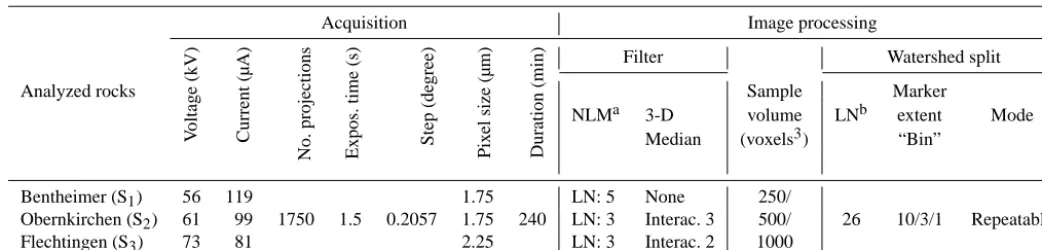
Table 2. 3-D x-ray µ-CT data acquisition and processing parameters for the analyzed rocks.
Acquisition Image processing
V oltage (kV) Current (µA) No. projections Expos. time (s) Step (de gree) Pix el size (µm) Duration (min)
Filter Watershed split
Analyzed rocks Sample Marker
NLMa 3-D volume LNb extent Mode
Median (voxels3) “Bin”
Bentheimer (S1) 56 119 1.75 LN: 5 None 250/
Obernkirchen (S2) 61 99 1750 1.5 0.2057 1.75 240 LN: 3 Interac. 3 500/ 26 10/3/1 Repeatable
Flechtingen (S3) 73 81 2.25 LN: 3 Interac. 2 1000
aNLM: non-local means,bLN: local neighborhood.
In summary, these different sandstones feature a broad range of pore structures because of their distinct diagenesis and tectonic history. Hence, we should be able to detect dif-ferences for the systematic and individual analysis of pore shapes in these three reservoir rocks by using the proposed methodological/statistical approach.
2.2 3-D x-ray µ-CT data acquisition and processing The x-ray µ-CT analyses were conducted at the Leib-niz Institute for Applied Geophysics (Germany) by using a nanotom 180 S instrument (tube characteristics: 180 kV, 500 µA), which was manufactured by GE Sensing & Inspec-tion Technologies (product line of Phoenix X-ray, Wunstorf, Germany). The system is computer-controlled, and cylindri-cal samples with a diameter of 2–4 mm were fixed in the 360-degree rotator holder. The parameters that were used for the µ-CT data acquisition and image post-processing are shown in Table 2. The samples have roughly the same resolu-tion, which was intentionally imposed to allow a comparative study among the analyzed sandstones. Image reconstruction was performed on a GPU(graphics processing unit)-based cluster (fourfold NVidia Tesla GPU), and no additional fil-ters were applied during this stage.
The 3-D reconstructed volume was post-filtered, followed by a pore segmentation and separation process that was per-formed with the Avizo Fire 8.1.0 software (Avizo, 2014), which allowed for data visualization and quantification. As shown in Table 2, specific filters were evaluated for each an-alyzed rock to improve pore noise reduction or the gain of the pore matrix/clay border contrast. The non-local means filter (Buades et al., 2005) showed the best results, although the additional median 3-D filter (Ohser and Schladitz, 2009) was applied to samples S2and S3to enhance the pore segmenta-tion removing image noise without blurring pore edges. Dur-ing the pore segmentation stage, each voxel was assigned to the object of interest (pore) based on a mixture of 2-D scan-ning electron microscopy (SEM) image registration and an automatized threshold shift of grayscale intensities by using the Otsu algorithm (Otsu, 1979). For each of the three rocks,
3-D volumes with dimensions of 10003, 5003, and 2503 vox-els were cropped from the original 3-D data set. Segmented pore networks were extracted from these subsamples and prepared for further quantification. During this process, dis-tinctively small and very small disconnected pore networks exist even before any pore detachment workflow is applied, in addition to the main pore networks. Hence, we define these residual pore networks as pore ganglia.
3 Results and discussion
3.1 Identifying pore networks and residual pore ganglia from the 3-D pore structures
290 Mayka Schmitt et al.: Classification and quantification of pore shapes in sandstone reservoir rocks
Figure 3. 10003voxel renderings of the analyzed sandstones: grayscale image (a), five biggest (by volume) main pore networks (b), and residual pore ganglia that were excluded from the shape analyses (c). In (b) and (c), the labeled images show distinct colors for dissimilar pores.
applied to determine pore ganglia:
Nv= Vp
R3 v
≤2000, (1)
whereVp andRv are in µm3and µm. This choice is based on the thickness of the individual pores from the 3-D data volumes before any pore detachment process is applied. As shown in Fig. 6a, the distinct descriptors (bounding-box, Feret caliper, and equivalent diameter) that were used to cal-culate the pore thickness of the analyzed rocks indicated that most of the smaller pores had sizes below 30 µm. Addition-ally, if one considers a defined pore cluster of voxels that was replaced by its digital analogues as being a sphere (NVeq), then its equivalent size(Deq)is given as
Deq= 3
r
6.NVeq
π . (2)
So, ifNVeqequals 2000 voxels, thenDeqis approximately 16. This value, when multiplied by voxel resolutions of 1.75 and 2.25 µm, is equal to 27.3 µm (for samples S1 and S2) and 35.2 µm (for S3), respectively, which matches perfectly
Figure 4. 3-D and 2-D visualizations after the watershed algorithm is applied to the 2503voxel volume of S1(a), S2(b), and S3(c), with the labeled images showing distinct colors for dissimilar pores.
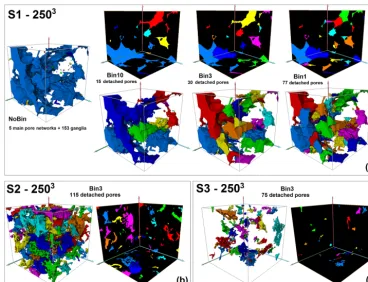
3.2 Detachment of main pore networks by preserving pore morphology
The pore shape classification involves counting and measur-ing the 3-D geometrical descriptors (L,l, andS) of individ-ual pores directly from the original segmented images. When quantifying a 3-D data set, authors frequently associate the segmented pore throats/bodies with an equivalent volume, usually cylinders/spheres, to perform a quantitative charac-terization of the porous media. However, the original pore morphology can be achieved by preserving the segmented pore phase and applying, e.g., a watershed algorithm (Ohser and Schladitz, 2009). The principle of the watershed algo-rithm is to compute watershed splitting lines on a segmented 3-D image that will detect surfaces and separate agglomer-ated particles, which are subtracted from the initial image. When running a watershed algorithm, the most meaning-ful parameter is the “depth of valley” or “marker extent” as named in the Avizo Fire software, called “Bin” herein. In short, the smaller the chosen Bin is (lower levels of flood-ing), the more separated the main pore networks will be, and smaller individual pores will be generated and identi-fied. Thus, without the Bin command, the 3-D pore space rendering comprises one or several connected main pore net-works plus a high number of pore ganglia. Figure 4 shows the 3-D renderings and 2-D projections for 2503voxel data, with individual pores represented by distinct colors. To
in-vestigate the algorithm effect on the residual connected pore networks, the smallest pore ganglia have been intentionally removed; also, the weight graduation 10, 3, and 1 in the Bin command were arbitrarily chosen.
292 Mayka Schmitt et al.: Classification and quantification of pore shapes in sandstone reservoir rocks
Figure 5. Quantification of the pore network fragmentation by using the Euler number (a) and number of segmented pores (b) during the binning operations for the three rocks and three different domain sizes, respectively.
discussed based on distinct Bins. For the analyzed rocks, the “NoBin” 3-D renderings comprise few main pore networks and mostly pore ganglia. As soon as the detachment process is performed (Bin 10, 3, and 1), the pore ganglia that are suppressed from the 3-D volumes allow the emphasis of the main pore system morphology in the shape analysis.
3.3 Evaluating 3-D geometrical descriptors based on the pore thickness distributions
One of the most important steps to be established while per-forming pore shape analysis is the measurement of the 3-D geometrical descriptorsL, l, andS from the segmented 3-D particle. In this procedure, a truthful quantification of indi-vidual pores in the original 3-D pore system morphologies should be provided. As mentioned previously, the bounding-box, Feret caliper, and equivalent diameter methods were used in this work. To calculate the pore ganglia and main pore network descriptors, this procedure was performed before applying the watershed algorithm; moreover, the descriptors were measured after each Bin 10, 3, and 1 process to quan-tify the detached pore networks. Figure 6 shows the thickness frequency number distribution in percentages for (a) the pore ganglia (NoBin) and (b) the detached pores (Bin3) for the
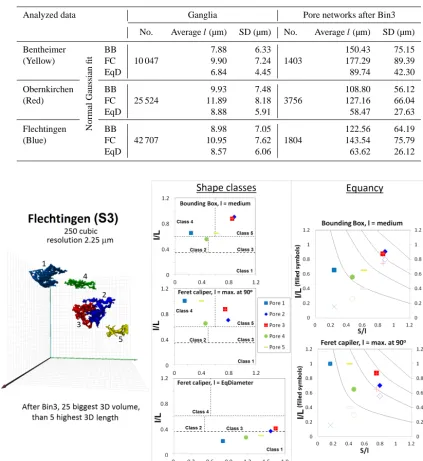
10003voxel volumes of the analyzed sandstones. A volume-weighted size distribution is preferred for many applications (Van Dalen and Koster, 2012). However, only the number-weighted thickness distribution is provided because a direct comparison between the BB, FC, and EqD methods was in-tended. Table 3 shows the statistical results after a normal Gaussian fit to the rocks’ data distributions, demonstrating the differences between the samples and the methods that were used to measure the pore thicknesses.
calcu-Figure 6. Pore thickness (l) distribution of pore ganglia (a) and detached pore networks after Bin3 (b) as measured by the BB, FC, and EqD methods in the 10003voxel volume of S1(yellow), S2(red), and S3(blue).
lated, the particle size is reported as an equivalent spherical diameter, which is determined by the voxel number counting. Furthermore, the small differences that are observed among the BB, FC, and EqD analysis methods are discussed in the pore shape classification approach as follows.
3.4 Classification and quantification of the pore shapes in the analyzed sandstones
294 Mayka Schmitt et al.: Classification and quantification of pore shapes in sandstone reservoir rocks
Figure 7. Pore shape results (S1) for equancy and shape classes based on distinct descriptors for the five categorized pores in a 2503voxel volume. The lines shown in the graphics delimitate distinct particles shapes, as described in Fig. 2.
Table 3. Thickness statistics for the pore ganglia and detached pore networks after a normal Gaussian fit to the distribution data, shown in Fig. 6. SD denotes standard deviation.
Analyzed data Ganglia Pore networks after Bin3
No. Averagel(µm) SD (µm) No. Averagel(µm) SD (µm)
Bentheimer
Normal
Gaussian
fit
BB 7.88 6.33 150.43 75.15
(Yellow) FC 10 047 9.90 7.24 1403 177.29 89.39
EqD 6.84 4.45 89.74 42.30
Obernkirchen BB 9.93 7.48 108.80 56.12
(Red) FC 25 524 11.89 8.18 3756 127.16 66.04
EqD 8.88 5.91 58.47 27.63
Flechtingen BB 8.98 7.05 122.56 64.19
(Blue) FC 42 707 10.95 7.62 1804 143.54 75.79
EqD 8.57 6.06 63.62 26.12
Figure 9. Pore shape results (S3) of equancy and shape classes based on distinct descriptors for the five categorized pores in a 2503voxel volume. The lines shown in the graphics delimitate distinct particles shapes, as described in Fig. 2.
and subsequent quantification based on artificial object simi-larity.
3.4.1 Approach validation based on the 3-D visualization and geometrical descriptors
Figures 7, 8, and 9 depict 2503voxel volumes of rocks S1, S2, and S3, which show the results for five representative pores. These 3-D rendered pores were the five longest (by L), la-beled from the 25 largest (by volume), and acquired after
296 Mayka Schmitt et al.: Classification and quantification of pore shapes in sandstone reservoir rocks this result within the 0.2 intervals of the equancy graph was
impossible; therefore, the EqD descriptor is only discussed for the shape class diagram. Nevertheless, the equancy for the BB and FC descriptors was used to support the results of the shape class approach.
By comparing the 3-D renderings in Figs. 7, 8, and 9, sam-ple S1 shows the largest pore volumes, followed by the S2 and S3samples. Additionally, none of the five pores in S1are located in the “extremely non-equant” interval in the equancy graph for both the BB and FC descriptors, while at least three pores (no. 1, 4, and 5) in S3fell within this interval, indicating higher particle asymmetry for this rock. Although only qual-itative evaluation can be drawn from the equancy diagrams (some particles fall within distinct intervals), the pores do deviate from being equant (regular shape) descending from S1to S2to S3. These results support good agreement with the proposed shape class approach for the three rocks when both the BB and FC descriptors were used.
However, when the bounding-box, Feret caliper, and equivalent diameter descriptors were investigated in the Zingg diagram for the pore shape classification and quan-tification, the results for the three rocks seemed to be more appropriate for the FC descriptor (compare e.g., pore 3 in Fig. 7). For this pore, the bounding-box descriptor indi-cates a cube-like shape; however, as shown in Fig. 1a, this cube shape is notably erroneous. Our assumption for the bounding-box mismatch is related to the main orientation of pore 3, which is neither perpendicular nor parallel to the sam-plezaxis but is approximately within 45◦. In this case, the L,l, andSdescriptors were inaccurately measured by the BB method, which will tend to overestimate the shapes as cube-like. The same behavior is observed for particles 4 and 5 in Fig. 8 and 2 and 3 in Fig. 9. Thus, the Feret caliper descriptor will be more adequate for materials that contain a reasonable number of pores with preferential directions, which match neither the normal nor parallel sampleZaxis direction, pro-viding enhanced pore morphological information over the bounding-box method. On the other hand, the givenS/ l ra-tio is unrealistically high when evaluating pore shapes with the equivalent diameter descriptor (l), which proves that this descriptor must be handled with caution when characteriz-ing very asymmetrical pore structures, such as those found in natural materials. Nevertheless, this parameter might be used to indicate the degree of particle asymmetry, as discussed in the following section.
3.4.2 Quantifying shapes of pore ganglia and detached pore networks
Selecting a region of interest (ROI) from the sample is re-quired prior to any pore shape quantification or morpholog-ical analysis from a reconstructed 3-D image. To correlate many properties (e.g., porosity), the chosen ROI should be large enough to represent a sample’s complexity and het-erogeneity but small enough not to overwhelm the
avail-able computing resources (Baker et al., 2012). This study’s ROI volumes of 10003, 5003, and 2503voxels are shown in Fig. 10, which notes the changes in the rod-(1), blade-(2), cuboid-(3), plate-(4), and cube-shaped (5) classes of the pore ganglia (NoBin) and detached pore networks after Bin3. In this figure, one can also observe the differences in the shape classes between the BB (blue), FC (red), and equivalent di-ameter (yellow) descriptors. No significant variations were observed from the 10003to 2503volumes for each of the de-scriptor methods. For the pore ganglia’s shape classes (dark colors), the changes were even less pronounced because of their much smaller size compared to the smallest ROI that was analyzed. For the three ROIs, most of the pore ganglia were shown to be cube-like, followed by plate-like (BB and FC methods) or cuboid-like forms (EqD method). Neverthe-less, a slightly variation in the ROI size was observed for the detached pore networks’ shape classes (bright colors) in S1and S2when the Feret caliper descriptor (bright red) was used. For these two rocks, the detached pores were predom-inantly plate-like in the 2503 ROI, approximately equally plate- and cube-like in the 5003ROI, and mainly cube-like in the 10003ROI. This change, which is notable for rocks with bigger pore structures, indicates that the pore shape quantifi-cation results might be snagged by excessively small sam-ple sizes. Nevertheless, the systematic comparison of the an-alyzed ROIs, which is shown in Fig. 10, indicates reason-able reproducibility from the 10003to 2503 voxel volumes when performing pore shape analysis. Only the 10003ROI is shown (Fig. 11) for the quantification and discussion of pore ganglia and detached pore network shapes.
Figure 10. Effect of subsample volume size on the (1) rod-, (2) blade-, (3) cuboid-, (4) plate-, and (5) cube-shaped classes of the pore ganglia (NoBin) and the detached pore networks (Bin3).
pore shape analysis. The errors increase with the pore mor-phology’s asymmetry and divergence from equancy. Still, an interesting indication can be drawn from the EqD descriptor results for detached pore networks after Bin3: the rod-like shapes that were identified for the three sandstones, in addi-tion to pore lengths (L) that were at least 3 times larger than the measured equivalent thickness (l), hadlvalues that were around the same or 2 times smaller than the width (S). These extremely asymmetrical pore shape configurations can be vi-sualized in the 3-D renderings in Figs. 7, 8, and 9, specifi-cally, particles 1 (S1), 3 (S2), and 3 (S3), which are the high-estS/ lvalues. Thus, one could use the pore equivalent diam-eter in shape analysis to indicate the degree of pore hdiam-etero- hetero-geneity/asymmetry based on rod-like shapes, which is equal to 6.70, 18.58, and 25.44 % for samples S1, S2, and S3.
As discussed in the literature (Anovitz and Cole, 2015; Chang et al., 2006; Okazaki et al., 2014), a number of pore form factors have been used to quantify pore shapes that might be correlated to the macroscopic properties of sed-imentary rocks. Among these factors, flatness, elongation, and roundness are commonly used. Permeability, from a ge-ological point of view, is still one of the most challeng-ing properties to determine but is nonetheless a very im-portant hydraulic property in solving accumulation and ex-ploitation problems in the oil and gas industry. The perme-ability, k, depends on the parameters of the pore structure, including the porosity, Euler number (connectivity), and
298 Mayka Schmitt et al.: Classification and quantification of pore shapes in sandstone reservoir rocks
Figure 11. Pore shape quantification of samples S1, S2, and S3(10003voxels) for the BB, FC, and EqD descriptors based on the proposed Zingg classification approach.
Thus, correlating the quantification results of pore shapes (observe mainly Bin3 and Feret caliper results in Fig. 11) of the analyzed sandstones, and considering that a cube-like shape imposes less fluid flux resistance compared to, e.g., a plate-like shape, one could assume that S1, which has the highest number of cube-like pores (58.80 %), is more permeable than S2 (55.62 %) and S3 (45.18 %). Addition-ally, plate-like shapes are more common in S3 (50.94 %) compared to S2 (42.01 %) and S1 (39.49 %). These find-ings match very well with the rocks’ geological descriptions, ages, and Klinkenberg permeability measured in the labora-tory; in particular, S3, comprised mainly of plate-like pore shapes, showed a permeability value 2 orders lower than S1 and S2, and it is much older as well, thus more subject to grain compaction/deformation. The laboratorial results can confirm that the pore shape quantification approach obtained from the Feret caliper and Bin3 parameters faithfully rep-resent the pore structure morphology of the analyzed sand-stones. The organization of the pore system in these rocks is directly correlated to fundamental geological processes and evolution, which control underground hydraulic properties.
4 Conclusions and outlook
Three distinct reservoir rocks were systematically analyzed to characterize 3-D pore shapes based on x-ray µ-CT images. A modified Zingg diagram that associates particle shapes with similar artificial objects was created to validate dis-tinct bounding-box, Feret caliper, and equivalent diameter descriptors. A detailed procedure was developed and de-scribed in this paper to quantify and draw faithful pore shape information concerning the real pore system. An important finding from the pore shape analysis was that the 3-D rock samples comprise main pore networks and several discon-nected pore ganglia; the latter were suppressed from the pore volume samples to analyze the shape sensitivity of detached pore networks. The Euler number of these pore networks can be used to obtain a good quantification of the changes during the performed binning operations.
being plate- and cube-like, equal to 39.49 and 58.80 % for S1, 42.01 and 55.62 % for S2, and 50.94 and 45.18 % for S3, respectively. Plate-like pores were evidently higher for the Flechtingen sandstone (S3), which could be explained by the geological processes and history of this field compared to those of the S1and S2samples.
The pore thickness that was calculated using the equivalent diameter led to erroneous results in the Zingg shape classifi-cation for the three analyzed sandstones, which contain very asymmetric pore morphologies. However, the EqD descrip-tor might be used to indicate the degree of pore heterogene-ity based on rod-like shapes, which were found to be equal to 6.70, 18.58, and 25.44 % for samples S1, S2, and S3, re-spectively. Additionally, the equivalent diameter was a faith-ful parameter for many investigations, e.g., obtaining pore size distributions from distinct techniques such as mercury intrusion capillary pressure when assuming capillary phe-nomena in parallel cylinders. Because of the growing world-wide interest in flow simulation in very complex pore struc-tures, such as unconventional reservoirs, many techniques have been improved by allowing models to enter a pore shape parameter, e.g., in the gas adsorption method. In this context, the 3-D pore shape quantification that was described in this paper is essential for several studies from distinct research ar-eas. This study is part of ongoing research to investigate the influence and impact of different pore shapes on the petro-physical properties of reservoir rocks, such as permeability, surface area, fractal dimension of the surface area, and com-plex electrical properties. Moreover, this research project will be extended to other types of reservoir rocks, e.g., carbonates and unconventional reservoir rocks from Brazilian fields, in the near future.
Acknowledgements. We would like to thank CNPq – Conselho Nacional de Desenvolvimento Científico e Tecnológico, of the Ministry of Science, Technology, and Innovation of Brazil for granting the research stipend no. 207204/2014-4. The authors would also like to thank the reviewers for their help in improving the quality of this paper.
Edited by: S. Henkel
References
Andrew, M., Bijeljic, B., and Blunt, M.J.: Reservoir-Condition Pore-Scale Imaging of Supercritical Carbon Dioxide, SPE, 1–9, 2013.
Anovitz, L. M. and Cole, D.R.: Characterization and analysis of porosity and pore structures, Rev. Mineral. Geochem., 80, 61– 164, 2015.
Avizo Fire 8.1.0: 1995–2014©, FEI, SAS – Visualization Sciences Group, Hillsboro, USA, www.fei.com (last access: 30 November 2015), 2014.
Bagheri, G. H., Bonadonna, C., Manzella, I., and Vonlanthen, P.T.: On the characterization of size and shape of irregular particles, Powder Technol., 270, 141–153, 2015.
Baker, D. R., Mancini, L., Polacci, M., Higgins, M. D., Gualda, G. A. R., Hill, R. J., and Rivers, M. L.: An introduc-tion to the applicaintroduc-tion of X-ray microtomography to the three-dimensional study of igneous rocks, Lithps, 148, 262–276, 2012. Bärle, C.: Porenraumuntersuchungen ausgewählter rotliegend Sandsteinproben Norddeutschlands unter besonderer Berück-sichtigung der Porengeometrie, PhD thesis, Universität Würzburg, Würzburg, 1996.
Beckingham, L. E., Peters, C. A., Umb, W., Jones, K. W., and Lindquist, W. B.: 2D and 3D imaging resolution trade-offs in quantifying pore throats for prediction of permeability, Adv. Wa-ter Resour., 62, 1–12, 2013.
Blott, S. J. and Pye, K.: Particle shape: a review and new methods of characterization and classification, Sedimentology, 55, 31–63, 2008.
Börner, A., Bornhöft, E., Häfner, F., Hug-Diegel, N., Kleeberg, K., Mandl, J., Nestler, A., Poschold, K., Röhling, S., Rosenberg, F., Schäfer, I., Stedingk, K., Thum, H., Werner, W., and Wet-zel, E.: Steine und Erden in der Bundesrepublik Deutschland, Vol. 1, Schriftenreihe der Bundesanstalt für Geowissenschaften und Rohstoffe (BGR) in Zusammenarbeit mit den Staatlichen Geologischen Diensten der Bundesländer, Hannover, 2011. Buades, A., Coll, B., and Morel, J. M.: A review of image denoising
methods, with a new one, Multiscale Modeling and Simulations, 4, 490–530, 2005.
Buller, A. T., Berg, E., Hjelmeland, O., Kleppe, L., Torsaeter, O., and Aasen, J. O.: North Sea Oil and Gas Reservoirs – II, Graham and Trotman, London, 234–237, 1990.
Chang, C., Zoback, M. D., and Khaksar, A.: Empirical relations be-tween rock strength and physical properties in sedimentary rocks, J. Petrol. Sci. Eng., 51, 223–237, 2006.
Cnudde, V., Boone, M., Dewanckele, J., Dierick, M., Van Hoore-beke, L., and Jacobs, P.: 3D characterization of sandstones by means of X-ray computed tomography, Geosphere, 7, 1–8, 2011. Dong, H. and Blunt, M. J.: Pore-network extraction from micro-computerized-tomography images, Phys. Rev. E, 80, 1–11, 2009. Eiríksson, J., Sigurgeirsson, M., and Hoelstad, T.: Image analy-sis and morphometry of hydromagmatic and magmatic tephra grains, Reykjanes volcanic system, Iceland, Jokull, 44, 41–65, 1994.
Hafner, W.: Obernkirchener Sandstein, Steinmetz und Bildhauer, 5, 29–33, 1987.
Halisch, M.: Application and Assessment of the Lattice Boltzmann Method for Fluid Flow Modeling in Porous Rocks, Technis-che Universität Berlin, 49-69, urn:nbn:de:kobv:83-opus-39381, 2013.
Kemper, E.: Einige Bemerkungen über die Sedimentationsverhält-nisse und die fossilen Lebensspuren des Bentheimer Sandsteins (Valanginium), Geologisches Jahrbuch Bd. 86, Schweizerbart Science Publishers, Hannover, 49–106, 1968.
Ketcham, R. A.: Computational methods for quantitative analysis of three-dimensional features in geological specimens, Geosphere, 1, 32–41, 2005.
300 Mayka Schmitt et al.: Classification and quantification of pore shapes in sandstone reservoir rocks
Krumbein, W. C.: Measurement and geological significance of shape and roundness of sedimentary particles, J. Sediment. Petrol., 11, 64–72, 1941.
Little, L., Becker, M., Wiese, J., and Mainza, A. N.: Auto-SEM particle shape characterization: investigat-ing fine grindinvestigat-ing of UG2 ore, Miner. Eng., 82, 92–100, doi:10.1016/j.mineng.2015.03.021, 2015.
Lüttig, G.: Eine neue, einfache geröllmorphometrische Methode, Eiszeitalter und Gegenwart, 7, 13–20, 1956.
McGrath, T. D. H., O’Connor, L., and Eksteen, J. J.: A comparison of 2D and 3D shape characterisations of free gold particles in gravity and flash flotation concentrates, Miner. Eng., 82, 45–53, doi:10.1016/j.mineng.2015.04.022, 2015.
Ohser, J. and Schladitz, K.: 3D Images of Material Structures – Pro-cessing and Analysis, Wiley-VCH Publishing, Weinheim, Ger-many, 325 pp., 2009.
Okazaki, K., Noda, H., Uehara, S., and Shimamoto, T.: Permeabil-ity, porosity and pore geometry evolution during compaction of Neogene sedimentary rocks, J. Struct. Geol., 62, 1–12, 2014. Otsu, N.: A threshold selection method from gray-level histograms,
IEEE T. Syst. Man Cyb., 9, 62–66, 1979.
Paech, H. P., Kampe, A., and Weyer, D.: Stratigraphie von Deutsch-land – Unterkarbon (Mississippium), No. 6, Deutsche Union der Geowissenschaften, Deutsche Stratigraphische Kommission, Hannover, 2006.
Petrak, D., Dietrich, S., Eckardt, G., and Köhler, M.: Two-dimensional particle shape analysis from chord measurements to increase accuracy of particle shape determination, Power Tech-nol., 284, 25–31, 2015.
Renard, P. and Allard, D.: Connectivity metrics for subsur-face flow and transport, Adv. Water Resour., 51, 168–196, doi:10.1016/j.advwatres.2011.12.001, 2011.
Riley, C. M., Rose, W. I., and Bluth, G. J. S.: Quantitative shape measurements of distal volcanic ash, J. Geophys. Res., 108, 2504, doi:10.1029/2001JB000818, 2003.
Robin, P.-Y. F. and Charles, C. R J.: Quantifying the three-dimensional shapes of spheroidal objects in rocks imaged by to-mography, J. Struct. Geol., 77, 1–10, 2015.
Saraji, S. and Piri, M.: The representative sample size in shale oil rocks and nano-scale characterization of transport properties, Int. J. Coal Geol., 146, 42–54, 2015.
Scheidegger, A. E.: The physics of flow through porous media, Uni-versity of Toronto Press, Toronto, Canada, 353 pp., 1974. Shea, T., Houghton, B. F., Gurioli, L., Cashman, K. V.,
Ham-mer, J. E., and Hobden, B. J.: Textural studies of vesicles in vol-canic rocks: an integrated methodology, J. Volcanol. Geoth. Res., 190, 271–289, 2010.
Sneed, E. D. and Folk, R. L.: Pebbles in the Lower Colorado River, Texas: a study in particle morphogenesis, J. Geol., 66, 114–150, 1958.
Soete, J., Kleipool, L. M., Claes, H., Claes, S., Hamaekers, H., Kele, S., Özkul, M., Foubert, A., Reijmer, J. J. G., and Swen-nen, R.: Acoustic properties in travertines and their relation to porosity and pore types, Mar. Petrol. Geol., 59, 320–335, 2015. Stadtler, A.: Der Bentheimer Sandstein (Valangin,
NW-Deutschland): eine palökologische und sequenzstratigraphische Analyse, Bochumer Geologische und Geotechnische Schriften-reihe, Nr. 49, Ruhr-Universität Bochum, Bochum, 1998. Tiab, D. and Donaldson, E. C.: Petrophysics: Theory and
Prac-tice of Measuring Reservoir Rock and Fluid Transport Proper-ties, Gulf Professional Publishing, Elsevier, Burlington, USA, 889 pp., 2004.
Van Dalen, G. and Koster, M. W.: 2D and 3D particle size analy-sis of micro-CT images, in: Proceedings, Bruker micro-CT User Meeting 2012, Brussels, 3–5 April 2012, 1–16, 2012.
Vecchio, I., Schladitz, K., Godehardt, M., and Heneka, M. J.: Ge-ometrical characterization of particles in 3D with an applica-tion to technical cleanliness, Fraunhofer-Institut für Techno- und Wirtschaftsmathematik ITWM, Kaiserslautern, Germany, ISSN 1434-9973, 1–33, 2011.
Vogel, H.-J., Weller, U., and Schlüter, S.: Quantification of soil structure based on Minkowski functions, Comput. Geosci., 36, 1236–1245, doi:10.1016/j.cageo.2010.03.007, 2010.
Vonlanthen, P., Rausch, J., Ketcham, R. A., Putlitz, B., Baumgart-ner, L. P., and Grobéty, B.: High-resolution 3D analyses of the shape and internal constituents of small volcanic ash particles: the contribution of SEM micro-computed tomography (SEM micro-CT), J. Volcanol. Geoth. Res., 293, 1–12, 2015.
Walsh, J. B. and Brace, W. F.: The effect of pressure on porosity and the transport properties of rock, J. Geophys. Res., 89, 9425– 9431, 1984.
Wiedenmann, D., Keller, L., Holzer, L., Stojadinovic, J., Münch, B., Suarez, L., Furney, B., Hagendorfer, H., Brünnimann, R., Modregger, P., Gorbar, M., Vogt, U. F., Züttel, A., La Mantia, F., Wepf, R., and Grobety, B: Three-dimensional pore structure and ion conductivity of porous ceramic diaphragms, AiChE Let-ter: Transport Phenomena and Fluid Mechanics, 59, 1446–1457, 2013.
Zhang, Y., Liu, J. J., Zhang, L., De Anda, J. C., and Wang, X. Z.: Particle shape characterization and classifica-tion using automated microscopy and shape descriptors in batch manufacture of particules solids, Particuology, 24, 64–68, doi:10.1016/j.partic.2014.12.012, 2016.