Republic of Vanuatu
Ministry of Education
Annual Statistical Report
2009
Republic of Vanuatu
Ministry of Education
Annual Statistical Report
2009
vii
Abbreviations
DoE Department of Education
ECE Early Childhood Education /Pre-School EFA Education for All
FBEAP Forum Basic Education Action Plan GDP Gross Domestic Product
GER Gross Enrolment Ratio GIR Gross Intake Rate GoV Government of Vanuatu GPI Gender Parity Index JS Junior Secondary
MDA Millennium Development Agenda MDG Millennium Development Goals MoE Ministry of Education
NER Net Enrolment Ratio NIR Net Intake Rate NZ Aid New Zealand Aid
PEO Provincial Education Office PTR Pupil Teacher Ratio
SWAP Sector Wide Approach Program
UNESCO United Nations Educational, Scientific and Cultural Organization VEMIS Vanuatu Education Management Information System
VESAP Vanuatu Education Support Action Plan 2007 – 2009 VESS Vanuatu Education Sector Strategy 2007 – 2016 VITE Vanuatu Institute of Teacher Education
viii
Contents
Message from the Minister of Education ... 9
Foreword by the Director General ... 10
Summary of 2009 education statistics ... 11
Chapter 1: Introduction ... 13
Education in Vanuatu ... 13
Chapter 2: Summary of Education Statistics ... 17
Schools ... 17
Enrolment details ... 18
Chapter 3: Vanuatu Education Sector Strategy ... 27
Vision ... 27
Mission ... 27
Goals ... 27
National Curriculum and Training Program for Early Childhood Education ... 36
Quality and relevance... 40
Student: teacher ratio ... 42
Teacher training, certification and qualifications ... 45
In-service training ... 46
Chapter Four: Provincial Statistics ... 58
Torba province ... 58
Sanma Province ... 59
Malampa Province... 61
Penama Province ... 64
Shefa Province ... 66
vii
List of Tables
Table 1: Survey Return Rates by School Type and Province, 2009 ... 15
Table 2: Number of schools by school type code, 2007 – 2009 ... 17
Table 3: Number of schools by province, 2009 ... 18
Table 4: Number of Schools by Education Authority Type and level of Education, 2009 ... 18
Table 5: Enrolment by survey year and school type, 2007 – 2009 ... 19
Table 6: Total enrolment by school type and Province, 2009 ... 19
Table 7: % students enrolled in urban and rural schools, 2009 ... 20
Table 8: Enrolment by school type and year level, 2009 ... 21
Table 9: Enrolment by age and year level for children aged 5 – 18 years, 2009 ... 22
Table 10: Drop out and repeater rates by Year, 2008 – 2009 ... 24
Table 11: Enrolment by school type and by education authority, 2007 – 2009 ... 25
Table 12: GER Trends by level of education, 2007 – 2009... 28
Table 13: GER and NER by sex with GPI for school levels, 2007-2009 ... 30
Table 14: Participation by school level and specific age (in percentage), 2009 ... 31
Table 15: Number of students enrolled in urban and rural schools, 2009 ... 31
Table 16: Gross and Net Intake Ratio in Year 1, GPI or the ratios, 2007 - 2009 ... 33
Table 17: Number of repeaters, drop outs and promotion rates by sex and year level, 2008 ... 34
Table 18: Number of pupils with a disability, by school level and location, 2007 – 2009 ... 35
Table 19: Type of disability and sex in primary and secondary level, 2009 ... 36
Table 20: Percent of Year 1 students who have come from an ECE program, 2009 ... 36
Table 21: Total enrolment by language of instruction and by school level, 2009 ... 37
Table 22: Enrolment by language of instruction and school level, 2007-2009... 38
Table 23: Basic education textbook:pupil ratio for core subject areas, 2009 ... 39
Table 24: Secondary school (Year 7 +) textbook: pupil ratio for core subject areas, 2009 ... 40
Table 25: Number of teachers in each sector and by sex, 2007-2009 ... 41
Table 26:Student: teacher ratios in ECE centers by province, 2009 ... 42
Table 27: Student:teacher ratio in primary schools* by province, 2009 ... 43
Table 28: Student: Teacher ratio in secondary schools* by province, 2009 ... 43
Table 29: Student: Teacher ratios in urban and rural schools, 2009 ... 43
Table 30 Student: teacher Ratio by Education Authority, 2009 ... 44
Table 31: Distribution of qualified and certified by school level and location, 2009 ... 45
Table 32: Number of teachers by language of instruction and by province, 2009 ... 46
Table 33: Percentage of teachers completing in-service training course, 2007-2009 ... 47
Table 34: Classrooms, enrolments and student: classroom ratio by school level, 2009 ... 47
Table 35: Condition of classrooms in all urban and rural schools, 2007-2009 ... 48
Table 36: Percentage of reading, reference books and libraries by province, 2009 ... 49
Table 37: Reading Book: Student ratio, 2009 ... 50
Table 38: Type of water supply in schools, 2009 ... 51
Table 39: Condition of water supplies, by type, 2009 ... 51
Table 40: Pupil: toilet ratio by type of schools and province, 2009 ... 52
Table 41: Types of toilets in Vanuatu schools, by type of school, 2009 ... 52
Table 42: Government budget allocation for the MoE, 2007 – 2009 ... 54
Table 43: Education budget and recurrent expenditure per students by school level, 2006-2009 ... 54
viii
Table 45: Enrolment by Education authorities and by schools, 2009 ... 56
Table 46: Number of Parents Teacher’s Associations by school type, 2009 ... 56
Table 47: Community support ratings as reported by school principal and head teachers, 2009 ... 57
Table 48: Population Projection by Age and Gender, 2006 - 2010 ... 71
Table 49: Total enrolment by age and school type, 2009 ... 72
List of Graphs
Figure 1:Student enrolment in all levels of education continues to rise ... 11Figure 2: Ministry of Education total expenditure 2007 – 2009 ... 12
Figure 3: % of Actual and estimated schools in VEMIS, 2009 ... 15
Figure 4: % of estimated and actual enrolment in VEMIS, 2009 ... 16
Figure 5: % of estimated and actual Number of Teachers, 2009... 16
Figure 6: Enrolment trend by school level, 2007 – 2009 ... 19
Figure 7: % of enrolment at all levels by province, 2009 ... 20
Figure 8: Proportion of students by age and level of schooling, 2009 ... 21
Figure 9: Repeater rate by school year, 2008 – 2009 ... 23
Figure 10: Dropout rate by school year, 2008 – 2009 ... 23
Figure 11: Proportion of students enrolled under different education authorities at primary level Year 1 – Year 6, 2007 – 2009 ... 26
Figure 12: Proportion of students enrolled under different education authorities at higher secondary level, Year 9-13/14, 2007 – 2009 ... 26
Figure 13: Gross Enrolment Ratio (GER) trend by school level, 2007 – 2009 ... 28
Figure 14: NER and GER for Junior and Senior Secondary school levels, 2007 - 2009 ... 29
Figure 15: GER and NER for the four levels of education, 2009 ... 30
Figure 16: Age participation rate (%) and NER by school level, 2009 ... 31
Figure 17: Percent of enrolment in urban and rural locations, broad level, 2009 ... 32
Figure 18: Gross Enrolment Rate (GER) and Net Enrolment Rate (NER) in year 1 of primary, 2007-2009 ... 33
Figure 19: Number of drop outs and sex, year 1 – year 6, 2006-2008 ... 34
Figure 20: Number of drop outs and sex, Year 7 – Year 14, 2006-2008 ... 35
Figure 21: Percent distribution of primary school (Year 1 – 6) textbooks for main subjects, 2009 ... 39
Figure 22: Percent distribution of secondary school (Year 7 +) textbooks for main subjects, 2009 ... 40
Figure 23: Trends in teacher numbers, 2007-2009 ... 41
Figure 24: Distribution of Teachers in urban and rural schools (%), 2009 ... 42
Figure 25: Percent of classrooms in poor condition in urban and rural schools, 2007-2009 ... 48
Figure 26: Internal efficiency ratio, 2009 ... 53
Annual Statistical Report 2009
Vanuatu Education Management Information System (VEMIS), Policy and Planning Unit Page 9
Message from the Minister of Education
Education is a lifelong process, from the time a child enters the world his or her family are our young’s first teachers. As children grow they enter the formal education system and the Ministry of Education is tasked with ensuring the skills development for a population of some 67,000 between 3 to 20 years of age; or almost 30% of the population of Vanuatu. This is a huge challenge in a country with extremely high costs of service delivery and limited human resources and the continuing efforts of the Ministry of Education to make the best use of its available financial and human resources.
The Government of Vanuatu endorsed in early 2006, the Sector Wide Approach Planning Strategy leading to the development of “Vanuatu Education Sector Strategy (VESS) 2007 – 2016”. The Vanuatu Education Sector Strategy builds on the strengths of previous plans and moves into a new future where Ni-Vanuatu people take full responsibility in managing the development of education in the country.
The Ministry of Education Corporate Plan and the Vanuatu Education Support Action Plan (VESAP) for 2007-2009 was developed as a collective commitment to action, urging the Government to broad-based partnerships with civil society organizations and aid-donors, to provide the VESS the greatest political and fiscal support.
One of the biggest achievements in the VESS priority initiatives was the schools information update for 2007, 2008 and 2009. The Vanuatu Education Management Information System (VEMIS) has allowed education projects and sectoral programs to be implemented while education policy in 2010 moved to focus on the delivery of free primary education for Year 1 to 6. The VEMIS is being managed and coordinated by the Planning Unit through the VEMIS Taskforce named VMAC. The program has been jointly financed by the New-Zealand Government (NZAid) and the Vanuatu Government.
The 2009 schools information in VEMIS provides detailed information about schools throughout Vanuatu and is the baseline for monitoring and evaluating VESS progress over the next ten years. This report will be of great use to the Ministry of Education and especially to the decision-makers, policy makers, and researchers within government, the private sector and civil society. This report will be of great use for monitoring and evaluation of education development initiatives as progress towards achieving universal primary education in the Millennium Development Goals (MDGs), the UNESCO Education for All (EFA) initiative and Forum Basic Education Action Plan (FBEAP).
Therefore, I hereby publish this report recognizing that it is integral to progressing achievements in VESS; strongly believing that the key findings in this report are “everyone’s business” and that we all need to continue to cooperate in our efforts to improve education in Vanuatu.
Annual Statistical Report 2009
Vanuatu Education Management Information System (VEMIS), Policy and Planning Unit Page 10
Foreword by the Director General
The Vanuatu Education Sector Strategy (VESS) 2007 – 2016 is underpinned by evidence based policy implementation, monitoring and evaluation. Statistical information is central to the operations of the MoE. MoE staff undertook a comprehensive analysis of existing data and reports about the Vanuatu education system from early childhood to secondary school. VESS states that the education sector must aim at:
Alleviating poverty through achieving universal primary education for all young people and equipping them with the essential skills to fully participate in society and enjoy the benefits.
Developing the human resources of the nation to enable young Ni-Vanuatu to build sustainable self-reliant futures and to participate in the productive sectors in both rural and urban settings.
Supporting and teaching history, culture and traditional knowledge.
Opening up the door to the knowledge, new technologies, and opportunities of the world.
These are some principles that have contributed to the implementation of the key strategies of VESS and of the establishment and strengthening of the Vanuatu Education Management Information System (VEMIS) which is a main component of VESS. This has involved:
• Rationalization of data collection systems and templates
• More efficient data entry, analysis and reporting systems
• Completion of the annual school census to establish baseline and annual updates of the statistical indicators used to monitor the implementation of VESAP Activities.
• Adapting VEMIS to meet information needs across the education sector and to link with an expanded school-based system
• Strengthening the skill levels of VEMIS staff at MoE and PEO levels
• Networking all PEOs so that they all actively contribute to VEMIS
• Working with other GoV agencies to improve education statistics
• Integrate the MDGs and EFA/MDA indicators into regular reports
• Taking a considered and thorough approach to the mid-term review of Education for All in 2009 This Annual Statistical Report will be an essential tool to assess the progress towards achieving the milestones in VESS. We at the MoE strongly believe that this report will be the basis of future planning and decision making for the provision of education development, strong in our faith that VESS, EFA MDG and FBEAP Goals will be met by 2015.
The MoE would like to thank all the Schools that have submitted their school survey forms in 2009, the information that has been provided is important for the further growth and development of the education system.
Jesse DIck Director General
Annual Statistical Report 2009
Vanuatu Education Management Information System (VEMIS), Policy and Planning Unit Page 11 63,366
67,006
67,631
2007 2008 2009
Summary of 2009 education statistics
Enrollment continues to increase
Student enrolment in all levels of education in Vanuatu continued to increase in 2009, with a total of 67,631 girls and boys and young women and men enrolled from Early Child Education (ECE) to senior secondary level. In 2009 there were 10,992 students enrolled at ECE centers throughout Vanuatu; 38,762 enrolled at primary schools in Year 1 to Year 6, 7,419 students enrolled in Year 7 to Year 8 and 10,548 enrolled at senior secondary school levels of Year 9 and above.
In 2009 there were 606 ECE centers, 454 primary schools and 79 secondary schools. The Government of Vanuatu directly manages 66% of primary schools and 53% of secondary schools and provides funding support to churches for 26% of primary schools and 34% of secondary schools.
The large majority of students in the education system are in rural schools; with 82% of students enrolled in rural primary schools and 69% of secondary students enrolled in rural secondary schools.
The Gross Enrollment Ratio (GER) for primary school was 110 which means that there were 110 children enrolled at primary school for every 100 children aged 6 to 11 years of age. At secondary level the GER was 40 which means that 40 out of every 100 young people aged 10 to 22 years of age were attending secondary school (Year 7 and above). There were no significant gender differences in the GER.
The Net Enrollment Ratio (NER) measures the enrolment of children of the correct age group for the level of schooling; for primary this is boys and girls aged 6 to 11 years of age and for secondary this is children aged 12 to 19 years. At primary level Year 1 to Year 6 87% of boys and 86% of girls aged 6 to 11 years were enrolled in primary school. At secondary level 44% of males and 42% of females aged 12 to 19 years were enrolled in school Years 7 and higher.
63% of children are enrolled in English speaking primary schools and 36% are in French speaking primary schools; and at secondary level 70% of students are in English speaking schools and 29% French.
The quality of education is improving
The number of teachers increased in 2009 by 5% compared to 2008. In 2009 there were 1,923 primary school teachers (55% of whom were female) and 715 secondary teachers (38% of whom were female). In 2009 19% of primary teachers, or close to 1 out of every 5 teachers, completed an in service training course compared with 16% in 2008.
Students at primary school have reasonable access to learning materials, as measured by the number of textbooks per child although there might not be enough materials for specialized classes like science. At secondary level access to learning materials is adequate but again there seem to be shortages for some subjects, such as English and French.
Annual Statistical Report 2009
Vanuatu Education Management Information System (VEMIS), Policy and Planning Unit Page 12
In 2009 there were a total of 3,068 classrooms in Vanuatu: 632 at ECE level, 1,992 primary level classrooms and 444 secondary classrooms. Classroom conditions are improving slowly. In 2008 head teachers and school principals rated 31%, or almost one out of every three classrooms as being in poor condition. In 2009 this decreased to 24%, or about one out of every four classrooms as being in poor condition.
Most schools rely on roof tanks or piped supply for their water; although 15% of primary schools and 10% of secondary schools use streams or rivers for a water source. Of concern is that while schools are served by a number of different water supply methods (tank, well etc) 54% of these were considered to be in poor condition. Schools do not have enough toilets for boys and girls.
Strong partnerships exist with communities
Most schools have active parent-teacher associations and 63% of primary and secondary school principals and head teachers rated the parent and community support they receive as satisfactory or higher showing that schools are working closely with the communities they serve.
Financing for education
The MoE receives strong financial support from Government and development partners. The Government budget allocation has increased to finance the roll-out of the ‘fee free’ policy in rural primary schools as well as scholarships and likewise development partners have increased their support, notably the governments of Australia and New Zealand.
In 2009 the MoE began implementing the Universal Primary Education policy. The most significant activity was government and development partners providing grants to primary schools to remove the need for schools to charge school fees for children in Year 1 to Year 6. This strong commitment from partners is reflected in the increased aid allocation to Education.
Figure 2: Ministry of Education total expenditure 2007 – 20091
In 2009 expenditure of the MoE accounted for 23% of total government expenditure. The MoE receives more funding than any other government ministry.
1 Source: Treasury Monthly Budget Report March 2011.
3,156 3,227
3,259
3,692
2007 2008 2009 2010
Annual Statistical Report 2009
Vanuatu Education Management Information System (VEMIS), Policy and Planning Unit Page 13
Chapter 1: Introduction
Education in Vanuatu
The Government highlights the importance of education sector development in making it one of the strategic priorities in its national development plan, the Priorities and Action Agenda. The MoE is the first Government Ministry to engage in and lead a Sector-Wide Approach (SWAp). The GoV wants to see improvements in access to education (especially for rural people), to raise the quality and relevance of education, education attainment and standards, and to improve planning, fiscal, financial and results-based management in the sector. This wish has materialized by the definition of the Free Primary Education Policy for Year 1 to 6 of the primary school cycle. In order to achieve its objectives to provide a quality education, the MoE has signed in 2009 a Joint Partnership Agreement between the Government of Vanuatu and development partners (New Zealand and Australia).
Aims of Education
The first aim of an education system is to: offer access to all children to a free and quality primary education, in particular to children from ethnic minority and to disadvantage population and girls; to ensure that children achieve the six years of primary education; to operate the transition from a ‘quantity based’ to a quality based primary education associate with a high level of learning; to strengthen management at central and provincial level as well as at school level; to ensure that there is a complete development and reform of the sector, especially in terms of decentralization and the creation of a basic education level of eight years of quality learning. In order to achieve this, the goals the Vanuatu education system aspires towards are:
Developing initiative and inquisitiveness and fostering analytical and creative thinking in young people. Raising the spirit of entrepreneurship and positive competitiveness.
Maintaining community spirit and a sense of togetherness.
Strengthening national cultural inheritance and cultural consciousness. Employability (improving opportunities for employment).
Children learning to respect each other and adults in their various roles. Children learning to respect and protect their natural environment. Ensuring that every individual obtains a good level of literacy.
Ensuring that every individual, besides knowing his/her mother tongue, will become bi-lingual in English and French.
Supporting the children’s spiritual growth.
VESS Achievements
Annual Statistical Report 2009
Vanuatu Education Management Information System (VEMIS), Policy and Planning Unit Page 14
Training sessions were organized in order for the schools to better complete the VEMIS questionnaire in 2009. Other training sessions were organized in 2007 and 2008 about management of school’s stock and further training was carried out to improve the management of school’s register.
The annual school survey was conducted in March 2009 in the six provinces. 97% of primary schools, 97% of early-childhood schools and 95% of secondary schools returned their questionnaire.
Annual School Survey
The data compiled in this Annual Statistical Report has been captured through an annual survey of early-childhood education (ECE) centers, primary and secondary schools throughout Vanuatu. The Annual VEMIS School Survey is a vital source of information for planning, policy making and budgeting. The School Census Process, which incorporates aspects of data collection, data validation and auditing, data analysis and reporting to stakeholders, has been carried out according to the steps illustrated in the following diagram:
The process is repeated each year to ensure all education sector stakeholders have access to good quality information about the education sector, and sector programs can be monitored for impact and positive outcomes of VESS.
The 2009 Annual Census was a successful data collection exercise, providing a wide range of essential data that will be used as a factual base for the planning, decision making and financial estimates. VEMIS can be used to facilitate the monitoring and evaluation of VESAP activities.
PLAN
•
CensusProcess Timeline
•Roles and
Responsibilities
PREPARE
•
Hard copy andelectronic survey forms
• Additional
Materials
DISTRIBUTE
•Forms to schools •Additional
Materials to Schools
SURVEY
•
Schools Head tocomplete their Survey forms
• School Head to
check the Survey Forms with the
Class teachers
SURVEY SUBMISSION
CENSUS DATE
Date that all schools will report on their school
enrolment
•
School head/principal to send their VEMIS form to the PEO•PEOs to send the school survey form
to MoE after Checking them
AUDIT
•
Data Entry coverage•Data Quality
selected schools
PUBLISH
•
Ad Hoc Analysis•Standard reports •Specialized studies
DESSIMINATE
•
Provide VEMIS data to all stakeholders•Reports throughout MoE •Reports to VMAC
REVIEW
•
Survey Process Efficiency•Survey Content and
relevance
Annual Statistical Report 2009
Vanuatu Education Management Information System (VEMIS), Policy and Planning Unit Page 15
The Planning and Policy Unit is mindful that there have been considerable delays in publishing the results of the annual school census and it has begun to review its systems to redress the delay issues. This will require the participation of all stakeholders including the Zone Curriculum Advisers, the Provincial Statistics Unit and the Provincial Education Office. In 2009, the VEMIS Project obtained 3.2 million Vatu for the VEMIS Survey, with part of the funding used to print the VEMIS questionnaires and to improve the survey coverage and quality.
Table 1: Survey Return Rates by School Type and Province, 2009
ECE Primary* Secondary# Province No. sent % received No. sent % received No. sent % received Torba 40 77.5% 23 100.0% 1 100.0%
Sanma 186 66.7% 93 93.5% 15 93.3%
Penama 47 87.2% 63 100.0% 12 100.0%
Malampa 119 57.1% 86 93.0% 17 88.2%
Shefa 105 43.8% 78 92.3% 23 100.0%
Tafea 85 90.6% 76 100.0% 10 100.0%
Total 582 66.5% 419 95.7% 78 96.2%
Source: MoE VEMIS, 2009. *Primary schools include some schools which offer Year 7 and Year 8 but are classified as primary school. #Secondary schools include some technical training centers which offer courses from Year 11 level such as Lowanaton in Tanna.
The overall return rate for VEMIS survey in 2009 was 95%which is one of MoE best rates registered since VEMIS began in 2007. This reflects the additional resources that the MoE dedicated to the data collection and training of the school Head Teacher in all provinces. The VEMIS Survey for Tafea province has greatly improved, followed by Penama. The province in need of more support from the MoE is Malampa. This province has had difficulties in meeting delivery dates for multiple reasons, including that the province is comprised of three islands and that a lot of schools in Malampa are remote.
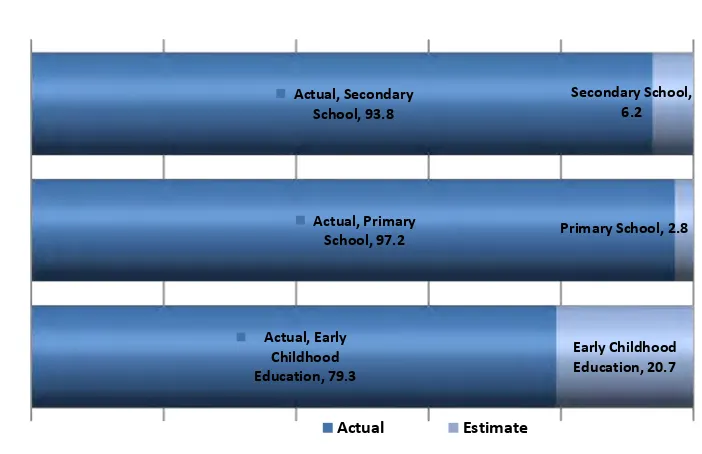
Figure 3: % of Actual and estimated schools in VEMIS, 2009
Source: MoE VEMIS, 2009
In 2009, the MoE registered 1,097 schools in the country of which 958 submitted their VEMIS forms and 139 did not. It is important to know the VEMIS school survey response rates to substantiate the important official national statistics derived about enrolment rates, ratios of students, teachers and materials as well as teacher
Actual, Early Childhood Education, 79.3
Actual, Primary School, 97.2 Actual, Secondary
School, 93.8
Early Childhood Education, 20.7 Primary School, 2.8
Secondary School, 6.2
Annual Statistical Report 2009
Vanuatu Education Management Information System (VEMIS), Policy and Planning Unit Page 16
characteristics in the pre-primary, primary and secondary parts of the education system.Where a school did not complete a return estimates were entered into VEMIS. This report takes into account all the estimated and actual data.
Figure 4: % of estimated and actual enrolment in VEMIS, 2009
Source: MoE VEMIS, 2009
In 2009, 94% of school enrolment is actual figures and 6% of school enrolment is estimated. The above graph shows the actual and estimated enrolment by school type. The VEMIS system estimates data for schools that have not submitted their VEMIS survey forms each year.
Actual: Schools that have completed and submitted their VEMIS forms for the current year in time.
Estimate: Schools that have not submitted their VEMIS forms in the current year and VEMIS system is carrying forward the school data from the previous year.
Figure 5: % of estimated and actual Number of Teachers, 2009
Source: MoE VEMIS, 2009
In terms of teachers, 93% of data for 2009 in VEMIS is based on returns and 7% is estimated teacher data.
Early Childhood Education Primary Secondary
83.4
97.3 91.1
16.6
2.7 8.9
Actual Estimate
0.0 20.0 40.0 60.0 80.0 100.0
Early Childhood Education Primary Secondary
81.7 97.1 96.3
18.3 2.9 3.7
Annual Statistical Report 2009
Vanuatu Education Management Information System (VEMIS), Policy and Planning Unit Page 17
Chapter 2: Summary of Education Statistics
Schools
There are three main types of schools operating in the formal education sector of Vanuatu: Early Childhood Education (ECE) centers, or pre-schools; Primary Schools (PS); and Secondary Schools (SS). ECEs are generally operated by communities, to provide young children (usually aged 4 – 5 years) with introductory schooling before starting Primary School.
Primary School starts at Year 1 in Vanuatu, and continues to Year 6, before pupils enter Junior Secondary schooling at Year 7. Secondary schools usually offer Year 9 to 13, with one Francophone institution offering Year 14 as a preparatory level for pupils wanting to go on to higher education.
Schools in Vanuatu are administered by a number of Education Authorities which can be grouped into five main types: Vanuatu Government, Church Authorities receiving Government Assistance, Church Authorities not receiving Government assistance, community schools (mostly for ECE) and private education authorities. Table 2: Number of schools by school type code, 2007 – 2009
Year ECE Primary, Year 1 – 6 only Primary, all* Secondary# Total
2007 679 422 490 79 1248
2008 627 427 480 82 1189
2009 606 420 454 79 1139
Source: MoE VEMIS, 2009. *Primary schools include some schools which offer Year 7 and Year 8 but are classified as primary school. #Secondary schools include some technical training centers which offer courses from Year 11 level such as Lowanaton in Tanna.
In tables 2 and 3 primary schools include schools which offer Year 7 and Year 8, years which are now defined as part of secondary school. Because these schools started off teaching Year 1 to Year 6 and then expanded to include Year 7 and Year 8, these schools are defined as primary schools in VEMIS. In tables regarding school facilities and utilities or education authority the “primary, all’ definition is used because the data is specific to that school. In tables about enrolment or other indicators which are calculated for primary school, the data used is for Year 1 to Year 6 only.
The total number of schools in Vanuatu in 2009 was 1,139, a decrease of 4% compared with 2008. The number of ECE centers decreased by 4% in 2009 compared to 2008; primary schools offering Year 1 – 6 only decreased by 2%, primary schools offering Year 1 – 8 decreased by 5%; and secondary schools decreased by 4%. The 2009 VEMIS Survey results show that a number of ECE are no longer functioning due to financial issues and lack of support from the communities.
Annual Statistical Report 2009
Vanuatu Education Management Information System (VEMIS), Policy and Planning Unit Page 18 Table 3: Number of schools by province, 2009
Province ECE Year 1 – 6 only Primary Primary, all* Secondary# Total schools
Torba 36 23 24 2 62
Sanma 200 92 100 17 317
Penama 58 63 68 11 137
Malampa 117 86 90 15 222
Shefa 95 80 89 23 207
Tafea 100 76 83 11 194
Total 606 420 454 79 1139
Source: MoE VEMIS, 2009. *Includes primary schools which offer Year 1 to Year 8 but are classified as primary. #Secondary schools include some technical training centers which offer courses from Year 11 level.
The Government of Vanuatu is the Education Authority with the biggest number of primary and secondary schools, with the government directly managing and operating 31% of all schools. The government manages 486 primary and secondary schools directly or as government assisted schools. A number of religious denominations operate schools with the assistance of the Government in the form of teacher salaries and school grants. In 2009, a number of activities were completed to help meet the needs of primary schools based on implementation of VESAP policies, one of which was the facilities upgrade of 25 primary schools. Table 4: Number of Schools by Education Authority Type and level of Education, 2009
Education authority ECE Primary, Year 1 – 6 only Primary, all* Secondary# Total
Government 18 286 301 42 361
Community 279 7 8 1 288
Private 244 16 21 7 272
Church (Government Assisted) 51 103 116 27 194
Church (Not Government Assisted) 4 7 8 2 14
Not stated 10 1 0 10
Total 606 420 454 79 1139
Source: MoE VEMIS, 2009. *Includes primary schools which offer Year 1 to Year 8 but are classified as primary. #Secondary schools include some technical training centers which offer courses from Year 11 level.
Enrolment details
In theory, the official age of enrolment in ECE is between 4 and 5 years of age until the child progresses to primary school at age 6 years. After completing Year 1 – 6 of primary school the 12 year old child advances for two years of junior secondary school in Year 7 – 8 with 14 year olds entering Year 9 at secondary level. Secondary school is junior and senior secondary school combined.
Annual Statistical Report 2009
Vanuatu Education Management Information System (VEMIS), Policy and Planning Unit Page 19 Table 5: Enrolment by survey year and school type, 2007 – 2009
Year ECE Primary 1-6 Secondary 7-13/14 Total 2007 10442 37667 15257 63366
2008 11614 38658 16734 67006
2009 10992 38762 17877 67631
Source: MoE VEMIS, 2009. Primary is Year 1 – 6 only.
Figure 6: Enrolment trend by school level, 2007 – 2009
Source: MoE VEMIS, 2009.
Table 6: Total enrolment by school type and Province, 2009
Province ECE Primary 1-6 Secondary 7-13/14 Total
Torba 561 1564 487 2612
Sanma 3052 7538 3695 14285
Penama 1023 5236 2527 8786
Malampa 1595 6789 2592 10976
Shefa 2763 10109 6613 19485
Tafea 1998 7526 1963 11487
Total 10992 38762 17877 67631
Source: MoE VEMIS, 2009. Primary enrollments are children enrolled in Year 1 to Year 6.
Sanma province accounted for 28% of ECE centers in 2009, followed by Shefa at 25%. At primary level the largest enrollment was in Shefa which represented 26% of enrollments followed by Tafea and Sanma 19% each of primary enrollments. At secondary level Shefa represented 37% of enrollments followed by Sanma with 21%.
10,442
37,667
15,257 10,992
38,762
17,877
0 5000 10000 15000 20000 25000 30000 35000 40000 45000
ECE Primary Secondary
Annual Statistical Report 2009
Vanuatu Education Management Information System (VEMIS), Policy and Planning Unit Page 20 Figure 7: % of enrolment at all levels by province, 2009
Source: MoE VEMIS, 2009.
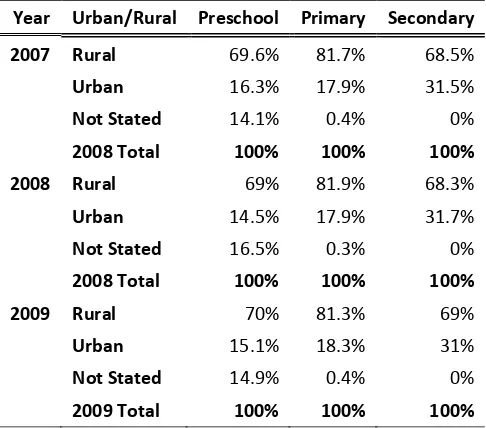
Shefa and Sanma provinces accommodated 50% of all students enrolled in 2009; half of total enrollment and most of these were in the urban areas with 43% if all students enrolled in the urban centers. The table below shows the distribution of students in percentage in urban and rural schools and highlights that most of the students in the education system are in rural areas at all levels of education.
Table 7: % students enrolled in urban and rural schools, 2009
Year Urban/Rural Preschool Primary Secondary 2007 Rural 69.6% 81.7% 68.5%
Urban 16.3% 17.9% 31.5%
Not Stated 14.1% 0.4% 0%
2008 Total 100% 100% 100% 2008 Rural 69% 81.9% 68.3%
Urban 14.5% 17.9% 31.7%
Not Stated 16.5% 0.3% 0%
2008 Total 100% 100% 100% 2009 Rural 70% 81.3% 69%
Urban 15.1% 18.3% 31%
Not Stated 14.9% 0.4% 0%
2009 Total 100% 100% 100%
Source: MoE VEMIS, 2009
The table below shows the importance of the access to the education system. The majority of education policy
and Education for All (EFA) in particular, focuses on primary school level because it is the fundamental cycle in
education and provides the foundation of the development of citizens and of their full and equal participation in society.
3.9%
21.1%
13.0%
16.0%
29.0%
17.0%
0.0% 5.0% 10.0% 15.0% 20.0% 25.0% 30.0% 35.0%
Torba Sanma Penama Malampa Shefa Tafea
Annual Statistical Report 2009
Vanuatu Education Management Information System (VEMIS), Policy and Planning Unit Page 21 Table 8: Enrolment by school type and year level, 2009
Level ECE Primary Secondary ECE 10992
Year 1 7851
Year 2 7236
Year 3 6722
Year 4 6166
Year 5 5590
Year 6 5197
Year 7 3859
Year 8 3560
Year 9 3261
Year 10 2756
Year 11 2127
Year 12 1481
Year 13 688
Year 14 145
Total 10992 38762 17877
Source: MoE VEMIS, 2009
In 2009 the government allocated grants to eliminate school fees in more than 75% of primary schools in Vanuatu, to promote full enrollment by removing school fees as a financial barrier to primary education. An extensive awareness campaign was conducted to encourage parents, care givers and community leaders to support the government’s initiative to improve access in primary education and to achieve the Millennium Development Goal for universal primary education by 2015 and continuing progress towards Universal Primary Education.
Figure 8: Proportion of students by age and level of schooling, 2009
Source: MoE VEMIS, 2009.
1.5 1.4 3.9
97.3 77.2 66.7
1.3 21.4 29.4
0% 20% 40% 60% 80% 100% Secondary
Primary ECE
Annual Statistical Report 2009
Vanuatu Education Management Information System (VEMIS), Policy and Planning Unit Page 22
According to the national ECE policy, the official age of enrolment in ECE is 4 to 5 years of age. The graph above shows that 4% of the students were younger than this and enrolled in ECE while 29% were older. In primary education, 77% of the students were at the official age (6 to 11 years old) while 1% were younger than this and 21% were older. At secondary level, 97% of the students were in the age group defined for the school level (12 to 19 years old) while 2% were younger and 1% older.
Table 9: Enrolment by age and year level for children aged 5 – 18 years, 2009
Age Year 1 Year 2 Year 3 Year 4 Year 5 Year 6 Year 7 Year 8 Total
5 550 5 555
6 2322 324 11 2657
7 2608 1723 275 8 4614
8 1471 2394 1438 232 8 5543
9 682 1625 1955 1194 248 12 1 5717
10 152 830 1695 1834 1235 229 19 5994
11 49 209 888 1603 1527 1147 241 4 5668
12 9 82 298 858 1342 1570 751 277 5187
13 6 28 117 275 841 1291 1238 1012 4808
14 13 33 105 266 702 964 1135 3218
15 2 3 7 37 85 179 474 751 1538
16 5 14 26 44 128 297 514
17 5 8 17 40 75 145
18 1 4 6 3 9 23
Total 7851 7236 6722 6166 5590 5197 3859 3560 46181
Source: MoE VEMIS, 2009. Grey shading shows a child entering at age 6 years progressing through primary school without repeating. The table above shows the number of students by year level for what is called ‘basic education’ or Year 1 to Year 8. It shows the challenge that the MoE faces with the large proportion of students who are outside the
official age range for basic education and a gradual decrease in the number enrolled as the school Year increases. The table highlights the high proportion of students who enter Year 1 of primary school who are aged 6 over years: 63% of students in Year 1 in 2009 were aged over 6 years of age.
The drop-out rate in primary schools was 2% (Year 1 – 6) in 2009 or 2 out of every 100 students at primary school did not complete the full year in 2009. This was consistent with that of 2008 which was also 2%. It would seem that the contribution the Government is making towards the cost of primary education is stabilizing enrollment numbers.
The promotion rate is the percentage of students at a given level which are promoted to the next (higher) level the following year. In 2009 the promotion rate for children attending Year 1 to Year 8 was 82%.
Annual Statistical Report 2009
Vanuatu Education Management Information System (VEMIS), Policy and Planning Unit Page 23 Figure 9: Repeater rate by school year, 2008 – 2009
Source: MoE VEMIS, 2009.
Figure 10: Dropout rate by school year, 2008 – 2009
Source: MoE VEMIS, 2009.
The two graphs above shows quite a consistent pattern between 2009 and 2008 for both dropout and repeater rates. For repeaters the rates are highest in the early years of schooling and then decline while the opposite happens with drop outs where the rates are consistent in the early years and then increase at Junior Secondary (Year 7), and to a lesser extent in Year 8.
The following table shows that the high rate of repeaters, particularly in Year 1, is the major contribution to inefficiency in the primary level of education. In 2009 on average in Vanuatu 1 out of every 5 students in Year 1 were repeating Year 1. The MoE needs to address these high rates of repeating the first years of the education cycle.
18.3
15.1 14.3
11.6
7.8 6.9
2 1.1 19.7
15.5 14.8
12.3
10.2
8.5
1 0.7
0 2 4 6 8 10 12 14 16 18 20 22
Year 1 Year 2 Year 3 Year 4 Year 5 Year 6 Year 7 Year 8
Per
cen
ta
ge
2008 2009
1.9
1.6 1.8 1.7
2.3
2.8
3.6
3.4
2.7
2.2 2.1 2.3
2.0 2.5 3.9 3.0 0.0 0.5 1.0 1.5 2.0 2.5 3.0 3.5 4.0 4.5
Year 1 Year 2 Year 3 Year 4 Year 5 Year 6 Year 7 Year 8
Per
cen
ta
ge
Annual Statistical Report 2009
Vanuatu Education Management Information System (VEMIS), Policy and Planning Unit Page 24 Table 10: Drop out and repeater rates by Year, 2008 – 2009
2008 2009
Level Repeater rate Dropout rate Promotion rate Repeater rate Dropout rate Promotion rate
Year 1 18.8 1.9 79.3 19.7 2.6 77.7
Year 2 15.7 1.6 82.7 15.5 2.2 82.3
Year 3 14.8 1.8 83.4 14.8 2.0 83.2
Year 4 12.2 1.6 86.2 12.3 2.2 85.5
Year 5 10.1 2.3 87.6 10.2 1.9 87.9
Year 6 9.3 2.7 88 8.5 2.4 89.1
Year 7 3.7 3.5 92.8 3.0 3.9 93.1
Year 8 0.7 3.5 95.8 2.7 3.0 94.3
Total 12.1 2.2 85.7 12.4 2.4 85.2
Source: MoE VEMIS, 2009.
The average repeater rate in 2009 was 12% for Year 1 to Year 8; for Year 1 to Year 6 it was 14%. The table and charts above confirms the inefficiency of the education system due to the high level of repeaters and drop-outs with the repeater rate making the most significant impact on the inefficiency of the education system. The repeater rate should in theory be around zero for Year 1 to Year 8 as the only reason why a student would repeat is based on the teacher’s assessment of the student’s performance that the student should not be promoted: there are no examinations or any barriers to promotion apart from teacher’s recommendations. Information on the number of students enrolled under different educational authorities provides an indication of society’s general assessment of the quality of education based on the assumption that if given a choice parents will enroll their child at the school which would give their child the best education possible.
At ECE level, the number of students in ECE centers under church administration and assisted by Government decreased significantly by 23% in 2009 compared with 2007; while ECE centers run by the church with no government support increased as did private ECE centers.
Annual Statistical Report 2009
Vanuatu Education Management Information System (VEMIS), Policy and Planning Unit Page 25 Table 11: Enrolment by school type and by education authority, 2007 – 2009
School level Education authority 2007 2008 2009
ECE Government 584 461
Community 4399 4957 4918
Private 4190 5425 4525
Church (Government Assisted) 1128 1087 869
Church (Not Government Assisted) 54 52 97
Not stated 87 93 122
Total 10442 11614 10992
Primary Government 27687 28137 27915
Year 1 to 6 Community 433 457 407
Private 1030 1049 1250
Church (Government Assisted) 8188 8648 8937
Church (Not Government Assisted) 329 367 253
Total 37667 38658 38762
Basic Government 33018 33812 33647
Year 1 to 8 Community 496 528 466
Private 1367 1348 1552
Church (Government Assisted) 9814 10176 10226
Church (Not Government Assisted) 393 413 290
Total 45088 46277 46181
Secondary Government 4420 5452 6087
Year 9-13/14 Community 73 73 76
Private 716 709 861
Church (Government Assisted) 2562 2795 3325
Church (Not Government Assisted) 65 86 109
Total 7836 9115 10458
Source: MoE VEMIS, 2009. Government ECE centers are ECE centers attached to Government funded primary schools.
Annual Statistical Report 2009
Vanuatu Education Management Information System (VEMIS), Policy and Planning Unit Page 26 Figure 11: Proportion of students enrolled under different education authorities at primary level Year 1 – Year 6, 2007 – 2009
Source: MoE VEMIS, 2009.
At the higher secondary level, Year 9 and higher, the proportion of students enrolled in fully funded
government schools and church schools with government funding assistance account for over 80% of student enrollments. There seems to be some student movement between these two school types on an annual basis, with the proportion of government assisted church school enrollment decreasing in 2008 while the proportion of government enrollment increased in the same year.
Figure 12: Proportion of students enrolled under different education authorities at higher secondary level, Year 9-13/14, 2007 – 2009
Source: MoE VEMIS, 2009.
21.7 0.9 1.1 73.5 2.7 22.4 0.9 1.2 72.8 2.7 23.1 0.7 1.0 72.0 3.2
0.0 20.0 40.0 60.0 80.0
Church (Government Assisted) Church (Not Government Assisted) Community Government of Vanuatu Private 2009 2008 2007 32.7 0.8 0.9 56.4 9.1 30.7 0.9 0.8 59.8 7.8 31.8 1.0 0.7 58.2 8.2
0.0 10.0 20.0 30.0 40.0 50.0 60.0 70.0
Annual Statistical Report 2009
Vanuatu Education Management Information System (VEMIS), Policy and Planning Unit Page 27
Chapter 3: Vanuatu Education Sector Strategy
Vision
The MoE’s vision is for a caring education system which provides every young person with the lifelong skills, values, and confidence to be self-reliant and to contribute to the development of Vanuatu, and which works in partnership with all stakeholders to provide well-managed schools.
Mission
Our mission is to provide pupil-centered education that is accessible, relevant, sustainable, responsive, and of good quality, to guarantee every young person:
•
Pre-school and basic education to Year 8, including literacy, numeracy, life skills, and livelihood skills, respect for our history and culture, and respect for human rights;•
Expanded opportunities for secondary, technical, tertiary and higher education;•
Support for parents and communities to participate in and manage their schools;•
A well-managed and accountable education system which focuses on building the human resources of Vanuatu, improving learning, living, and working opportunities, and enabling young people tocontribute to the productive sectors in both rural and urban areas.
Goals
Based on these vision and mission statements, seven core goals for education sector expansion and development have been identified. The tables and charts that have been compiled in the following section help to illustrate recent trends and current status of several key indicators of achievement in respect of the VESS goals. Monitoring these indicators over time will enable MoE to monitor progress towards the achievement of VESS goals, and assess the impact of VESS programs on these highlighted areas for investment and reform.
Vanuatu, as a least developed country (LDC), recognizes there is a risk that the Millennium Development Goals (MDGs) related to education might not be reached before 2015. In order to achieve the MDGs, the government is mobilizing resources with assistance from development partners to sustain and accelerate the implementation of the reform program.
Goal One
Objective 1: Achieve universal Primary Education completions, strengthen literacy, languages and
numeracy, and develop a national pre-school curriculum and pre-school training program.
A starting point for the achievement of this goal is to ensure that all children in Vanuatu have access to school. The MoE monitors access to education using indicators such as Gross Enrolment Ratios (GER) and Net Enrolment Ratios (NER). GER and NER can be defined as follows:
GER: Total enrolment in ECE, Primary or Secondary education expressed as a percentage of the total population of children who are of the official age group for that level of education. NER: Total enrolment of pupils of the official age group for ECE, Primary or Secondary education
Annual Statistical Report 2009
Vanuatu Education Management Information System (VEMIS), Policy and Planning Unit Page 28
The following graphs and tables show the GER and NER over the past three years at the ECE, Primary and Secondary level (which includes Junior Secondary and Senior Secondary education levels).
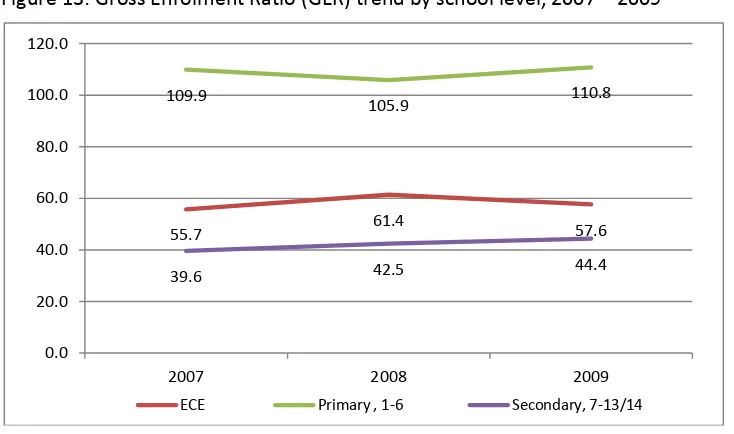
Figure 13: Gross Enrolment Ratio (GER) trend by school level, 2007 – 2009
Source: MoE VEMIS, 2009.
In 2009 the GER for primary education was 110.8 which means that for every 100 children of the official school age (6-11 years) there were 110 attending primary school – reflecting the number of children enrolled at primary who are older than the official age. At secondary level in 2009 45 children out of every 100 of secondary school age were attending school.
At the primary school level (Year 1 to Year 6), the 2009 GER (110.8) was an increase of 3.8% from 2008. In 2009 government began the implementation of the Universal Education policy as one of the priorities of the Road Map to remove barriers to primary school attendance from 2010. In 2009 school grant payments were made to 325 primary schools in Vanuatu (Year 1 to 6) based on VEMIS data.
In 2009 the ECE GER decreased by 9.3% from that of 2008, mostly because of the closing of 21 ECE centers in 2009. The future of ECE education remains a major concern. It seems that some communities have difficulties managing these ECE centers combined with other factors such as parents not being able to afford to pay the ECE fees.
The GER at secondary school level trend has been increasing since 2007 for both male and female enrolments. In 2007 the GER at secondary was 39.6, or 40 young people out of every 100 of secondary school age were attending secondary school. By 2009 this figure increased to 45 out of every 100 young people of secondary school age were attending school. There is a very slight difference in girls and boys enrolled at secondary school level where there is a slightly higher proportion of girls enrolled at secondary school than boys.
Table 12: GER Trends by level of education, 2007 – 2009
ECE Primary 1-6 Secondary 7-13/14
Year Male Female Total GPI Male Female Total GPI Male Female Total GPI
2007 56.4 55.1 55.7 0.95 109.8 110.1 109.9 1.00 39.0 40.2 39.6 1.03
2008 62.9 59.9 61.4 0.96 110.9 112.5 111.6 1.01 42.1 42.9 42.5 1.02
2009 58.7 56.5 57.6 0.96 110.7 110.8 110.8 1.00 43.1 45.8 44.4 1.06 Source: MoE VEMIS, 2009.
55.7 61.4 57.6
109.9 105.9 110.8
39.6 42.5 44.4
0.0 20.0 40.0 60.0 80.0 100.0 120.0
2007 2008 2009
Annual Statistical Report 2009
Vanuatu Education Management Information System (VEMIS), Policy and Planning Unit Page 29
Most statistical indicators which are disaggregated by sex and can be analyzed to show the proportion of girls and boys or men and women with the attribute or statistic. Taking the GER for girls and dividing it by the ratio for boys gives a Gender Parity Index (GPI). A GPI value of less than one indicates a difference in favor of boys; a value above one indicates a difference in favor of girls; and a value close to one indicates gender parity.
At ECE level the GPI indicates that there are more boys than girls enrolled; although gender parity was very close to 100 in 2009. This is despite the fact that in the official age group for ECE (3 to 5 years of age) there are 5% more boys than girls (VNSO Census of Population and Housing, 2009). At primary school level there is gender parity with the GPI at 1.00 in 2009. At secondary level enrollment is almost at gender parity with a very small difference in the GPI.
The NER for primary education continues a trend of a slight annual decrease, from a rate of 86.7 in 2007 to 85.5 in 2009. This means that 86 children aged 6 – 11 years were enrolled in primary school Year 1 – Year 6 per 100 children aged 6 – 11 years. The NER was used to establish the Universal Education policy and is used to monitor its implementation.
Meanwhile, NER for ECE centers and secondary schools has increased since 2007. This shows that for these two levels of education, the number of students having the official age has improved over the years.
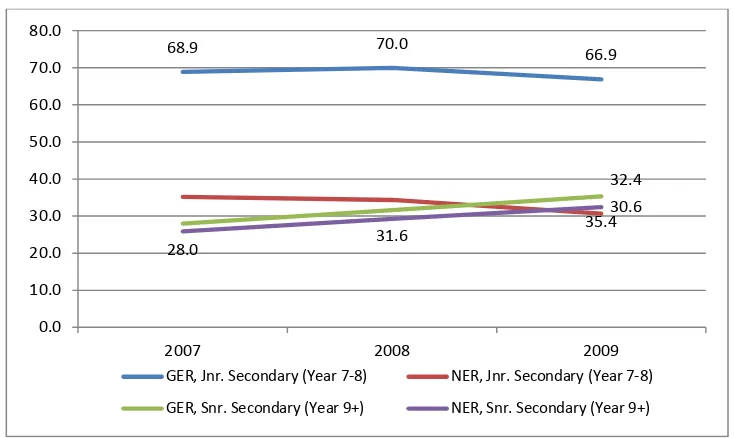
Figure 14: NER and GER for Junior and Senior Secondary school levels, 2007 - 2009
Source: MoE VEMIS, 2009.
At secondary level there are divergent trends between junior secondary school (Year 7 – Year 8) and senior secondary school (Year 9 and higher): the proportion of young people aged 14 – 19 years of age attending senior secondary school is increasing while the proportion of young people aged 12 – 13 years of age attending junior secondary school (Year 7 – Year 8) is decreasing.
Another complementary and more precise indicator is the percentage of enrolment by specific age: the age participation rate. This indicator can be used to present the level of participation by specific age. This indicator shows that in Year 1 30 out of every 100 children enrolled in Year 1 were aged 6 years old in 2009. From Year 9 and higher the percent of pupils at the right age for the level participating varies from 29% of students were aged 15 years in Year 10 (NER of 15.1) to 35% of young people enrolled in Year 9 were aged 14 years of age (NER 19.8).
68.9 70.0 66.9
30.6
28.0 31.6
35.4 32.4
0.0 10.0 20.0 30.0 40.0 50.0 60.0 70.0 80.0
2007 2008 2009
Annual Statistical Report 2009
Vanuatu Education Management Information System (VEMIS), Policy and Planning Unit Page 30 Table 13: GER and NER by sex with GPI for school levels, 2007-2009
GER NER
School level Year Male Female Total GPI Male Female Total GPI ECE 2007 56.4 55.1 55.7 0.95 33.0 33.5 33.3 1.01
Age 3 – 5 years 2008 62.9 59.9 61.4 0.96 38.2 37.6 37.9 0.98
2009 58.7 56.5 57.6 0.96 38.3 38.5 38.4 1.01
Primary (Yr 1- 6) 2007 109.8 110.1 109.9 1.00 85.9 87.6 86.7 1.02
Age 6 – 11 years 2008 110.9 112.5 111.6 1.01 85.6 88.7 87.1 1.04
2009 110.7 110.8 110.8 1.00 84.6 86.6 85.5 1.02
Junior Secondary (Yr 7 – 8) 2007 66.4 71.5 68.9 1.08 31.9 38.6 35.2 1.21
Age 12 – 13 years 2008 67.6 72.6 70.0 1.07 31.8 37.1 34.3 1.17
2009 64.0 69.9 66.9 1.09 27.7 33.8 30.6 1.22
Senior Secondary (Yr 9+) 2007 28.1 27.8 28.0 0.99 25.8 25.9 25.9 1.01
Age 14 – 19 years 2008 31.8 31.5 31.6 0.99 29.2 29.2 29.2 1.00
2009 34.5 36.3 35.4 1.05 31.3 33.6 32.4 1.07
Secondary combined (Yr 7+) 2007 39.0 40.2 39.6 1.03 25.8 25.9 25.9 1.01
Age 12 – 19 years 2008 42.1 42.9 42.5 1.02 29.2 29.2 29.2 1.00
2009 43.1 45.8 44.4 1.06 31.3 33.6 32.4 1.07 Source: MoE VEMIS, 2009.
The following table and chart show the recent trends for GER, NER and GPI at each level of schooling from 2007 to 2009.
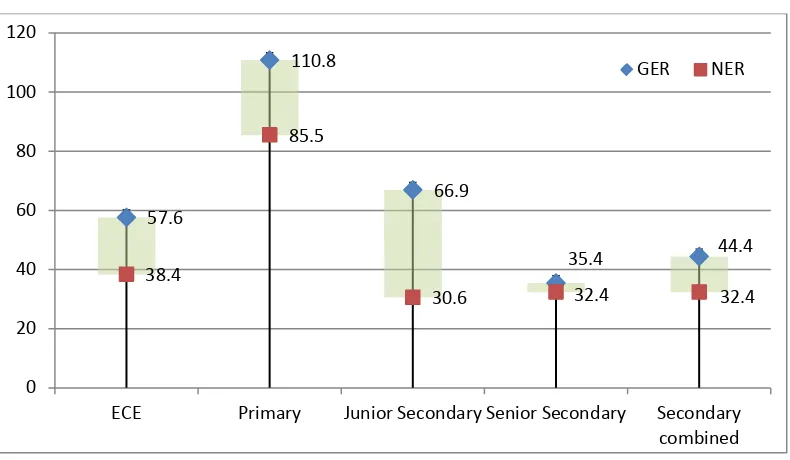
Figure 15: GER and NER for the four levels of education, 2009
Source: MoE VEMIS, 2009.
The differences between the GER and the NER in 2009 for ECE and junior secondary level highlight the low level of participation of children in these levels of education in Vanuatu. Presenting the GER alongside the NER shows the proportion of students who are not in the official age group for each level of schooling, with the difference the largest at Junior Secondary School level where 36% of students enrolled are not in the official
57.6
110.8
66.9
35.4 44.4
38.4
85.5
30.6 32.4 32.4
0 20 40 60 80 100 120
Annual Statistical Report 2009
Vanuatu Education Management Information System (VEMIS), Policy and Planning Unit Page 31
age group. At senior secondary level the GER and NER are almost the same, with only a 3% difference in the age participation.
Table 14: Participation by school level and specific age (in percentage), 2009
Level Total Enrolment Official Age Enrolment % of participation by age NER by Year
ECE 10992 7335 66.7% 38.5
Year 1 7851 2328 29.7% 39.1
Year 2 7236 1746 24.1% 31.0
Year 3 6722 1408 20.9% 25.9
Year 4 6166 1204 19.5% 18.7
Year 5 5590 1240 22.2% 20.8
Year 6 5197 1172 22.6% 21.1
Year 7 3859 842 21.8% 15.3
Year 8 3560 1044 29.3% 20.0
Year 9 3261 1128 34.6% 19.8
Year 10 2756 792 28.7% 15.1
Year 11 2127 582 27.4% 12.2
Year 12 1481 390 26.3% 8.4
Year 13 688 200 29.1% 4.3
Year 14 145 44 30.3% 1.0
Total 67631 21455 31.7% 22.7
Source: MoE VEMIS, 2009.
Figure 16: Age participation rate (%) and NER by school level, 2009
Source: MoE VEMIS, 2009.
This graph shows the age participation in percentage and the NER by Year of schooling. The graph shows that while almost 70% of ECE pupils enrolled are the right age for ECE (4 – 5 years of age); this in fact was only about 40% of all children aged 4 – 5 years in 2009.
Table 15: Number of students enrolled in urban and rural schools, 2009
0.0 10.0 20.0 30.0 40.0 50.0 60.0 70.0 80.0
ECE Year
1 Year 2 Year 3 Year 4 Year 5 Year 6 Year 7 Year 8 Year 9 Year 10 Year 11 Year 12 Year 13 Year 14
Annual Statistical Report 2009
Vanuatu Education Management Information System (VEMIS), Policy and Planning Unit Page 32
School level Year Rural Urban Not stated Total
ECE 7691 1664 1637 10992
Primary Yr 1 6473 1347 31 7851
Yr 2 5895 1311 30 7236
Yr 3 5457 1239 26 6722
Yr 4 5033 1096 37 6166
Yr 5 4535 1034 21 5590
Yr 6 4111 1084 2 5197
Total 31504 7111 147 38762
Secondary Yr 7 2900 959 3859
Yr 8 2611 949 3560
Yr 9 2429 832 3261
Yr 10 1990 766 2756
Yr 11 1309 818 2127
Yr 12 792 689 1481
Yr 13 311 377 688
Yr 14 145 145
Total 12342 5535 17877
Total 51537 14310 1784 67631
Source: MoE VEMIS, 2009.
It is also important to know the distribution of students by urban and rural schools. In 2009 at primary level 81% of students live in rural areas compared with an overall level of 69% of students are in rural areas. At Junior Secondary 74% of students are in rural schools, and for Senior Secondary 65% of students enrolled are in rural secondary schools while 35% are in urban areas.
Figure 17: Percent of enrolment in urban and rural locations, broad level, 2009
Source: MoE VEMIS, 2009.
70.0 81.3 67.9 65.3
15.1 18.3
25.7 34.7
14.9 0.4
0.0 20.0 40.0 60.0 80.0 100.0
ECE Primary 1-6 Junior Secondary (Level
7-8)
Senior Secondary (Year
9+) Not Stated
Annual Statistical Report 2009
Vanuatu Education Management Information System (VEMIS), Policy and Planning Unit Page 33
An intake refers to the children of the correct age to attend a specific level of schooling. Intake measures are useful to show the proportion of children entering a school year, usually the first year of primary education.
GIR: Total enrolment in ECE, Primary or Secondary education expressed as a percentage of the total population of children who are of the official age group for that level of education.
NIR: Total enrolment of pupils of the official age group for ECE, Primary or Secondary education expressed as a percentage of the total population of children who are of the official age group for that level of education.
Table 16: Gross and Net Intake Ratio in Year 1, GPI or the ratios, 2007 - 2009
GIR NIR Gender Parity Index GER Male Female Male Female GPI: GIR GPI: NIR 2007 140.2 134.6 43.6 42.2 0.96 0.97
2008 140.7 138.2 39.8 43.6 0.98 1.09
2009 132.6 131.4 37.4 40.9 0.99 1.09 Source: MoE VEMIS, 2009.
In Vanuatu the official primary school entrance age is 6 years of age. The table above shows the number of students enrolled in Year 1 of primary school as a percentage of the total population of 6 year olds in Vanuatu (GIR), and the total number of 6 year old new entrants into primary school as a percentage of the total population of 6 year olds in Vanuatu (NIR). The large difference between the GIR and NIR indicates that 93% of students enrolled in year 1 are not of the official start age for Primary of 6 years.
The graph below shows clearly the decrease of enrolment at Year 1 as measured by the NIR of the primary since 2007.
Figure 18: Gross Enrolment Rate (GER) and Net Enrolment Rate (NER) in year 1 of primary, 2007-2009
Source: MoE VEMIS, 2009.
137.5 139.5 132.0
42.9 41.6 39.0
0.0 20.0 40.0 60.0 80.0 100.0 120.0 140.0 160.0
2007 2008 2009
Annual Statistical Report 2009
Vanuatu Education Management Information System (VEMIS), Policy and Planning Unit Page 34 Table 17: Number of repeaters, drop outs and promotion rates by sex and year level, 2008
Level
Repeaters Dropouts Promotion rate Male Female Male Female Male Female Year 1 830 716 114 94 78% 79%
Year 2 651 468 78 75 81% 84%
Year 3 600 395 70 66 81% 85%
Year 4 448 310 80 57 84% 88%
Year 5 321 250 66 41 87% 89%
Year 6 261 181 77 48 86% 90%
Year 7 85 71 74 72 93% 93%
Year 8 12 12 57 48 96% 97%
Year 9 41 42 29 41 96% 95%
Year 10 14 11 28 26 96% 97%
Year 11 18 20 33 18 94% 96%
Year 12 15 12 10 19 97% 95%
Year 13 2 1 4 0 98% 100%
Source: MoE VEMIS, 2009.
In the table above the enrolment information for 2008 is used because the VEMIS information on repeaters applies to the previous year, so repeaters information captured in VEMIS in 2009 applies to the full year of 2008. It shows that there are some concerns about the promotion rates of boys which are slightly lower than that for girls from Year 2 to Year 6.
Figure 19: Number of drop outs and sex, year 1 – year 6, 2006-2008
Source: MoE VEMIS, 2009.
The graph above shows that the number of male drop outs from Year 1 to Year 6 has been higher than that for females since 2006; although there has been a 4% increase in the number of female drop outs compared with 2% for males between 2006 and 2008.
476
411
485
366
338 381
0 100 200 300 400 500 600
2006 2007 2008
Annual Statistical Report 2009
Vanuatu Education Management Information System (VEMIS), Policy and Planning Unit Page 35 Figure 20: Number of drop outs and sex, Year 7 – Year 14, 2006-2008
Source: MoE VEMIS, 2009.
The graph above shows at higher levels of education, from Year 7 and above, the trend has been for a general decrease in the number of drop outs. Between 2006 and 2008 there was a 25% decrease in drop outs for both males and females.
Access to education for all is a priority area for the MoE and inclusive education programs are being developed to ensure all children, regardless of ability, are able to access education. The Ministry is working to ensure that all children, regardless of location, physical or mental difficulties, have a place in the classroom. In 2008 an Inclusive Education Policy was developed to improve the learning outcomes of disabled students and resources allocated for disabled students in VESAP and VERM.
In the VEMIS system pupils classified as disabled might have a medically diagnosed disability; but it must be noted that VEMIS statistics are based on teacher’s judgments of their pupils through physical appearance and ability, inside classroom learning assessment, their academic performance and records of pupils’ medical reports if available.
Table 18: Number of pupils with a disability, by school level and location, 2007 – 2009
Students enrolled with a disability
Year School level Rural students % Urban students % stated Total Not 2007 Primary* 4649 15.1 776 11.5 6 5431
Secondary 348 3.3 215 4.5 563
Total 4997 12.1 991 8.6 6 5994
2008 Primary* 3388 10.7 595 8.6 5 3988
Secondary 485 4.2 167 3.1 652
Total 3873 9.0 762 6.2 5 4640
2009 Primary* 2889 9.2 602 8.5 7 3498
Secondary 302 2.4 626 11.3 328
Total 3191 7.3 628 5.0 7 3826
Source: MoE VEMIS, 2009. *Primary schools include some schools which offer Year 7 and Year 8 but are classified as primary school.
314
294
235 300
265
224
0 50 100 150 200 250 300 350
2006 2007 2008