Correspondence to:Jan Dousa (jan.dousa@pecny.cz)
Received: 15 January 2017 – Discussion started: 2 February 2017
Revised: 14 August 2017 – Accepted: 28 August 2017 – Published: 29 September 2017
Abstract. In this paper, we present results of the second reprocessing of all data from 1996 to 2014 from all sta-tions in International Association of Geodesy (IAG) Refer-ence Frame Sub-Commission for Europe (EUREF) Perma-nent Network (EPN) as performed at the Geodetic Observa-tory Pecný (GOP). While the original goal of this research was to ultimately contribute to the realization of a new Eu-ropean Terrestrial Reference System (ETRS), we also aim to provide a new set of GNSS (Global Navigation Satellite Sys-tem) tropospheric parameter time series with possible appli-cations to climate research. To achieve these goals, we im-proved a strategy to guarantee the continuity of these spheric parameters and we prepared several variants of tropo-sphere modelling. We then assessed all solutions in terms of the repeatability of coordinates as an internal evaluation of applied models and strategies and in terms of zenith tropo-spheric delays (ZTDs) and horizontal gradients with those of the ERA-Interim numerical weather model (NWM) reanaly-sis. When compared to the GOP Repro1 (first EUREF repro-cessing) solution, the results of the GOP Repro2 (second EU-REF reprocessing) yielded improvements of approximately 50 and 25 % in the repeatability of the horizontal and ver-tical components, respectively, and of approximately 9 % in tropospheric parameters. Vertical repeatability was reduced from 4.14 to 3.73 mm when using the VMF1 mapping func-tion, a priori ZHD (zenith hydrostatic delay), and non-tidal atmospheric loading corrections from actual weather data. Raising the elevation cut-off angle from 3 to 7◦and then to 10◦ increased RMS from coordinates’ repeatability, which
was then confirmed by independently comparing GNSS tro-pospheric parameters with the NWM reanalysis. The assess-ment of tropospheric horizontal gradients with respect to the ERA-Interim revealed a strong sensitivity of estimated
gra-dients to the quality of GNSS antenna tracking performance. This impact was demonstrated at the Mallorca station, where gradients systematically grew up to 5 mm during the period between 2003 and 2008, before this behaviour disappeared when the antenna at the station was changed. The impact of processing variants on long-term ZTD trend estimates was assessed at 172 EUREF stations with time series longer than 10 years. The most significant site-specific impact was due to the non-tidal atmospheric loading followed by the impact of changing the elevation cut-off angle from 3 to 10◦. The other processing strategy had a very small or negligible impact on estimated trends.
1 Introduction
which was called the EUREF Permanent Network (EPN; Bruyninx et al., 2012). Although its primary purpose was to maintain the European Terrestrial Reference System (ETRS), the EPN also attempted to develop a pan-European infras-tructure for scientific projects and co-operations (Ihde et al., 2014). Since 1996, the EPN has grown to include approxi-mately 300 operating stations, which are regularly distributed throughout Europe and its surrounding areas. Today, EPN data are routinely analysed by 18 EUREF analysis centres.
Throughout the past two decades, GPS data analyses of both global and regional networks have been affected by various changes in processing strategy and updates of pre-cise models and products, reference frames and software packages. To reduce discontinuities in products, particularly within coordinate time series, homogeneous reprocessing was initiated by the IGS and EUREF on a global and regional scale, respectively. To exploit the improvements in these IGS global products, the second European reprocessing was per-formed in 2015–2016, with the ultimate goal of providing a newly realized ETRS.
Currently, station coordinate parameter time series from reprocessed solutions are mainly used in the solid earth sci-ences as well as to maintain global and regional terrestrial reference systems. Additionally, from an analytical perspec-tive, the long-term series of estimated parameters and their residuals are useful for assessing the performances of applied models and strategies over a given period. Moreover, tropo-spheric parameters derived from this GNSS reanalysis could be useful for climate research (Yuan et al., 1993), due to their high temporal resolution and unrivalled relative accuracy for sensing water vapour when compared to other techniques, such as radio sounding, water vapour radiometers and radio occultation (Ning, 2012). In this context, the GNSS zenith tropospheric delay (ZTD) represents a site-specific parame-ter characparame-terizing the total signal path delay in the zenith due to both dry (hydrostatic) and wet contributions of the neutral atmosphere, the latter of which is known to be proportional to precipitable water (Bevis et al., 1994).
With the second EUREF reprocessing, the secondary goal of the Geodetic Observatory Pecný (GOP) was to support the activity of Working Group 3 of the COST Action ES1206 (Guerova et al., 2016), which addresses the evaluation of ex-isting and future GNSS tropospheric products and assesses their potential uses in climate research. For this purpose, the GOP provided several solution variants, with a special focus on optimal tropospheric estimates, including VMF1 vs. GMF mapping functions, the use of different elevation cut-off an-gles and estimates of tropospheric horizontal gradients using different time resolutions. Additionally, in order to enhance tropospheric outputs, we improved the processing strategy in a variety of ways compared to the GOP Repro1 (first EU-REF reprocessing) solutions (Douša and Václavovic, 2012): (1) by combining tropospheric parameters during midnights and across GPS week breaks, (2) by checking weekly co-ordinates before their substitutions in order to estimate
tro-pospheric parameters and (3) by filtering out problematic stations by checking the consistency of daily coordinates. The results of this GOP reprocessing, including all available variants, were assessed using internal evaluations of applied models and strategy settings and using external validations with independent tropospheric parameters derived from nu-merical weather model (NWM) reanalyses.
The processing strategy used in the second GOP reanaly-sis of the EUREF Permanent Network is described in Sect. 2, and the new approach that is developed to guarantee a con-tinuity of estimated tropospheric parameters during mid-nights as well as between different GPS weeks is summa-rized in Sect. 3. The relationship between mean tropospheric horizontal gradients and the quality of low-elevation GNSS tracking is explained in Sect. 4. The results of internal and external evaluations of GOP solution variants and process-ing models are presented in Sect. 4, and the assessment of impacts of specific variants on estimated ZTD trends are is presented in Sect. 5. The last section concludes our findings and suggests avenues of future research.
2 GOP processing strategy and solution variants
The EUREF GOP analysis centre was established in 1997 and contributed to operational EUREF analyses until 2013 by providing final, rapid and near-real-time solutions. Recently, the GOP changed its contributions to that of a long-term ho-mogeneous reprocessing of all data from the EPN histori-cal archive. The GOP solution of the first EUREF reanalysis (Völksen, 2011) comprised the processing of a subnetwork of 70 EPN stations during the period of 1996–2008. In 2011, for the first time, the GOP reprocessed the entire EPN net-work (spanning a period of 1996–2010) in order to validate the European reference frame and to provide the first homo-geneous time series of tropospheric parameters for all EPN stations (Douša and Václavovic, 2012).
In the second EUREF reprocessing (Repro2), the GOP analysed data obtained from the entire EPN network from a period of 1996–2014 using the Bernese GNSS Software version 5.2 (Dach et al., 2015). The GOP strategy relies on a network approach utilizing double-difference observations. Only GPS data from the EPN stations were included accord-ing to official validity intervals provided by the EPN Cen-tral Bureau (http://epncb.oma.be). Two products were de-rived from the reprocessing campaign in order to contribute to a combination at the EUREF level performed by the coor-dinator of analysis centres and the coorcoor-dinator of troposphere products: (1) site coordinates and corresponding variance– covariance information in daily and weekly SINEX files and (2) site tropospheric parameters in daily Solution (Soft-ware/technique) INdependent EXchange Format for combi-nation of TROpospheric estimates (SINEX_TRO) files.
using the CODE global ionosphere product (GO5).
Loading effects Atmospheric tidal loading and hydrology loading not applied. Ocean tidal loading FES2004 used. Non-tidal atmospheric loading introduced in advanced variants from the model from TU Vienna (GO4–GO6).
Figure 1.EUREF Permanent Network’s clusters (designated by dif-ferent colours) in the second GOP reprocessing.
with pre-eliminated integer phase ambiguities when ensur-ing strong ties to the IGS08 reference frame. This strategy introduced state-of-the-art models (IERS Conventions, 2010) that are recommended as standards for highly accurate GNSS analyses, particularly for the maintenance of the reference frame. Additionally, the use of precise orbits obtained from the second CODE (Centre of Orbit Determination in Europe) global reprocessing (Dach et al., 2014) guaranteed complete consistency between all models on both the provider and user sides. Characteristics of this GOP data reprocessing strategy and their models are summarized in Table 1. Additionally, seven processing variants were performed during the GOP Repro2 analysis for studying selected models or settings: (a) applying the tropospheric mapping function model GMF (Böhm et al., 2006a) vs. VMF1 (Böhm et al., 2006b), with the latter based on actual weather information; (b) increas-ing the temporal resolution of tropospheric linear horizontal
gradients in the north and east directions; (c) using three dif-ferent elevation cut-off angles, namely 3, 7 and 10◦; (d) mod-elling atmospheric loading effects; and (e) modmod-elling higher-order ionospheric effects. Table 2 summarizes the settings and models of solution variants selected for generating co-ordinate and troposphere products, which are supplemented with variant rationales.
Within the processing, we screened station coordinate re-peatabilities from weekly combined solutions and we iden-tified any problematic station for which the north/east/up residuals exceeded 15/15/30 mm or RMS of the north/east/up coordinate component exceeded values 10/10/20 mm. Such station was a priori excluded from the tropospheric product for the corresponding day. There were other standard control procedures within the processing when the individual sta-tion could have been excluded, e.g. if (a) less than 60 % of GNSS data were available, (b) code or phase data revealed poor quality, (c) station metadata were found inconsistent with data file header information (receiver, antenna and dome names, antenna eccentricities), and (d) phase residuals were too large for all satellites in the processing period, indicating a problem with the station. Tropospheric parameters were estimated practically without constraints (a prioriσ greater than 1 m); thus, parameter formal errors reflect the relative uncertainties of estimates. Usually, large errors indicate the lack of observations contributing to the parameter. During the tropospheric parameter evaluations, we applied the filter for exceeding formal errors of estimated parameters (ZTDσ
greater than 3 mm, normal cases stay below 1 mm).
3 Ensuring ZTD continuity during midnights
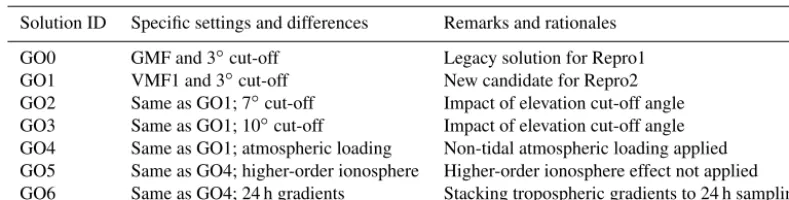
Table 2.GOP solution variants for the assessment of selected models and settings.
Solution ID Specific settings and differences Remarks and rationales
GO0 GMF and 3◦cut-off Legacy solution for Repro1 GO1 VMF1 and 3◦cut-off New candidate for Repro2 GO2 Same as GO1; 7◦cut-off Impact of elevation cut-off angle GO3 Same as GO1; 10◦cut-off Impact of elevation cut-off angle GO4 Same as GO1; atmospheric loading Non-tidal atmospheric loading applied GO5 Same as GO4; higher-order ionosphere Higher-order ionosphere effect not applied GO6 Same as GO4; 24 h gradients Stacking tropospheric gradients to 24 h sampling
to avoid misinterpretations (Bock et al., 2014). However, GNSS processing is commonly performed on a daily ba-sis according to adopted standards for data and product dis-semination. Thus far, EUREF analysis centres have pro-vided independent daily solutions, although precise IGS products are combined and distributed on a weekly ba-sis. Station coordinates are estimated on a daily basis and are later combined to form more stable weekly so-lutions. According to the EUREF analysis centre guide-lines (http://www.epncb.oma.be/_documentation/guideguide-lines/ guidelines_analysis_centres.pdf), weekly coordinates should be used to estimate tropospheric parameters on a daily ba-sis, but there are no requirements with which to guarantee the continuity of tropospheric parameters during midnights. Additionally, there are also discontinuities on a weekly basis, as neither daily coordinates nor hourly tropospheric param-eters are combined across midnights between corresponding adjacent GPS weeks.
The impact of a 3-day combination was previously studied when assessing the tropospheric parameters stemming from the second IGS reprocessing campaign 2016 in the GOP-TropDB database (Gy˝ori and Douša, 2016). We compared two global tropospheric products provided by the analysis centre CODE differing only in the procedure of combining tropospheric parameters from the daily original solutions. The first product, COF, was based purely on a single-day solution while the second product, COD, was based on a 3-day combination (Dach et al., 2014). Sub-daily statistics were calculated by comparing 2 h ZTD estimates from both products during 2013. There were no significant biases ob-served, but mean standard deviation estimated from differ-ences reached 0.8 mm in ZTD over a day and almost 1.8 mm close to the day boundaries. Similarly, a dispersion character-ized by 1σover all stations reached 0.5 mm for the former but up to 1.2 mm for the latter. Actual differences in ZTDs could even be larger, because this case used approximations leading to smooth low-resolution values close to the day boundaries. During the first GOP reprocessing, there was no way to guarantee tropospheric parameter continuity at midnight, as the troposphere was modelled by applying a piecewise con-stant model. In these cases, tropospheric parameters with a temporal resolution of 1 h were reported in the middle of the
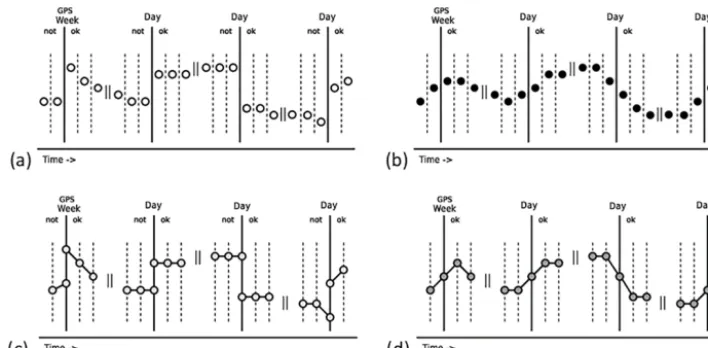
hour, as was originally estimated. In the second GOP repro-cessing, using again hourly estimates, we applied a piecewise linear model for the tropospheric parameters. The parameter continuities during midnights were not guaranteed implicitly, but only by an explicit combination of parameters at daily boundaries. For the combination procedure we used 3 con-secutive days while the tropospheric product stems from the middle day. The procedure is done again for 3 consecutive days shifted by 1 day. A similar procedure, using the piece-wise constant model, was applied for estimating weekly co-ordinates which aimed to minimize remaining effects in con-sistency at the breaks of GPS weeks (on Saturday at mid-night). The coordinates of the weekly solution correspond-ing to the middle day of a 3-day combination were fixed for the tropospheric parameter estimates. In the last step, we transformed the piecewise linear model to the piecewise constant model expressed in the middle of each hourly in-terval (HR:30), which was saved in the SINEX_TRO format to support the EUREF combination procedure requiring such sampling. The original piecewise linear parameter model was thus lost, and, to retain this information in the official prod-uct in the SINEX_TRO format, we additionally stored values for full hours (HR:00). Figure 2 summarizes four plots dis-playing tropospheric solutions with discontinuities in the left panels (a, c) and enforcing tropospheric continuities in the right panels (b, d). While the upper plots (a, b) display the piecewise constant model, bottom plots (c, d) indicate the so-lution representing the piecewise linear model. The GOP Re-pro1 implementation is thus represented by the Fig. 2a plot while the GOP Repro2 solution corresponds to Fig. 2d and, alternatively, Fig. 2b.
Figure 2.Charts of four variants of representation of tropospheric parameters in time (xaxis, with no specific dates). Right(b, d)and left (a, c)panels display estimates made with and without midnight combinations, respectively. Top(a, b)and bottom(c, d)panels display the piecewise constant and the linear model, respectively. Ok vs. not ok indicates a consistency vs. inconsistency, respectively, at daily or GPS week boundaries, the latter representing a specific case of the former.
in the bottom-right plot. Formal errors also became smooth near day boundaries, thus characterizing the contribution of data from both days and demonstrating that the concept be-haves as expected in its practical implementation.
4 Quality of the observations and impact on tropospheric gradients
Recently, we have developed a new interactive web inter-face to conduct tropospheric parameter comparisons in the GOP-TropDB (Gy˝ori and Douša, 2016), which is being pre-pared for the IGS Tropospheric Working Group web (http: //twg.igs.org/; Dousa et al., 2017). Using the interface, we observed large systematic tropospheric gradients during spe-cific years at several EPN stations. Generally, from GNSS data, we can only estimate total tropospheric horizontal gra-dients without being able to distinguish between dry and wet contributions. The former is mostly due to horizontal metry in atmospheric pressure, and the latter is due to asym-metry in the water vapour content. The latter is thus more variable in time and space than the former (Li et al., 2015). Regardless, mean gradients should be close to zero, whereas dry gradients may tend to point slightly more to the equa-tor, corresponding to latitudinal changes in atmosphere thick-ness (Meindl et al., 2004). Similarly, orography-triggered horizontal gradients can appear due to the presence of high mountain ranges in the vicinity of the station (Morel et al., 2015). Such systematic effects can reach the maximum sub-millimetre level, while a higher long-term gradient (i.e. that above 1 mm) is likely more indicative of issues with site in-strumentation, the environment or modelling effects. There-fore, in order to clearly identify these systematic effects, we
also compared our gradients with those calculated from the ERA-Interim.
It is beyond the scope of this paper to investigate in de-tail the correlation between tropospheric horizontal gradi-ents and effects such as antenna tracking performance. How-ever, we do observe a strong impact in the most extreme case identified when comparing gradients from the GNSS and the ERA-Interim for all EPN stations. Figure 4 shows the monthly means of differences in the north and east tropo-spheric gradients from the MALL station (Mallorca, Spain). These differences increase from 0 mm up to −4 mm and 2 mm for the east and north gradients, respectively, within the period of June 2003–October 2008. Such large monthly differences in GNSS and NWM gradients are not realistic and were attributed to data processing when long-term in-creasing biases dropped down to zero on 1 November 2008, immediately after the antenna and receiver were changed at the station. During the same period, yearly mean ZTD differ-ences in the ERA-Interim steadily changed from about 3 mm to about−12 mm and immediately dropped down to−2 mm in 2008 after the antenna change.
Figure 3.Four variants of representation of tropospheric parameters. Right(b, d)and left(a, c)panels display estimates with and without midnight combinations, respectively. Top(a, b)and bottom(c, d)panels display the piecewise constant and the piecewise linear model, respectively.
-4 -2 0 2 4
1996 1998 2000 2002 2004 2006 2008 2010 2012 2014
-20 -10 0 10 20
Tropospheric gradient bias [mm] Zenith total delay bias [mm]
MALL – monthly ZTD and gradient comparisons: GOP/Repro2 – ERA-Interim
ZTD E-GRD N-GRD
Figure 4.MALL station – monthly mean differences in tropospheric horizontal gradients with respect to the ERA-Interim.
depicts the severe loss of dual-frequency observations up to a 25◦elevation cut-off angle in the southeast direction (with
an azimuth of 90–180◦), which causes the tropospheric lin-ear gradient of approximately 5 mm to point in the opposite direction. Figure 10 also demonstrates that an increasing loss of second frequency observations appears to occur in the east (represented as black dots). The right-hand plot in this figure demonstrates that both of these effects fully disappeared af-ter the antenna was replaced on 30 October 2008 (DoY 304), resulting in the appearance of normal sky plot characteris-tics and a GLONASS constellation with one satellite provid-ing only sprovid-ingle-frequency observations (represented as black lines).
This situation demonstrates the high sensitivity of the es-timated gradients on data asymmetry, particularly at low-elevation angles. The systematic behaviour of these monthly mean gradients, their variations from independent data and a profound progress over time seem to be useful indicators of instrumentation-related issues at permanent GNSS stations.
It is also considered that gradient parameters can be a valu-able method as a part of ZTD data screening procedure (Bock et al., 2016).
Figure 5.Low-elevation tracking problems at the MALL station during the period of 2003–2008. From top-left to bottom-right: January 2002, 2004, 2006 and 2008 (courtesy of the EPN Central Bureau, ROB).
Figure 6.Sky plots before(a)and after(b)replacing the malfunctioning antenna at the MALL site (30 October 2008). Blue and green dots represent GPS and GLONASS (GLO), respectively, while black dots indicate single-frequency observations.
5 Assessment of reprocessing solutions
The GOP variants and reprocessing models were assessed by a number of criteria, including those of the internal eval-uations of repeatability of station coordinates, residuals at reference stations and the external validation of ZTDs and tropospheric horizontal gradients with data from numerical weather model reanalyses.
5.1 Repeatability of station coordinates
We used coordinate repeatability to assess the quality of models applied in GNSS analysis. To be as thorough as pos-sible, we not only assessed all GOP Repro2 variants but also assessed two GOP Repro1 solutions in order to discern im-provements within the new reanalyses. The two Repro1
solu-tions differed in their used reference frames and PCV mod-els: IGS05 and IGS08.
pro-Table 3.Comparison of GOP solution variants for north, east and up coordinate repeatability.
Solution North RMS East RMS Up RMS
(mm) (mm) (mm)
GOP Repro1/IGS05 3.01 2.40 5.08
GOP Repro1/IGS08 2.64 2.21 4.94
GO0 1.20 1.30 4.14
GO1 1.23 1.33 3.97
GO2 1.24 1.33 4.01
GO3 1.26 1.34 4.07
GO4 1.14 1.24 3.73
GO5 1.14 1.24 3.73
GO6 1.14 1.24 3.73
cessing software from version 5.0 to 5.2 and the enhanced quality of global precise orbit and earth orientation products. Various GOP Repro2 solutions were also used to as-sess the selected models. Variants GO0 and GO1 differ in their mapping functions (GMF vs. VMF1) used to project ZTDs into slant path delays. These comparisons demonstrate that vertical component repeatability improved from 4.14 to 3.97 mm, whereas horizontal component repeatability de-creased slightly. By increasing the elevation cut-off angle from 3 to 7◦(GO2) and 10◦(GO3), we observed a slight in-crease in RMS from repeatability of all coordinates. This can be explained by the positive impact of low-elevation observa-tions on the decorrelation of height and tropospheric param-eters, despite the fact that applied models (such as elevation-dependent weighting, PCVs, multipath) are still not optimal for including observations at very low-elevation angles. On the other hand, it should be noted that the VMF1 mapping function is particularly tuned to observations at 3◦elevation
angle, which leads to biases at higher elevation angles (Zus et al., 2015).
The GO4 solution represents an official GOP contribution to EUREF combined products. It is identical to the variant GO1 but applies a non-tidal atmospheric loading. Steigen-berger et al. (2009) discussed the importance of applying non-tidal atmospheric loading corrections together with a precise a priori ZHD (zenith hydrostatic delay) model. It has been concluded that using mean, or slowly varying, empir-ical pressure values for estimating a priori ZHD instead of true pressure values results in a partial compensation of at-mospheric loading effects, which is the case of the GO1 so-lution. A positive 10 % improvement in height repeatability was observed for the GO4 solution. Our improvement was slightly lower than in a global scope reported by Dach et al. (2011) with an improvement of 10–20 % over all sta-tions. As the effect depends on the selected stations, a slightly higher impact in a global scale might be attributed to the sta-tion distribusta-tion, particularly differences in terms of latitude and altitude.
No impact was observed from the higher-order iono-spheric effects (GO4 vs. GO5) in terms of coordinate re-peatability. As the effect is systematic within the regional network (Fritsche et al., 2005), it was mostly eliminated by using reference stations in the domains of interest. The com-bination of tropospheric horizontal gradients from 6 to 24 h time resolution (GO4 vs. GO6), using the piecewise linear model, had a negligible impact on the repeatability of station coordinates too.
5.2 Reference frame – residuals at fiducial stations
The terrestrial reference frame (Altamimi et al., 2001) is a re-alization of a geocentric system of coordinates used by space geodetic techniques. To avoid a degradation of GNSS prod-ucts, differential GNSS analysis methods require a proper referencing of the solution to the system applied in the gen-eration of precise GNSS orbit products. For this purpose, we often use the concept of fiducial stations with precise coor-dinates well known in the requested system. Such stations are used to define the geodetic datum while their actual po-sition can be readjusted by applying a condition minimizing coordinate residuals. No station is able to guarantee a stable position and unchanged instrumentation during the whole re-processing period. Thus a set of about 50 stations, with more than 100 time periods for reference coordinates, was care-fully prepared for datum definition in the GOP reprocess-ing. An iterative procedure was then applied for every day by comparing a priori reference coordinates with actually es-timated ones and excluding fiducial stations exceeding dif-ferences by 5, 5 and 15 mm in the north, east and up compo-nents.
modelling of the troposphere. We believe the main contribu-tion stems from the insufficiencies in modelling of wet tropo-spheric delay, as the effect has the most pronounced seasonal signal within the GNSS data analysis. Additionally, the es-timated station ZTD parameters and height are difficult to decorrelate. In the next section, the strong seasonal variation in comparing zenith total delays estimated from GNSS and NWM data is clearly visible.
5.3 Zenith total delays
We compared all reprocessed tropospheric parameters with respect to independent data from the ERA-Interim global re-analysis (Dee et al., 2011) provided by the European Cen-tre for Medium-Range Weather Forecasts from 1969 to the present. For the period of 1996–2014, we calculated tropo-spheric parameters (namely ZTD and tropotropo-spheric horizon-tal linear gradients) from the NWM for all EPN stations us-ing the GFZ (German Research Centre for Geosciences) ray-tracing software (Zus et al., 2014). The comparison of tro-pospheric parameters was performed by applying the linear interpolation of GNSS parameters to the original NWM 6 h representation, using the GOP-TropoDB (Gy˝ori and Douša, 2016). For monthly statistics discussed in this section, we ap-plied an iterative procedure for outlier detection using the 3σ
criteria calculated from the compared ZTD or gradient dif-ferences.
Table 4 summarizes comparisons of GNSS ZTDs, and tropospheric horizontal gradients, from all GOP processing variants with those obtained from the ERA-Interim. Mean biases and standard deviations were first calculated for each station and each month and then the mean and standard devi-ation of these values were computed, characterizing disper-sions of all statistical values over the ensemble of stations.
The results in the table indicate a mean ZTD bias
−1.8 mm for all comparisons (GNSS–NWM) suggesting ZTDs achieved from the NWM reanalysis are drier than those obtained from GNSS reprocessing. Similar biases have been observed for all other European GNSS reprocessing products during the period of 1996–2014 (Pacione et al.,
2017). On the other hand, when processing the ERA-Interim using two different software and methodologies within the GNSS4SWEC Benchmark campaign (Douša et al., 2016) during May and June of 2013 in Central Europe, and by their comparison to two GNSS reference products based on different processing methods, we observed bias differences within±0.4 mm in ZTD. As neither GNSS nor NWM is able to sense the troposphere with an absolute accuracy better than the bias that we observed, we cannot make any conclu-sion, except for its independence from the GNSS software. A mixture of common processing aspects such as the scale of the GNSS network, applied tropospheric model, precise or-bit product and others could still cause such small biases in GNSS analysis at least.
Comparing the results of the official GOP Repro2 solution (GO4) to those of the legacy solution (GO0) demonstrates an overall improvement of 9 % in terms of accuracy, which cor-responds to a similar comparison between the EUREF Re-pro1 and Repro2 products (Pacione et al., 2017). The im-provement is assumed to be even larger (indicated by the co-ordinate repeatability) since the comparison of tropospheric parameters is limited by a lower quality of reference prod-ucts derived from NWM data (Douša et al., 2016; Kaˇcmaˇrík et al., 2017; Bock and Nuret, 2009).
Degrada-Table 4.Statistics (bias and standard deviations) of ZTD and tropospheric gradients from the seven reprocessing variants compared to those obtained from the ERA-Interim NWM reanalysis. In addition to the statistics, the 1σ range over the ensemble of stations is provided.
Solution ZTD bias ZTD SD EGRD bias EGRD SD NGRD bias NGRD SD
(mm) (mm) (mm) (mm) (mm) (mm)
GO0 −1.5±2.1 8.8±2.0 −0.04±0.08 0.39±0.10 +0.01±0.09 0.43±0.12 GO1 −2.0±2.1 8.3±2.2 −0.04±0.08 0.39±0.10 +0.01±0.09 0.42±0.13 GO2 −1.9±2.2 8.4±2.2 −0.05±0.10 0.41±0.10 +0.00±0.12 0.45±0.12 GO3 −1.8±2.3 8.5±2.1 −0.08±0.13 0.43±0.11 −0.01±0.14 0.49±0.12 GO4 −1.8±2.4 8.1±2.1 −0.04±0.09 0.38±0.10 +0.00±0.09 0.40±0.12 GO5 −1.8±2.4 8.1±2.1 −0.05±0.09 0.38±0.10 +0.01±0.08 0.40±0.12 GO6 −1.8±2.4 8.2±2.1 −0.04±0.08 0.29±0.06 +0.01±0.09 0.28±0.06
tion in ZTD precision was also observed when the elevation cut-off angle was raised from 3 to 7◦(GO2) or 10◦(GO3). No impacts on ZTD were visible from additional modelling of high-order ionospheric effects (GO5) or from stacking of 6 h horizontal gradients into daily piecewise linear estimates (GO6).
Figure 8 displays the time series of statistics from compar-isons of the GOP official ZTD product (GO4) with respect to the results of the ERA-Interim reanalysis. Mean bias and standard deviation were derived from the monthly statistics of the 6-hourly GNSS–ERA-Interim ZTD differences. A 1σ
range of the mean values, represented by error bars, are ad-ditionally derived from all stations on a monthly basis. Al-though the time series show homogeneous results over the given time span, a small increase in the mean standard devia-tion over time likely corresponds with the increasing number of EPN sites, rising from approximately 30 to 300. The early years (1996–2001) also display a worse overall agreement in the 1σ range of mean values over all stations, which can be attributed to the varying quality of historical observations and precise orbit products. The mean bias varies from −3 to 1 mm during the period of 1996–2014, with a long-term mean of−1.8 mm (Table 4). The long-term mean is also rela-tively small compared to the ZTD mean 1σrange of 3–5 mm. 5.4 Tropospheric horizontal linear gradients
Additional GNSS signal delay due to the tropospheric gra-dients were developed by MacMillan (1995). The complete tropospheric model for the line-of-sight delay (1DT)
us-ing the parameters zenith hydrostatic delay, zenith wet de-lay (ZWD), and first-order horizontal tropospheric gradients
GNandGE, all expressed in units of length, is described as follows:
1DT=mfh(e)ZHD+mfw(e)ZWD
+mfg(e)cot(e)[GNcos(A)+GEsin(A)], (1) whereeandAare observation elevation and azimuth angles and mfh, mfw, mfg are hydrostatic, wet and gradient
map-ping functions, respectively, representing the projection from
an elevation to the zenith. Horizontal gradients should opti-mally represent a ZTD change in north and east directions characterized by termsGNcot(e)andGEcot(e)in the equa-tion. However, the gradients need to be parameterized prac-tically with respect to observation elevation angle instead of the distance theoretically applicable to the tropospheric ef-fect at various elevation angles. The interpretation of the tro-pospheric horizontal gradients in the Bernese software repre-sents the north and east components of angle applied for the tilting the zenith direction in the mapping function with gra-dients representing (in unit of length) the tilting angle multi-plied by the delay in zenith (Meindl et al., 2004).
Similarly as in the case of the ZTD and coordinate as-sessment, Table 4 shows that tropospheric gradients became worse when raising the elevation cut-off angle from 3 to 7◦ (GO2) or 10◦ (GO3). Mean standard deviations of the GO2 and GO3 solutions increased by 8 and 12 %, respec-tively, which is valid for the whole period of monthly time series (not shown). No significant differences in temporal variations of mean biases of the north and east tropospheric gradient variants were identified while they shared a higher variability during the years 1996–2001. No impact of mod-elling of high-order ionospheric effects (GO5) was observed. Statistics of GO4 and GO6 solutions compared to the ERA-Interim revealed that standard deviations dropped from 0.38 to 0.28 mm and from 0.40 to 0.29 mm for the east and north gradients, respectively. The worse performance of the GO4 solution is attributed to the fact that tropospheric horizontal gradients were estimated with a 6 h sampling interval using the piecewise linear model by applying practically no abso-lute or relative constraints. In such cases, increased corre-lations of the gradients with other parameters can cause in-stabilities in processing certain stations at specific times; the gradients absorb some remaining errors in the GNSS anal-ysis model. The mean biases of the tropospheric gradients are considered to be negligible, but it was demonstrated in Sect. 4 that some large systematic effects were indeed dis-covered and attributed to the quality of GNSS signal track-ing.
Figure 9.Monthly means of bias and standard deviation of tropospheric horizontal north (N-GRD) and east (E-GRD) gradients compared to those obtained by the ERA-Interim. Note that similar products are almost superposed. Error bars indicate standard errors of mean values over all compared stations plotted from the zeroyaxis to emphasize seasonal variations and trends. Error bars are displayed for north gradients only; however, they are representative for the east gradients too.
gradients in the north and east directions. Two solutions are highlighted in order to demonstrate the impact of different parameter temporal resolutions: a 6 h resolution is used for GO4 and a 24 h resolution is used for GO6. Seasonal varia-tions are mainly pronounced when observing mean standard deviations (top plot), whereas gradual improvement is more pronounced for mean biases (bottom plot). The reduction of the initial mean biases in horizontal gradients, and the cor-responding 1σ ranges over the values from the ensemble of stations, can be attributed to the improved availability and quality of low-elevation observation tracking. Elevation cut-off angles for collecting GNSS observations were initially
configured station by station, ranging from 0 to 15◦, until 2008 when the elevation cut-off angle 0◦was recommended for all the stations.
dis-Table 5.Median, minimum (min) and maximum (max) values of total ZTD biases and standard deviation (SD) over all stations. Units are millimetres.
Compared ZTD bias ZTD bias ZTD bias ZTD SD ZTD SD ZTD SD
variants median min max median min max
GO1–GO0 −0.36 −1.52 +0.70 2.01 0.69 3.82
GO2–GO1 +0.03 −0.81 +1.66 0.66 0.15 1.29
GO3–GO1 +0.03 −2.22 +2.66 1.10 0.31 2.04
GO4–GO1 +0.05 −3.29 +5.55 1.37 0.68 4.72
GO5–GO4 −0.02 −0.31 +0.07 0.07 0.04 0.30
GO6–GO4 −0.02 −0.23 +0.16 1.24 0.76 2.46
crepancy indicates serial correlations in errors which, among others, stem from the errors in precise products and models. Significant improvements, however, indicate possible corre-lations between tropospheric gradients and other estimated parameters, such as ambiguities, height and zenith total de-lays, and suggest a careful handling, particularly when ap-plying a sub-daily temporal resolution.
5.5 Spatial and temporal ZTD analysis
We performed spatial and temporal analyses of all processed variants in order to assess the impact of different settings on tropospheric products. Zenith tropospheric delays from all variants were compared in such a way to enable the as-sessment of the impact of any single processing change: (1) GO1–GO0 for mapping function and a more precise a priori ZHD model, (2) GO2–GO1 and GO3–GO1 for differ-ent elevation cut-off angle, (3) GO4–GO1 for non-tidal at-mospheric corrections, (4) GO5–GO4 for higher-order iono-spheric corrections and (5) GO6–GO4 for temporal resolu-tion tropospheric horizontal gradients. Staresolu-tion-specific be-haviour will be studied in future.
Geographical maps of spatially distributed biases and stan-dard deviations in ZTDs from all compared variants for the whole network are shown in Figs. 10 and 11. Additionally, median, minimum and maximum values of station-wise to-tal statistics are provided in Table 5. Figures 12, 13 and 14 illustrate ZTD statistics with respect to the station latitude, ellipsoidal height and time, respectively.
Using the VMF1 mapping function together with precise a priori ZHD from VMF1 instead of the GMF and GPT mod-els, respectively (see GO1 vs. GO0), we observe biases rang-ing from−1.52 to 0.70 mm, the median value of−0.36 mm, and, according to Table 5, all biases indicated a moderate lat-itudinal dependence, see Fig. 12. Standard deviations range from 0.69 to 3.82 mm in Table 5, with a marked increase along with the latitude, Fig. 12, indicating the GPT performs worse at higher latitudes. This is consistent with Steigen-berger et al. (2009) demonstrating a partial compensation of the atmospheric loading effect by using the GPT model. In cases where the atmospheric loading effect is not corrected for, the errors are mostly assimilated to the zenith total delay
parameters if station coordinates are fixed on a weekly basis. Additionally, Fig. 14 shows that the standard deviation grows with time, which might be explained by the increased number of low-elevation observations with time in the EUREF Per-manent Network as demonstrated for the WTZR (Wettzell) station in Fig. 15.
Biases obtained from the comparison of different elevation cut-off angles, i.e. variants 3 to 7◦(GO2–GO1) and 3 to 10◦ (GO3–GO1), range from−0.81 to 1.66 mm and from−2.22 to 2.66 mm, respectively, and standard deviations range from 0.15 to 1.29 mm and from 0.31 to 2.04 mm, see Table 5. Gen-erally, the impact of the different elevation cut-off angle does not reveal any biases with respect to the latitude (Fig. 12) or the station height (Fig. 13). As expected, the impact is larger for the GO3–GO1 differences and particularly affected some stations. Yearly biases exceeding±2.5 mm were iden-tified for the BELL, DENT, MLVL, MOPS, POLV RAMO and SBG2 stations. Temporal dependencies in the GO2–GO1 and GO3–GO1 comparisons, Fig. 14, show that the scatter of station-specific biases steadily grows in time, which is as-sumed to be related to the higher availability of low-elevation observations. On the other hand, a small impact is observed for the standard deviation compared to the other studied ef-fects. This indicates the elevation cut-off angle affects mainly ZTD biases, which has been also reported by Ning and El-gered (2012).
Figure 10.Geographic visualization of biases from inter-comparisons of the GOP second reprocessing variants.
Figure 11.Geographic visualization of standard deviations from inter-comparisons of the GOP second reprocessing variants.
similar degradation in terms of standard deviations has not been observed for other comparison variants, it can be related to the quality of pressure data used to compute atmospheric loading.
The impact of the higher-order ionospheric effect (GO5– GO4) is negligible at all stations, demonstrating total statis-tics for all stations within ±0.3 mm when applying the y
-3 -2 -1 0 1 2 3 4 5
20 30 40 50 60 70 80
ZTD bias/SD [mm]
Latitude [degree]
GO1 vs. GO0
-3 -2 -1 0 1 2 3 4 5
20 30 40 50 60 70 80
ZTD bias/SD [mm]
Latitude [degree]
GO2 vs. GO1
-3 -2 -1 0 1 2 3 4 5
20 30 40 50 60 70 80
ZTD bias/SD [mm]
Latitude [degree]
GO3 vs. GO1
-3 -2 -1 0 1 2 3 4 5
20 30 40 50 60 70 80
ZTD bias/SD [mm]
Latitude [degree]
GO4 vs. GO1
-0.5 -0.4 -0.3 -0.2 -0.1 0 0.1 0.2 0.3 0.4 0.5
20 30 40 50 60 70 80
ZTD bias/SD [mm]
Latitude [degree]
GO5 vs. GO4
-3 -2 -1 0 1 2 3 4 5
20 30 40 50 60 70 80
ZTD bias/SD [mm]
Latitude [degree]
GO6 vs. GO4
Figure 12.Dependence of ZTD biases (blue) and standard deviations (red) from inter-comparisons of the GOP second reprocessing solution variants on station latitude. Note the differentyrange for the GO5 vs. GO4 comparison.
-3 -2 -1 0 1 2 3 4 5
0 1 2 3
ZTD bias/SD [mm]
Ellipsoidal height [km]
GO1 vs. GO0
-3 -2 -1 0 1 2 3 4 5
0 1 2 3
ZTD bias/SD [mm]
Ellipsoidal height [km]
GO2 vs. GO1
-3 -2 -1 0 1 2 3 4 5
0 1 2 3
ZTD bias/SD [mm]
Ellipsoidal height [km]
GO3 vs. GO1
-3 -2 -1 0 1 2 3 4 5
0 1 2 3
ZTD bias/SD [mm]
Ellipsoidal height [km]
GO4 vs. GO1
-0.5 -0.4 -0.3 -0.2 -0.1 0 0.1 0.2 0.3 0.4 0.5
0 1 2 3
ZTD bias/SD [mm]
Ellipsoidal height [km]
GO5 vs. GO4
-3 -2 -1 0 1 2 3 4 5
0 1 2 3
ZTD bias/SD [mm]
Ellipsoidal height [km]
GO6 vs. GO4
Figure 13.Dependence of ZTD biases (blue) and standard deviations (red) from inter-comparisons of the GOP second reprocessing solution variants on station ellipsoidal height. Note the differentyrange for the GO5 vs. GO4 comparison.
in Fig. 12 as well as a temporal variability showing peaks up to ±0.4 mm, Fig. 14. Both dependencies are due to the changing magnitude of ionospheric corrections, generally in-creasing towards the equator along with quasi-periodic cy-cles of the solar magnetic activity, reaching peaks around years 2001 and 2014.
The impact of stacking tropospheric gradients from 6 h to daily estimates (GO6–GO4) is almost negligible in terms of biases which stay below±1 mm, Table 5 and Fig. 10.
-3 -2 -1 0
1998 2003 2008 2013
ZTD bias/SD [mm]
Year
-0.5 -0.4 -0.3 -0.2 -0.1
1998 2003 2008 2013
ZTD bias/SD [mm]
Year
-3 -2 -1 0
1998 2003 2008 2013
ZTD bias/SD [mm]
Year
Figure 14.Dependence of ZTD biases (blue), mean biases (unfilled black circles), standard deviations (red) and mean standard deviations (filled black circles) from inter-comparisons of the GOP second reprocessing solution variants per year. Note the differentyrange for the GO5 vs. GO4 comparison.
0 2000 4000 6000 8000 10 000 12 000 14 000 16 000
1996 1997 1998 1999 2000 2001 2002 2003 2004 2005 2006 2007 2008 2009 2010 2011 2012 2013 2014 2015
Number of observations
WTZR station – availability of low-elevation observations
< 5 deg < 10 deg < 15 deg < 20 deg < 30 deg
Figure 15.Availability of observations at low-elevation angles (below 5, 10, 15, 20 and 30◦) for the WTZR station.
time, see Fig. 9, when supported with an increased number of available low-elevation observations.
6 Impact of variants on long-term ZTD trend estimates
We assessed the impact of solution variants on long-term ZTD trend estimates by analysing 172 EUREF stations pro-viding a time series of data longer than 10 years. For each sta-tion, the trend analysis was performed without any data ho-mogenization or outlier rejection as our focus was only on as-sessing the impact of solution variants on the trend estimates. The ZTD trends were estimated using the least squares re-gression method applied on the model (Weatherhead et al., 1998):
Yt=µ+βXt+St+εt, (2)
whereµis the constant term of the model;βXtis the
lin-ear trend function, withβ representing the trend magnitude;
Strepresents the term modelled by the sine wave function of
timeXtincluding annual, second harmonics and daily
varia-tions; and finallyεtis the noise in the data.
-0.2 -0.1 0 0.1 0.2 0.3 0.4 0.5
BOR1 GRAS GRAZ JOZE MATE METS ONSA POTS REYK WARE WTZR ZIMM
Z
T
D
t
re
n
d
[
m
m
y
r
–
1]
GO0 GO1 GO2 GO3 GO4 GO5 GO6
Figure 16.Long-term ZTD trend estimates and their formal errors (error bars) for all processing variants.
Table 6.Mean statistics of ZTD trend differences estimated between variants for 172 stations. Units are mm year−1.
Statistics GO1–GO0 GO2–GO1 GO3–GO1 GO4–GO1 GO5–GO4 GO6–GO4
Min −0.118 −0.141 −0.308 −0.547 −0.017 −0.038
Max 0.045 0.179 0.331 0.452 0.031 0.036
Mean 0.036 0.018 0.012 −0.048 0.007 0.001
SD 0.081 0.160 0.319 0.499 0.024 0.037
Table 6 summarizes the statistics of estimated trend dif-ferences at all 172 stations, always between particular vari-ants as defined in Sect. 5.5. Interestingly, the most signif-icant impact is observed due to the non-tidal atmospheric loading effects reaching differences below±0.55 mm year−1 in ZTD trends for some extreme cases from the ensemble of 172 stations and an overall 1σ scatter of 0.50 mm year−1 from the ensemble of stations. Changes in elevation cut-off angle, particularly from 3 to 10◦, also reveal a significant impact characterized by differences below±0.34 mm year−1 and the scatter of 0.32 mm year−1. The impact of map-ping function on trend estimates remains small, with a maximum difference of 0.12 mm year−1 and the 1σ scat-ter below 0.08 mm year−1, while other strategy changes, due to time resolution of tropospheric gradients and higher-order ionospheric effects, remain negligible, always below
±0.04 mm year−1for all 172 stations, with the scatter of the
same magnitude. All mean biases over differences also stay below 0.05 mm year−1. These results are consistent with a study performed by Ning and Elgered (2012) spanning a broader span of cut-off angles. They demonstrated a signif-icant impact of this parameter on integrated water vapour trend estimates.
Finally, we selected 12 stations available over the entire second reprocessing period. All estimated trends are dis-played in Fig. 16, ranging from −0.05 to 0.38 mm year−1. Consistent with the overall results reported in Table 5, the most significant impact for the selected 12 stations is ob-served in the change of elevation cut-off angle (GO2 and
GO3 vs. GO1) and atmospheric loading (GO4 vs. GO1) when reaching differences up to 0.1 mm year−1in estimated
ZTD trends. Impacts of other strategies are generally below 0.05 mm year−1– variants GO4, GO5 and GO6 are very sim-ilar, but not consistent again with GO1, meaning the non-tidal atmospheric loading has a significant impact on trend estimates for selected stations with the longest data time se-ries.
7 Conclusions
In this paper, we present results of the new GOP reanalysis of all stations within the EUREF Permanent Network during the period of 1996–2014. This reanalysis was completed during the second EUREF reprocessing to support the realization of a new European Terrestrial Reference System. In the second reprocessing, we focused on analysing a new product – the GNSS tropospheric parameter time series for applications to climate research. To achieve this goal, we improved our strat-egy for combining tropospheric parameters during midnights and week breaks. We also performed seven solution variants to study optimal troposphere modelling; we assessed each of these variants in terms of their coordinate repeatability by us-ing internal evaluations of the applied models and strategies. We also compared tropospheric ZTD and tropospheric hor-izontal gradients with independent evaluations obtained by numerical weather reanalysis via the ERA-Interim.
verti-ing tropospheric horizontal linear gradients improves coordi-nates’ repeatability, 6 h sampling without any absolute or rel-ative constraints revealed a loss of stability due to their corre-lations with other parameters. On the other hand, 24 h piece-wise linear gradients did not indicate a worse repeatability of coordinates estimates. For saving the time needed for the processing of 4 times fewer gradient parameters, we could recommend using the unconstrained 24 h piecewise model for the modelling of the first-order tropospheric asymmetry.
The impact of processing variants on long-term ZTD trend estimates was assessed at 172 EUREF stations with time series longer than 10 years. The most significant impact was observed due to the non-tidal atmospheric loading ef-fect reaching differences below ±0.55 mm year−1 in ZTD trends for some extreme cases from the ensemble of 172 sta-tions. Changes in elevation cut-off angle, particularly from 3 to 10◦, also revealed a significant impact reaching dif-ferences below ±0.35 mm year−1. The change of mapping
function was observed to be rather small, with a maximum difference of 0.12 mm year−1, while other strategy changes, due to time resolution of tropospheric gradients and higher-order ionospheric effects, remained negligible, always below
±0.04 mm year−1for all 172 stations.
Assessing the tropospheric horizontal gradients with re-spect to the ERA-Interim reanalysis data revealed some long-term systematic behaviour linked to degradation in antenna tracking quality. We presented an extreme case at the Mal-lorca station, in which gradients systematically increased up to 5 mm from 2003 to 2008 while pointing in the direction of prevailing observations at low-elevation angles. However, these biases disappeared when the malfunctioning antenna was replaced. More cases similar to this, although less ex-treme, have indicated that estimated tropospheric gradients are extremely sensitive to the quality of GNSS antenna track-ing, thus suggesting that these gradients can be used to iden-tify problems with GNSS data tracking in historical archives. One of the main difficulties faced during the second re-processing was that of the quality of the historical data, which contains a large variety of problems. We removed data that caused significant problems in network processing when these could not be pre-eliminated from normal equations
dur-the second EUREF reprocessing, including individual contri-butions, EUREF combinations, time-series analyses and co-ordinates, and independent evaluations of tropospheric pa-rameters.
Data availability. All processed reprocessed GNSS data are
avail-able at ftp://epncb.oma.be/pub/obs/, where they are maintained by the historical EPN archive of the Royal Observatory of Belgium. The official second GOP EUREF reprocessing solution (GO4) in SINEX and SINEX_TRO formats are publicly available at ftp://igs.bkg.bund.de/EPNrepro2/products/. Additionally, the tropo-spheric parameters for all EPN stations are available via the GOP-TropDB download service at http://www.pecny.cz/GOP-GOP-TropDB/ data-download.
The Supplement related to this article is available online at https://doi.org/10.5194/amt-10-3589-2017-supplement.
Author contributions. JD and PV performed the second GOP
Euro-pean GNSS reprocessing. ME performed a long-term trend analysis for all the variants of the reprocessing. JD prepared the manuscript with the support of PV and ME, who particularly contributed to Sect. 6. All authors approved the final manuscript before its sub-mission.
Competing interests. The authors declare that they have no conflict
of interest.
Special issue statement. This article is part of the special issue
“Ad-vanced Global Navigation Satellite Systems tropospheric products for monitoring severe weather events and climate (GNSS4SWEC) (AMT/ACP/ANGEO inter-journal SI)”. It is not associated with a conference.
Acknowledgements. The reprocessing effort and its evaluations
the Czech Republic (projects LD14102 and LO1506). We thank two anonymous reviewers and Olivier Bock for their comments and suggestions which helped us to improve the manuscript.
Edited by: Olivier Bock
Reviewed by: two anonymous referees
References
Altamimi, Z., Angermann, D., Argus, D., Blewitt, G., Boucher, C., Chao, B., Drewes, H., Eanes, R., Feissel, M., Ferland, R., Her-ring, T., Holt, M., Johannson, J., Larson, K., Ma, C., Manning, J., Meertens, C., Nothnagel, A., Pavlis, E., Petit, G., Ray, J., Ries, J., Scherneck, H.-G., Sillard, P., and Watkins, M.: The terres-trial reference frame and the dynamic Earth, EOS, Transacttions, American Geophysical Union, 82, 273–279, 2001.
Baldysz, Z., Nykiel, G., Araszkiewicz, A., Figurski, M., and Szafranek, K.: Comparison of GPS tropospheric delays derived from two consecutive EPN reprocessing campaigns from the point of view of climate monitoring, Atmos. Meas. Tech., 9, 4861–4877, https://doi.org/10.5194/amt-9-4861-2016, 2016. Bevis, M., Businger, S., Chiswell, S., Herring, T. A., Anthes, R. A.,
Rocken, C., and Ware R. H.: GPS Meteorology: Mapping Zenith Wet Delays onto Precipitable Water, J. Appl. Meteorol., 33, 379– 386, https://doi.org/10.1175/1520-0450, 1994.
Bock, O. and Nuret, M.: Verification of NWP model analyses and radiosonde humidity data with GPS precipitable water vapor estimates during AMMA, Weather Forecast., 24, 1085–1101, https://doi.org/10.1175/2009WAF2222239.1, 2009.
Bock, O., Willis, P., Wang, J., and Mears, C.: A high-quality, homogenized, global, long-term (1993–2008) DORIS precipitable water data set for climate monitoring and model verification, J. Geophys. Res.-Atmos., 119, 7209–7230, https://doi.org/10.1002/2013JD021124, 2014.
Bock, O., Bosser, P., Pacione, R., Nuret, M., Fourrié, N., and Par-racho, A.: A high-quality reprocessed ground-based GPS dataset for atmospheric process studies, radiosonde and model evalua-tion, and reanalysis of HyMeX Special Observing Period, Q. J. Roy. Meteor. Soc., 142, 56–71, https://doi.org/10.1002/qj.2701, 2016.
Böhm, J., Niell, A. E., Tregoning, P., and Schuh, H.: 2006, Global Mapping Functions (GMF): A new empirical mapping function based on numerical weather model data, Geophys. Res. Lett., 33, L07304, https://doi.org/10.1029/2005GL025546, 2006a. Böhm, J., Werl, B., and Schuh, H.: Troposphere mapping
func-tions for GPS and very long baseline interferometry from European Centre for Medium-Range Weather Forecasts op-erational analysis data. J. Geophys. Res., 111, B02406, https://doi.org/10.1029/2005JB003629, 2006b.
Bruyninx, C., Habrich, H., Söhne, W., Kenyeres, A., Stangl, G., and Völksen, C.: Enhancement of the EUREF Permanent Network Services and Products, Geodesy for Planet Earth, IAG Symposia Series, 136, 27–35, https://doi.org/10.1007/978-3-642-20338-1_4, 2012.
Dach, R., Böhm, J., Lutz, S., Steigenberger, P., and Beutler, G.: Evaluation of the impact of atmospheric pressure loading modeling on GNSS data analysis, J. Geodynam., 85, 75–91, https://doi.org/10.1007/s00190-010-0417-z, 2011.
Dach, R., Schaer, S., Lutz, S., Baumann, C., Bock, H., Orliac, E., Prange, L., Thaller, D., Mervart, L., Jäggi, A., Beutler, G., Brock-mann, E., Ineichen, D., Wiget, A., Weber, G., Habrich, H., Söhne, W., Ihde, J., Steigenberger, P., and Hugentobler, U.: CODE IGS Analysis Center Technical Report 2013, edited by: Dach, R. and Jean, Y., IGS 2013 Tech. Rep., 21–34, 2014.
Dach, R., Lutz, S., Walser, P., and Fridez, P. (Eds.): Bernese GNSS Software Version 5.2. User manual, Astronomical Institute, Uni-versity of Bern, Bern Open Publishing, 2015.
Dee, D. P., Uppala, S. M., Simmons, A. J., Berrisford, P., Poli, P., Kobayashi, S., Andrae, U., Balmaseda, M. A., Balsamo, G., Bauer, P., Bechtold, P., Beljaars, A. C. M., van de Berg, L., Bid-lot, J., Bormann, N., Delsol, C., Dragani, R., Fuentes, M., Geer, A. J., Haimberger, L., Healy, S. B., Hersbach, H., Hólm, E. V., Isaksen, L., Kållberg, P., Köhler, M., Matricardi, M., McNally, A. P., Monge-Sanz, B. M., Morcrette, J.-J., Park, B.-K., Peubey, C., de Rosnay, P., Tavolato, C., Thépaut, J.-N., and Vitart, F.: The ERA-Interim reanalysis: Configuration and performance of the data assimilation system, Q. J. Roy. Meteorol. Soc., 137, 553– 597, https://doi.org/10.1002/qj.828, 2011.
Douša, J. and Václavovic, P.: Results of GPS Reprocess-ing campaign (1996–2011) provided by Geodetic ob-servatory Pecný, Geoinformatics, FCE CTU, 9, 77–89, https://doi.org/10.14311/gi.9.7, 2012.
Douša, J., Dick, G., Kacmarík, M., Brožková, R., Zus, F., Brenot, H., Stoycheva, A., Möller, G., and Kaplon, J.: Benchmark campaign and case study episode in central Europe for de-velopment and assessment of advanced GNSS tropospheric models and products, Atmos. Meas. Tech., 9, 2989–3008, https://doi.org/10.5194/amt-9-2989-2016, 2016.
Douša, J., Böhm, O., Byram, S., Hackman, C., Deng Z., Zus, F., Dach, R., and Steigenberger, P.: Evaluation of GNSS reprocess-ing tropospheric products usreprocess-ing GOP-TropDB, IGS Workshop 2016, Sydney, 8–12 February 2017, available at: http://www.igs. org/assets/pdf/W2016-PS0303-Dousa.pdf, last access: Septem-ber 2017 2017.
Dow, J. M., Neilan, R. E., and Rizos, C.: The International GNSS Service in a changing landscape of Global Navigation Satellite Systems, J. Geod., 83, 191–198, https://doi.org/10.1007/s00190-008-0300-3, 2009.
Fritsche, M., Dietrich, R., Knofel, C., Rlke, A., Vey, S., Rothacher, M., and Steigenberger, P.: Impact of higher-order ionospheric terms on GPS estimates. Geophys. Res. Lett., 32, L23311, https://doi.org/10.1029/2005GL024342, 2005.
Guerova, G., Jones, J., Douša, J., Dick, G., de Haan, S., Pottiaux, E., Bock, O., Pacione, R., Elgered, G., Vedel, H., and Bender, M.: Review of the state of the art and future prospects of the ground-based GNSS meteorology in Europe, Atmos. Meas. Tech., 9, 5385–5406, https://doi.org/10.5194/amt-9-5385-2016, 2016. Gy˝ori, G. and Douša, J.: GOP-TropDB developments for
tropo-spheric product evaluation and monitoring – design, functionality and initial results, IAG Symposia Series, Springer, 143, 595–602, 2016.
IERS Conventions: Gérard, P., and Luzum, B. (Eds.): IERS Techni-cal Note No. 36, Frankfurt am Main, Verlag des Bundesamts für Kartographie und Geodäsie, 179 pp., 2010.
ents from multiconstellation GNSS observations, Geophys. Res. Lett., 42, 4173–4181, https://doi.org/10.1002/2015GL063856, 2015.
MacMillan, D. S.: Atmospheric gradients from very long base-line interferometry observations, Geophys. Res. Lett., 22, 1041– 1044, https://doi.org/10.1029/95GL00887, 1995.
Meindl, M., Schaer, S., Hugentobler, U., and Beutler, G.: Tropo-spheric Gradient Estimation at CODE: Results from Global So-lutions, J. Meteorol. Soc. Jpn., 82, 331–338, 2004.
Morel, L., Pottiaux, E., Durand, F., Fund, F., Follin, J. M., Du-rand, S., Bonifac, K., Oliveira, P. S., van Baelen, J., Montibert, C., Cavallo, T., Escaffit, R., and Fragnol, L.: Global validity and behaviour of tropospheric gradients estimated by GPS, presen-tation at the 2nd GNSS4SWEC Workshop held in Thessaloniki, Greece, 11–14 May 2015.
Nilsson, T. and Elgered, G., Long-term trends in the at-mospheric water vapor content estimated from ground-based GPS data, J. Geophys. Res., 113, D19101, https://doi.org/10.1029/2008JD010110, 2008.
Ning, T.: GPS Meteorology: With Focus on Climate Applications, PhD Thesis, Dept. Earth and Space Sciences, Chalmers Univer-sity of Technology, 2012.
Ning, T. and Elgered, E.: Trends in the atmospheric water va-por content from ground-based GPS: The impact of the el-evation cutoff angle, IEEE J. Sel. Top. Appl., 5, 744–751, https://doi.org/10.1109/JSTARS.2012.2191392, 2012.
papers/eurefsymposium2011/an_update_on_epn_reprocessing_ project_current_achievement_and_status (last access: September 2017), 2011.
Weatherhead, E. C., Reinsel, G. C., Tiao, G. C., Meng, X.-L., Choi, D., Cheang, W.-K., Keller, T., DeLuisi, J., Wuebbles, D. J., Kerr, J. B., Miller, A. J., Oltmans, S. J., and Frederick J. E.: Factors af-fecting the detection of trends: Statistical considerations and ap-plications to environmental data, J. Geophys. Res., 103, 17149– 17161, https://doi.org/10.1029/98JD00995, 1998.
Yuan, L. L., Anthes, R. A., Ware, R. H., Rocken, C., Bonner, W. D., Bevis, M. G., and Businger, S.: Sensing Climate Change Us-ing the Global PositionUs-ing System, J. Geophys. Res., 98, 14925– 14937, 1993.
Zus, F., Dick, G., Heise, S., Dousa, J., and Wickert, J.: The rapid and precise computation of GPS slant total delays and mapping factors utilizing a numerical weather model, Radio Sci., 49, 207– 216, https://doi.org/10.1002/2013RS005280, 2014.