An efficient scheme for mental task classification utilizing reflection
coefficients obtained from autocorrelation function of EEG signal
M. M. Rahman1•M. A. Chowdhury1• S. A. Fattah1
Received: 21 September 2016 / Accepted: 14 November 2017 / Published online: 9 December 2017
ÓThe Author(s) 2017. This article is an open access publication
Abstract
Classification of different mental tasks using electroencephalogram (EEG) signal plays an imperative part in various brain– computer interface (BCI) applications. In the design of BCI systems, features extracted from lower frequency bands of scalp-recorded EEG signals are generally considered to classify mental tasks and higher frequency bands are mostly ignored as noise. However, in this paper, it is demonstrated that high frequency components of EEG signal can provide accommodating data for enhancing the classification performance of the mental task-based BCI. Instead of using au-toregressive (AR) parameters considering AR modeling of EEG data, reflection coefficients obtained from EEG signal are proposed as potential features. From a given frame of EEG data, reflection coefficients are directly extracted by using the autocorrelation values in a recursive fashion, which avoids matrix inversion and computation of AR parameters. Use of reflection coefficients not only provides an effective feature vector for EEG signal classification but also offers very low computational burden. Support vector machine classifier is deployed in leave-one-out cross-validation manner to carry out classification process. Extensive simulation is done on an openly accessible dataset containing five different mental tasks. It is found that the proposed scheme can classify mental tasks with a very high level of accuracy as well as low time complexity in contrast with some of the existing strategies.
Keywords Electroencephalogram (EEG) Brain–computer interface (BCI)Autoregressive (AR) model
Autocorrelation functionReflection coefficient
1 Introduction
Electroencephalogram (EEG) has gained rigorous attention from the researchers for the study of brain–computer interface (BCI). EEG-based BCI systems employ electrical activity of brain to classify different EEG signals corre-sponding to various mental and motor imagery (MI) tasks correctly. One way to classify the signals effectively is to acquire discriminative features from that signal. As a matter of fact, different schemes to extract distinctive
features are available in literature. For instance, in [1], statistical data extracted from cross-correlation of EEG signals are reported as distinctive features for MI task classification, but the main drawback is the usage of prior information of the classes. In order to find frequency bands which can substantially segregate the feature vectors cor-responding to two classes of MI tasks, a Bayesian frame-work is proposed in [2]. However, the method offers moderate classification performance. For the purpose of EEG channel reduction for MI task, various types of spatial filters are widely employed, where regularized parameters need to be chosen manually. To be more specific, in [3], the task of channel reduction is performed by using sparse spatial filter optimization method, where manual inter-vention is required for obtaining some parameters. In [4], the common spatial pattern (CSP) with generic learning is proposed for EEG channel reduction where optimal selection of regularized parameters needs further investi-gation. However, apart from MI task classification, several
& S. A. Fattah
M. M. Rahman
M. A. Chowdhury
1 Bangladesh University of Engineering and Technology
(BUET), Dhaka 1000, Bangladesh
researchers concentrate in various mental task classifica-tion. For example, in [5], along with conventional lower spectral bands, an additional band (24–37 Hz) is used to extract spectral power and asymmetry ratio features for mental task classification. This method provides compar-atively satisfactory classification performance, but the classification accuracies are not consistent for all cases. In [6], along with the frequency bands used in [5], an addi-tional high frequency band (40–100 Hz) is used in similar feature extraction scheme to obtain better classification performance for mental task. Considering sixth-order autoregressive (AR) system, in [7], AR model coefficients are extracted from given EEG data and used for mental task classification. Moreover, feature extraction scheme based on multivariate AR models are reported in [8], where four different representations of AR coefficients are tested to classify mental task. In [9], along with AR parameters generalized Higuchi fractal dimension spectrum is utilized for mental arithmetic task recognition. In [10], classifica-tion of both EEG mental and cognitive tasks is reported based on Wavelet packet entropy and Granger causality, where classification performance is evaluated using mul-tiple kernel learning support vector machine (SVM) clas-sifier. A multivariate feature selection method based on wavelet transform and empirical mode decomposition is proposed in [11] for mental task classification.
One of the main objectives of this paper is to extract robust feature by using autocorrelation function of the EEG signal. For this purpose, reflection coefficients are com-puted directly from autocorrelation function of the EEG data. The idea of using reflection coefficients as feature is investigated for motor imagery tasks, and some preliminary results are reported in [12,13]. SVM classifier is used to carry out classification process. The effect of filtering using widely common frequency bands and that of using differ-ent kernels is investigated. Simulation details are intro-duced considering an openly accessible EEG dataset on various mental tasks.
2 Data acquisition
A widely used EEG data set collected by Keirn and Aunon [14] is utilized in this paper. EEG signals are acquired from the locations C3, C4, P3, P4, O1, and O2 which are denoted as the 1020 international system of electrode placement. Measurements are made considering A1 and A2 as refer-ence. Data are band pass filtered using an analog filter with band limit of 0:1100 Hz and sampled at 250 Hz with 12 bit quantizer. The recording is carried out for ten seconds during each session. EEG signals from seven subjects performing five different mental tasks, namely geometrical figure rotation (R), mathematical multiplication (M),
mental letter composing (L), visual counting (C), and baseline-resting (B) are investigated. For notational con-venience, hereafter, each task is abbreviated with an alphabet as shown in the parentheses. However, data obtained from three subjects contain fewer than ten ses-sions or have some recording errors. Hence, like some other existing research works [5], in this paper, data from four subjects, each having ten or more sessions, are taken into consideration.
For the purpose of analysis of each ten second session, a number of frames with shorter time interval are investi-gated as EEG signal is assumed to be non-stationary. In this case, one second frame duration is considered with 0.5 second frame shift (i.e. 50% overlap between successive frames) [6], which provides reasonable number of samples (250 samples) in each frame.
3 Proposed method
The proposed method of mental task classification utilizing EEG signal consists of three major steps: preprocessing, feature extraction and classification. In what follows, detailed description of these steps is presented.
3.1 Preprocessing
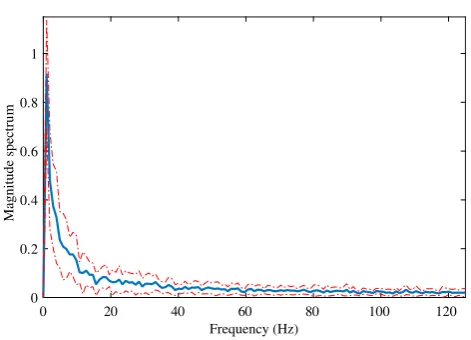
patterns of the averaged spectrum obtained in different other sessions exhibit quite similar nature. As a result, in the proposed method, the whole frequency band of EEG signal is utilized in order to extract spectral information residing in higher frequency region. It is to be mentioned that in order to remove 60 Hz artifact, at the beginning, a digital notch filter is used and raw EEG signals are nor-malized to zero mean and unit variance. In the result sec-tion, effect of considering band-limited EEG signals with different band widths on mental task classification is presented.
3.2 Feature extraction
A given frame of EEG data can be effectively modeled as the output of an AR system excited by white Gaussian noise [7,8]. Considering the EEG signal as an output of a causal, stable, linear time-invariant AR system, it can be expressed as
xðnÞ ¼ X
p
k¼1
akxðnkÞ þuðnÞ; ð1Þ
where u(n) is considered as white Gaussian noise input with zero mean and variance r2
u. Using the Yule-Walker equations, the AR parameters can be calculated as [15,16]
rxðmÞ ¼
Xp
k¼1
akrxðmkÞ þr2udðmÞ; m0
¼rxðmÞ; m\0
ð2Þ
where rxðmÞ, the m-th lag of autocorrelation function (ACF) ofx(n) with lengthN, can be termed as
rxðmÞ ¼ 1 N
X N1m
n¼0
xðnÞxðnþmÞ; m0: ð3Þ
AR parameters have already been used as features for EEG signal classification. For example, in [7], sixth-order AR parameters are used for EEG-based mental task clas-sification. One major problem in using AR parameters as features is the wide range of variation in parameter values, which does not have any boundary. As an alternate to the AR parameters, in this paper, we propose to utilize reflection coefficients as representative features.
Them-th reflection coefficient computes the correlation between x(n) andxðnmÞafter filtering the intermediate observations from xðn1Þ to xðnmþ1Þ. It can be obtained directly from ACF values of given signalx(n) by utilizing the Levinson–Durbin recursion formulas as [17]
km¼
rxðmÞ Pmj¼11d
ðm1Þ
j rxðmjÞ
Eðm1Þ ;m¼1;2; ::;p ð
4Þ
wheredjðmÞ at them-th iteration can be estimated as
djðmÞ¼dðmj 1Þkmd ðm1Þ
ðmjÞ;1j ðm1Þ
dmðmÞ¼km:
ð5Þ
Here,EðmÞ is the residual energy atm-th iteration and can be estimated as
EðmÞ¼1km2Eðm1Þ;m1 andEð0Þ¼rxð0Þ: ð6Þ
In summary, use of reflection coefficients as features pro-vides following advantages in comparison with the AR parameters:
1. As described above, the reflection coefficients can be directly obtained from autocorrelation values of given EEG data by utilizing simple recursive formula. Complicated AR parameter estimation method involv-ing matrix inversion is not necessary for obtaininvolv-ing reflection coefficients.
2. One problem in AR parameter values is that there is no certain limit for the value of an AR parameter. A feature value without a specific bound may create problem in feature based classification problem. On the other hand, the value of a reflection coefficientðkmÞis bounded for stable AR systems, which is jkmj\1. Given EEG data is modeled as the output of stable AR system.
3. It is found that the effect of different types of external noises, such as power line noise, load noise and muscle noise can cause less variation in reflection parameters in comparison with AR parameters. This may occur due to the process of computing reflection coefficients which involves a very few arithmetic operation using
Frequency (Hz)
0 20 40 60 80 100 120
Magnitude spectru
m
0 0.2 0.4 0.6 0.8 1
few ACF values in comparison with the case of AR parameter estimation. For example, to obtain first two reflection coefficients, only following operations are required.
k1¼ rxð1Þ
rxð0Þ ;k2¼
rxð2Þ k1rxð1Þ
ð1k2 1Þrxð0Þ
¼ 1
1k2 1
rxð2Þ
rxð0Þ
k21
:
ð7Þ
Thus, reflection coefficients acquired from the autocorre-lation function of the EEG signal have the potential to form a distinctive feature vector for mental task classification. One major concern is the number of reflection coefficients to be computed for feature extraction. In fact, it is a common problem in the AR modeling of EEG signal to find the model order that is appropriate for the given data. Considering different model order will provide AR parameters those are completely different. However, with the increase in model order by one for a given signal, only the value of the last (highest order) reflection coefficient will be changed. Considering the size of the feature vector, only first few reflection coefficients can be chosen.
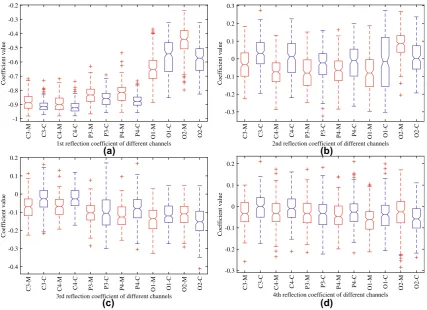
In order to investigate the number of reflection coeffi-cients to be considered as feature, detailed statistical analysis on first few reflection coefficients is performed. As an example, EEG recordings of all the sessions of a par-ticular subject performing mathematical multiplication (M) and visual counting (C) tasks are considered. After performing the necessary preprocessing, the reflection coefficients are extracted. In this case, four reflection coefficients are computed considering AR (4) system. In Fig.2a, the boxplots of the first reflection coefficient indicating some statistical information, such as median, 25th and 75th percentile, and outliers are shown. There are twelve boxplots corresponding to six channel data with two different types of tasks, indicated with two different letters M and C after the channel label. To be more specific, C3-M and C3-C correspond to boxplots obtained from the EEG data of channel C3; first one refers to mathematical mul-tiplication and the second one to visual counting tasks. The boxplots computed for other tasks are excluded here to avoid complicated presentation.
From Fig.2, it is observed that 1st and 2nd reflection coefficients offer better discriminative features between two classes of mental tasks in comparison with other two reflection coefficients. For example, the statistical charac-teristics of the 3rd and 4th reflection coefficients in channel P3 exhibit poor discriminative feature, which may affect the performance of classification between two types of mental tasks. This statement is also reflected in nonpara-metric Wilcoxon rank sum test which is used to quantify the test of class separability in terms of medians. It tests
whether data from two types of tasks come from identical continuous distributions with equal medians, against the alternative that they do not have equal medians. The probability values (p-value) under this null hypothesis are found 0.00012472, 0.00000058, 0.96163331 and 0.55842113, respectively, for four reflection coefficients considering channel P3. The high p-values observed for 3rd and 4th reflection coefficient indicate the failure to reject the null hypothesis, i.e., the data obtained from two tasks have almost similar medians reflecting low separability of the feature. On the contrary, very low p-values obtained in case of 1st and 2nd reflection coefficients indicate that the data obtained from two tasks does not come from identical distributions with almost equal medians. Hence, it is expected that the use of only first two reflection coefficients as feature can precisely preserve important discriminative information of the original signal patterns. For this pur-pose, it is adequate to consider second order AR modeling to obtain the proposed reflection coefficients. For an lchannel EEG data, considering two reflection coefficients from each channel, the feature dimension will be 2l. As a result, it will also offer significant reduction in feature dimension. However, effect of varying the number of reflection coefficients on the classification performance is described in detail in the result section.
3.3 Classification
Selecting an efficient classifier for the classification of EEG data into different groups plays an important role in obtaining satisfactory performance. However, if discrimi-native characteristics of different classes can be extracted, simple classifier may provide reasonable performance. Instead of directly utilizing the data or their statistics as feature, in the proposed method, classification is carried out on the features extracted from the data. Because of its wide acceptability and effectiveness in supervised classification, for the purpose of classifying the EEG signal, kernel-based SVM classifier is employed. The kernel-based approach converts the data from the original space to a new repre-sentative vector space, where it becomes easier to dis-criminate different classes more efficiently. The objective is to compute an N dimensional decision vector w¼ ½w1w2 wNT for a training dataset which consists of L frames, where each N dimensional i-th frame xi¼
wTxiþb þ1; for all positivexi wTxiþb 1; for all negative xi
ð8Þ
For kernel-based classification approach, the discriminant functionf(x) can be defined as [18]
fðxÞ ¼X
L
i¼1
ciKðxi;xÞ þb; ð9Þ
whereciis an empirical value and kernel matrixKis given by
K¼
Kðx1;x1Þ Kðx1;x2Þ Kðx1;xLÞ
Kðx2;x1Þ Kðx2;x2Þ Kðx2;xLÞ ..
.
.. .
...
KðxL;x1Þ KðxL;x2Þ KðxL;xLÞ 2
6 6 6 6 4
3 7 7 7 7
5 ð10Þ
It is to be mentioned that thei,j-th element of the kernel matrix for both linear and nonlinear kernel function can be characterized as the inner product of the i-th and j-th training vectors.
In this paper, the effect of different kernel functions is investigated, and finally, quadratic kernel function is used in our proposed scheme for mental task classification. For the sake of evaluating the performance of extracted
features, leave-one-out cross-validation scheme is applied, where each frame is tested one by one. During the testing of a frame, all the remaining frames are used for training. The overall accuracy is calculated based on the classifi-cation results obtained in all the frames.
4 Simulation and results
In this section, performance of the proposed method is investigated considering classification accuracy obtained under different conditions, such as varying the feature dimension, utilizing different spectral bands for feature extraction and employing various types of kernel function in SVM classifier. Moreover, effect of channel selection on classification accuracy using the proposed method is ana-lyzed. In this case, various spatial locations of EEG channels are taken into consideration. A comparative analysis on classification performance between the pro-posed method and some existing methods is also per-formed. In the proposed method, two reflection coefficients obtained from each channel are computed using (7) and used as discriminative feature to classify EEG signal. Unless otherwise specified, quadratic kernel of SVM 1st reflection coefficient of different channels
C3-M C3-C C4-M C4-C P3-M P3-C P4-M P4-C O1-M O1-C O2-M O2-C
Coefficient value
-1 -0.9 -0.8 -0.7 -0.6 -0.5 -0.4 -0.3 -0.2
2nd reflection coefficient of different channels
C3-M C3-C C4-M C4-C P3-M P3-C P4-M P4-C O1-M O1-C O2-M O2-C
Coefficient value
-0.3 -0.2 -0.1 0 0.1 0.2 0.3
3rd reflection coefficient of different channels
C3-M C3-C C4-M C4-C P3-M P3-C P4-M P4-C O1-M O1-C O2-M O2-C
Coefficient value
-0.4 -0.3 -0.2 -0.1 0 0.1 0.2
4th reflection coefficient of different channels
C3-M C3-C C4-M C4-C P3-M P3-C P4-M P4-C O1-M O1-C O2-M O2-C
Coefficient value
-0.3 -0.2 -0.1 0 0.1 0.2
(a) (b)
(d) (c)
classifier is employed in leave-one-out cross-validation manner to obtain classification accuracy. The classification task is carried out considering two types of mental tasks at a time, as conventionally done by other researchers [5,6]. In this way, ten different combinations of these five types of tasks are plausible where each combination is denoted by two alphabets. For example, MC corresponds to com-bination of mathematical multiplication and visual count-ing tasks, BL corresponds to combination of baseline-resting and mental letter composing tasks etc. In what follows, detail results and analyses are presented.
4.1 Effect of channel selection
In mental task classification-based applications, it is nec-essary to perform the testing phase within the frame rate in view of obtaining real-time classification results. For that purpose, channel selection can play a vital role to reduce feature size effectively, which in turn reduces the com-plexity as well as time involved in performing the classi-fication task. In the given database, EEG signals are acquired from six locations, namely C3, P3, O1, C4, P4, and O2, where the first three channels are placed in the left hemisphere and the last three channels are placed in the right hemisphere of the skull. One possibility is to consider EEG channels located in any one of the two hemispheres. In that case, half of the channels will be reduced. Alter-nately, considering only central channels (C3, C4) or parietal channels (P3, P4) or occipital channels (O1, O2) can be used to investigate corresponding classification performance. In order to present the performance com-parison between the cases where reduced number of channels and all channels are used, a sample experiment considering the mathematical multiplication and visual counting tasks for all four subjects is chosen. Classification accuracies obtained for four subjects using leave-one-out cross-validation technique are shown in Fig.3.
It is observed that right hemisphere channels provide comparatively better accuracies with respect to that obtained by using the left hemisphere channels (except for subject 4). Moreover, a particular location of chan-nels may provide better classification accuracy, but it varies from subject to subject. For example, for subject 1 and subject 4, better classification accuracy is achieved when channels from occipital locations are considered. However, in all cases, lower classification accuracy is obtained if the reduced number of channels are used instead of all channels. As a result, it is not possible to select any one particular choice of reduced number of channels to obtain acceptable classification performance in all subjects. Hence, in the proposed method, all channels are taken into account to perform the task of classification.
4.2 Effect of feature dimension reduction using
principal component analysis
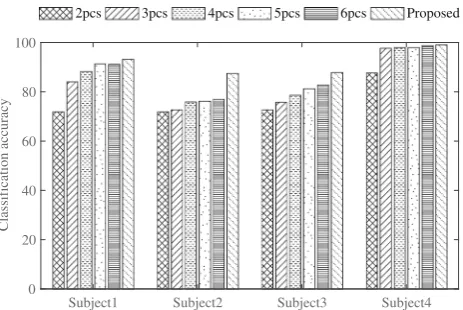
Feature dimension reduction using principal component analysis (PCA) may provide effective classification per-formance and reduced classification time. PCA is a statis-tical procedure that represents the original feature matrix in the principal component space with a view to producing a reduced number of principal components than the number of original features. For the purpose of investigation of varying the number of principal components, a sample experiment similar to that considered in the previous sub-section is conducted. Here, the number of principal com-ponents is varied from 2 to 6 and different cases like using first two principal components (2pcs), first three principal components (3pcs) etc. for all four subjects are considered. Classification performance obtained by varying number of principal components are shown in Fig.4.
It is observed that with the increase in number of prin-cipal components, classification accuracies obtained for
Subject1 Subject2 Subject3 Subject4
Classification accuracy
0 20 40 60 80 100
Left Right Central Periatal Occipetal All
Fig. 3 Effect of channel selection on classification accuracy for all four subjects in case of MC pair of tasks
Subject1 Subject2 Subject3 Subject4
Classification accuracy
0 20 40 60 80 100
2pcs 3pcs 4pcs 5pcs 6pcs Proposed
different subjects increase. In case of subject 4, considering more than two principal components provide classification accuracies which are almost equal to that obtained by using all 12 features utilized in the proposed method. However, in all cases, classification accuracy obtained by using reduced number of principal components does not surpass accuracy that obtained by using all 12 features utilized in the proposed method. As a result, feature dimension reduction scheme using PCA is not taken into account to perform the task of classification in the proposed method.
4.3 Effect of variation of number of reflection
coefficients
The number of reflection coefficients to be used in the feature matrix directly dictates the feature dimension. In general, lower order AR model is sufficient to represent EEG data. In that case, a few number of reflection coeffi-cients, say less than six, are sufficient to consider as fea-ture. With a view to investigate the effect of varying the number of reflection coefficients, a sample experiment similar to that considered in the previous subsections is chosen. Here, the number of reflection coefficients is varied from 1 to 6 and different cases like using the first coeffi-cient (1cf), first two coefficoeffi-cients (2cfs) etc. for all four subjects are considered. In Fig.5, classification perfor-mance obtained by varying number of reflection coeffi-cients is presented.
It is found that increasing the number of reflection coefficients from one to two provides significantly increased accuracy (except in case of subject 4). It is very interesting that if the number of coefficients is taken more than two, the accuracy does not improve or even fall (ex-cept in case of subject 2). From this experiment, one may conclude to select first two or first three coefficients as feature. However, as stated earlier, reducing the overall
feature dimension is always very essential for real-time computation. Hence, first two reflection coefficients are considered as proposed feature.
4.4 Effect of frequency band selection
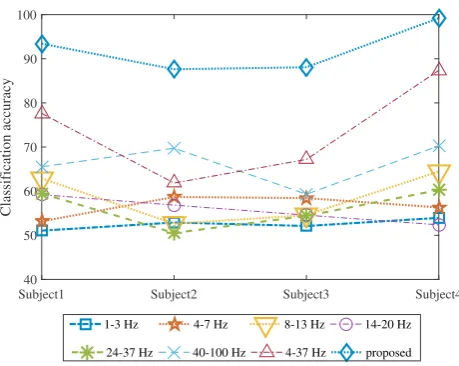
In different EEG signal analysis, most commonly band-limited signals are used considering conventional fre-quency bands, namely delta, theta, alpha, beta, and gamma [5]. Estimating reflection coefficients from a specific band-limited EEG signal may not be capable of providing representative characteristics. However, for the purpose of investigation, each band of EEG signal is separately generated by using narrow-band filters and first two reflection coefficients are estimated from the band-limited EEG signal. Classification performance for each band is separately computed. Moreover, various wide-band signals, such as 40100 Hz or 437 Hz signals, are also taken in consideration and here also classification performance are computed considering the first two reflection coefficients.
The variation of classification performance for different band-limited EEG signals is demonstrated considering the similar experiment performed in the previous subsections. It is vividly observed from Fig.6 that extracting features from different narrow-band EEG signals cannot provide satisfactory performance. However, considering wide-band EEG signals offer comparatively better performance than narrow-band EEG signals. In particular, without restricting the frequency band up to certain range, the best classification performance is achieved. That is why band limitation of the given EEG data is not adopted in this paper.
Subject1 Subject2 Subject3 Subject4
Classification accuracy
0 20 40 60 80 100
1cf 2cfs 3cfs 4cfs 5cfs 6cfs
Fig. 5 Effect of reflection coefficients variation on classification accuracy for all four subjects in case of MC pair of tasks
Subject1 Subject2 Subject3 Subject4
Classification accuracy
40 50 60 70 80 90 100
1-3 Hz 4-7 Hz 8-13 Hz 14-20 Hz
24-37 Hz 40-100 Hz 4-37 Hz proposed
4.5 Performance comparison with existing
methods
The classification performance of the proposed method and that of the three available methods reported in [5, 6] is compared. Among these three methods, the first one uti-lizes power of spectral bands and asymmetry ratios from four bands (referred to as PAR4) and the second one also utilizes similar power and asymmetry ratios from five bands including the Gamma band (referred to as PAR5) as features. The third one introduces one additional band (40100 Hz) along with the five bands utilized in third method and extracts power and asymmetry ratios as fea-tures (referred to as PAR6). For one pair of electrodes, the asymmetry ratio for each spectral band is computed as [5]
Aði;jÞ ¼PðiÞ PðjÞ
PðiÞ þPðjÞ ð11Þ
where two indices i and j are used to correspond electrode pairs placed in the left and right hemispheres, respectively. For example,P(i) corresponds to the spectral band power of thei-th electrode placed in the left hemisphere andP(j) corresponds to that obtained from thej-th electrode placed in the right hemisphere. Depending on the number of electrodes (Ni and Nj) in each hemisphere, total NiNj number of asymmetry ratios, denoted by A(i,j), can be computed for each spectral band. As a result, the feature dimension for PAR4, PAR5 and PAR6 method is (NbNiNj ?Nbl) where Nb denotes number of spectral band considered for these methods. On the con-trary, as discussed before, considering two reflection coefficients from each channel, the feature dimension will be 2lfor proposed method which is diminutive compare to PAR4, PAR5 and PAR6 method.
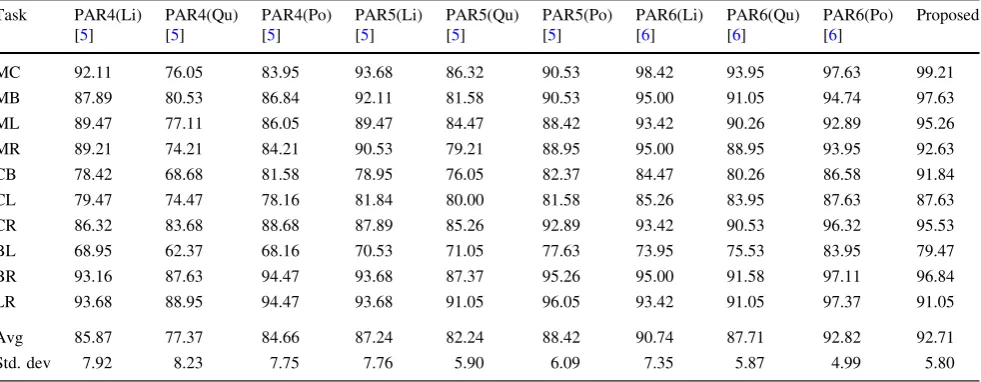
For the purpose of performance evaluation, leave-one-out cross-validation technique is carried leave-one-out in all three existing methods. The SVM classifier considering linear (Ln), quadratic (Qd) and polynomial (Pl) kernel is employed in all three existing methods for the sake of fair comparison. As mentioned before, quadratic kernel of SVM classifier is employed in leave-one-out cross-valida-tion manner to obtain classificacross-valida-tion accuracy for the pro-posed method. However, the effect of other kernels of SVM classifier on the classification performance obtained by proposed method is discussed exclusively in Sec.4.7. In Tables1,2,3and4, the classification accuracies obtained by using four different subjects are separately reported for PAR4, PAR5, PAR6 and proposed method. Moreover, average classification accuracy and standard deviation obtained from four subjects for different combination of tasks are listed in Table 5. It is found that the average classification accuracies obtained from different subjects are more than 89:16%with reasonable amount of standard deviation for the proposed method. It is observed that the proposed feature extraction method outperforms other existing methods reported in this paper in terms of classi-fication accuracy if quadratic kernel is considered to compute accuracy. For Subject 1 and Subject 3, it is observed that the proposed feature extraction method pro-vides better classification accuracy irrespective of the kernel. However, in some combinations of mental tasks for Subject 2 and Subject 4, existing PAR6 method utilizing polynomial kernel offers competitive classification perfor-mance with respect to the proposed method, where a large feature dimension is required. For example, the classifica-tion accuracy of the proposed method obtained for Subject 2 is found higher for all but MR and CB combination of tasks where PAR6(Po) offers slightly better accuracy. In
Table 1 Overall classification accuracy obtained for subject 1
Task PAR4(Li) PAR4(Qu) PAR4(Po) PAR5(Li) PAR5(Qu) PAR5(Po) PAR6(Li) PAR6(Qu) PAR6(Po) Proposed
[5] [5] [5] [5] [5] [5] [6] [6] [6]
MC 88.16 79.21 88.42 88.42 78.68 88.95 92.37 82.37 91.58 93.42
MB 82.63 71.32 82.11 82.89 73.16 83.95 84.47 78.68 87.37 92.63
ML 90.53 72.37 86.05 90.53 71.32 87.37 93.95 82.11 90.26 96.05
MR 93.42 80.53 89.47 92.37 81.32 91.05 96.05 87.37 93.95 97.63
CB 72.37 65.53 72.37 74.74 68.42 78.95 83.42 80.26 82.63 91.05
CL 64.21 63.16 65.26 65.79 65.53 69.74 69.74 76.32 77.11 82.11
CR 72.11 68.42 71.58 71.05 71.32 74.74 73.42 77.63 80.26 87.63
BL 65.79 64.47 69.74 63.68 68.68 71.05 75.79 81.32 82.89 88.95
BR 86.05 77.89 83.42 85.00 78.16 86.58 90.00 86.05 92.37 94.21
LR 68.42 67.63 70.26 72.11 71.05 77.37 75.53 77.89 81.84 86.58
Avg 78.37 71.05 77.87 78.66 72.76 80.97 83.47 81.00 86.03 91.03
Table 2 Overall classification accuracy obtained for subject 2
Task PAR4(Li) PAR4(Qu) PAR4(Po) PAR5(Li) PAR5(Qu) PAR5(Po) PAR6(Li) PAR6(Qu) PAR6(Po) Proposed
[5] [5] [5] [5] [5] [5] [6] [6] [6]
MC 68.42 66.58 69.47 70.79 73.95 76.58 76.84 81.05 83.42 87.63
MB 76.05 70.53 78.95 82.37 79.47 86.32 86.32 85.79 91.05 94.47
ML 67.37 66.32 70.53 77.11 78.16 83.42 83.42 85.79 87.63 88.95
MR 66.32 62.89 71.32 71.84 74.74 79.21 75.53 85.53 90.00 87.89
CB 71.84 72.11 74.74 79.47 79.47 80.53 85.00 90.79 92.11 90.79
CL 65.53 60.26 64.74 71.58 71.05 75.53 88.95 85.26 89.47 94.74
CR 59.47 66.58 68.68 64.47 76.05 73.42 82.63 84.47 87.11 90.79
BL 68.68 66.84 71.84 76.84 74.74 79.47 84.74 84.47 86.84 91.32
BR 69.21 64.74 76.05 72.11 75.26 79.74 78.95 83.68 86.05 87.11
LR 68.42 67.11 71.58 70.00 70.53 80.79 76.84 82.89 84.21 88.16
Avg 68.13 66.39 71.79 73.66 75.34 79.50 81.92 84.97 87.79 90.18
Std. dev 4.27 3.38 4.01 5.25 3.11 3.74 4.60 2.53 2.85 2.75
Table 3 Overall classification accuracy obtained for subject 3
Task PAR4(Li) PAR4(Qu) PAR4(Po) PAR5(Li) PAR5(Qu) PAR5(Po) PAR6(Li) PAR6(Qu) PAR6(Po) Proposed
[5] [5] [5] [5] [5] [5] [6] [6] [6]
MC 63.51 61.58 68.42 66.84 66.49 74.91 69.47 74.04 79.82 88.07
MB 69.82 66.84 73.16 71.05 71.75 74.56 74.91 81.75 81.40 87.89
ML 69.65 67.89 71.58 68.25 70.18 74.39 75.96 77.19 80.70 90.53
MR 73.68 67.19 74.74 79.30 72.46 79.47 81.93 83.33 87.89 93.51
CB 67.02 61.23 70.53 66.49 63.68 72.98 72.46 71.75 81.05 85.61
CL 72.11 64.21 72.81 71.93 66.84 77.19 79.12 75.09 80.35 86.49
CR 71.40 61.23 68.60 73.16 67.54 75.44 76.49 78.95 81.40 91.40
BL 71.23 64.91 74.39 73.51 64.74 74.56 78.07 74.91 84.21 86.67
BR 71.05 68.95 73.86 69.30 70.53 75.96 80.18 77.19 84.21 87.02
LR 82.11 69.82 77.89 83.68 76.67 83.33 89.47 78.95 87.54 94.39
Avg 71.16 65.39 72.60 72.35 69.09 76.28 77.81 77.32 82.86 89.16
Std. dev 4.79 3.24 2.92 5.49 3.96 3.05 5.50 3.55 2.96 3.10
Table 4 Overall classification accuracy obtained for subject 4
Task PAR4(Li) PAR4(Qu) PAR4(Po) PAR5(Li) PAR5(Qu) PAR5(Po) PAR6(Li) PAR6(Qu) PAR6(Po) Proposed
[5] [5] [5] [5] [5] [5] [6] [6] [6]
MC 92.11 76.05 83.95 93.68 86.32 90.53 98.42 93.95 97.63 99.21
MB 87.89 80.53 86.84 92.11 81.58 90.53 95.00 91.05 94.74 97.63
ML 89.47 77.11 86.05 89.47 84.47 88.42 93.42 90.26 92.89 95.26
MR 89.21 74.21 84.21 90.53 79.21 88.95 95.00 88.95 93.95 92.63
CB 78.42 68.68 81.58 78.95 76.05 82.37 84.47 80.26 86.58 91.84
CL 79.47 74.47 78.16 81.84 80.00 81.58 85.26 83.95 87.63 87.63
CR 86.32 83.68 88.68 87.89 85.26 92.89 93.42 90.53 96.32 95.53
BL 68.95 62.37 68.16 70.53 71.05 77.63 73.95 75.53 83.95 79.47
BR 93.16 87.63 94.47 93.68 87.37 95.26 95.00 91.58 97.11 96.84
LR 93.68 88.95 94.47 93.68 91.05 96.05 93.42 91.05 97.37 91.05
Avg 85.87 77.37 84.66 87.24 82.24 88.42 90.74 87.71 92.82 92.71
case of Subject 4, it is found that the average classification accuracy obtained for the proposed method is very close to PAR6(Po) despite having a very smaller feature dimension. In each reported existing method, it is observed that for various combination of mental tasks, classification accu-racy varies a lot. For example, in PAR4(Li) method, the standard deviation of classification accuracies for various subjects are found 10:96%, 4:27%, 4:79% and 7:92% compared to 4:74%, 2:75%, 3:10%and 5:80% of the pro-posed method. It is found that the classification perfor-mance obtained by the proposed method varies from subject to subject, but not at a very large scale. It is clearly observed that the proposed method offers consistently satisfactory classification accuracy in most cases irrespec-tive of subjects and combination of mental tasks.
4.6 Physical insight on classification
performance variation
It is observed in Tables 1, 2, 3, 4 and 5, comparatively better classification accuracy is obtained while considering MC, MB, ML and MR tasks than other six combinations of tasks. The important factor here is that in all those four cases, multiplication task is involved, which is the only mental arithmetic task among five different tasks consid-ered in this experiment. It is expected that being an arith-metic task, multiplication involves more complexity in comparison with other four mental tasks, namely geomet-rical figure rotation, letter composing, counting and base-line-resting. As a result, characteristics of the EEG signals are expected to be significantly different in case of multi-plication task and thus better classification performance is achieved whenever one of the two tasks to be classified is a multiplication task.
It is also observed that larger the degree of variation between the nature of two mental tasks, better the classi-fication performance. For example, among four mental tasks (R, B, L, C), in case of geometrical figure rotation (R), subjects are trained to visualize a complex rotating block, which is comparatively difficult than other three mental tasks. As a result, it is found that the classification performance for the tasks RL, RB, and RC is better than the tasks BL, BC, and LC. Obviously, the above observations may vary subject to subject since a particular task may not be equally difficult to every subject.
4.7 Effect of kernel in SVM classifier
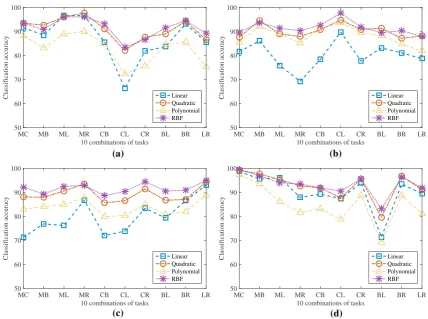
Classification results of the proposed method presented in Tables1,2,3and4are obtained by using quadratic kernel in the SVM classifier. However, the effect of using dif-ferent kernels in SVM classifier on overall classification performance is also investigated. In order to demonstrate the performance variation due to change in kernels, four widely used kernels are considered, namely linear, quad-ratic, polynomial, and radial basis function (RBF). Similar to Tables 1, 2, 3 and 4, considering 10 different combi-nations of tasks, in Fig.7, classification accuracies obtained by using four different kernels are shown.
It is found that the classification performances of quadratic and RBF kernels are consistently better in com-parison with those obtained by linear and polynomial kernels. Moreover, classification accuracy varies for dif-ferent tasks in case of linear and polynomial kernels. Among quadratic and RBF kernels, since the first one provides better performance irrespective of feature dimension, in the results presented in Tables1,2,3and4, quadratic kernel is chosen to classify EEG signals for the sake of comparing the proposed method with existing methods, which utilize larger feature dimension.
4.8 Computation time
Average computational time is measured to extract features from one test signal for four methods namely PAR4, PAR5, PAR6 and proposed method. The whole process of com-putation is performed using Intel(R) Core(TM) i3-4130 processor with 3.40 GHz clock speed and 4 GB ram. The feature dimension and the feature extraction time for four methods are listed in Table6.
It is found that the proposed method uses a very small computation time for feature extraction compare to other three methods. The reason for such a very small compu-tation time for the proposed method is the feature dimen-sion. In case of proposed method, the feature dimension is only 26¼12, while in case of PAR4, PAR5 and PAR6, it is 433þ46¼60, 533þ56¼75 and 633þ66¼90 respectively.
Table 5 Average classification accuracy and standard deviation obtained from four subjects for different combination of tasks
Combination of tasks MC MB ML MR CB CL CR BL BR LR
Avg 92.08 93.16 92.7 92.92 89.82 87.74 91.34 86.6 91.29 90.04
5 Conclusion
In the proposed mental task classification scheme, instead of conventional AR parameters, reflection coefficients of EEG data are utilized, which offers some major advan-tages, such as noise robustness, variation of values within a certain boundary and ease of computing via recursive relations. As a matter of fact, a quite satisfactory perfor-mance using very low feature dimension is achieved. It is observed that increase in feature dimension by considering more reflection coefficients not necessarily provides better performance and thus only two coefficients from each channel are found sufficient. In addition, it is found that frequency band limitation is not necessary in the proposed scheme for obtaining consistent estimate of reflection coefficients, and thus available full band EEG signal is
utilized. Effect of channel selection is also investigated, and it is observed that for some subjects, a competitive classification performance may be obtained by considering only some specific channels. However, considering all channels provide the best classification performance irre-spective of the task or the subject. It is observed that the proposed feature extraction method consistently offers better classification accuracy compared to various available methods reported in this paper despite having a very small feature dimension. The high classification accuracy and low standard deviation obtained from various combination of tasks indicate high within class compactness and between class separability of the proposed feature extrac-tion scheme. Besides improving classificaextrac-tion accuracy, the biological reasons behind obtaining variation in classifi-cation accuracies for different tasks are also investigated in this paper. Finally, it is shown that the proposed scheme offers very low computational time for feature extraction and classification. Results obtained from various types of investigation verify that the proposed mental task classification scheme is capable of classifying EEG signals with high classification accuracy and very low computa-tional time.
10 combinations of tasks
MC MB ML MR CB CL CR BL BR LR
Classification accuracy
50 60 70 80 90 100
Linear Quadratic Polynomial RBF
10 combinations of tasks
MC MB ML MR CB CL CR BL BR LR
Classification accuracy
50 60 70 80 90 100
Linear Quadratic Polynomial RBF
10 combinations of tasks
MC MB ML MR CB CL CR BL BR LR
Classification accuracy
50 60 70 80 90 100
Linear Quadratic Polynomial RBF
10 combinations of tasks
MC MB ML MR CB CL CR BL BR LR
Classification accuracy
50 60 70 80 90 100
Linear Quadratic Polynomial RBF
(c)
(b) (a)
(d)
Fig. 7 Classification accuracy obtained from four subjects considering different kernels in SVM classifier.a–dcorrespond to classification accuracy obtained from 1st, 2nd, 3rd and 4th subject considering different kernels respectively. (Color figure online)
Table 6 Feature dimension and average time for feature extraction
Feature characteristics PAR4 PAR5 PAR6 Proposed
Feature dimension 60 75 90 12
Open Access This article is distributed under the terms of the Creative Commons Attribution 4.0 International License (http://creative
commons.org/licenses/by/4.0/), which permits unrestricted use,
dis-tribution, and reproduction in any medium, provided you give appropriate credit to the original author(s) and the source, provide a link to the Creative Commons license, and indicate if changes were made.
References
1. Siuly S, Li Y (2012) Improving the separability of motor imagery EEG signals using a cross correlation-based least square support vector machine for brain–computer interface. IEEE Trans Neural Syst Rehabil Eng 20(4):526
2. Suk HI, Lee SW (2013) A novel Bayesian framework for dis-criminative feature extraction in brain–computer interfaces. IEEE Trans Pattern Anal Mach Intell 35(2):286
3. Yong X, Ward RK, Birch GE (2008) Sparse spatial filter opti-mization for EEG channel reduction in brain–computer interface. In: Proceedings ICASSP, pp 417–420
4. Lu H, Plataniotis KN, Venetsanopoulos AN (2009) Regularized common spatial patterns with generic learning for EEG signal classification. In: Proceedings of IEEE engineering in medicine and biology society, pp 6599–6602
5. Palaniappan R (2006) Utilizing gamma band to improve mental task based brain–computer interface design. IEEE Trans Neural Syst Rehabil Eng 14(3):299
6. Zhang L, He W, He C, Wang P (2010) Improving mental task classification by adding high frequency band information. J Med Syst 34(1):51
7. Liang NY, Saratchandran P, Huang GB, Sundararajan N (2006) Classification of mental tasks from EEG signals using extreme learning machine. Int J Neural Syst 16(01):29
8. Anderson CW, Stolz EA, Shamsunder S (1998) Multivariate autoregressive models for classification of spontaneous elec-troencephalographic signals during mental tasks. IEEE Trans Biomed Eng 45(3):277
9. Wang Q, Sourina O (2013) Real-time mental arithmetic task recognition from EEG signals. IEEE Trans Neural Syst Rehabil Eng 21(2):225
10. Li X, Chen X, Yan Y, Wei W, Wang ZJ (2014) Classification of EEG signals using a multiple kernel learning support vector machine. Sensors 14(7):12784
11. Gupta A, Agrawal R, Kaur B (2015) Performance enhancement of mental task classification using EEG signal: a study of mul-tivariate feature selection methods. Soft Comput. 19(10):2799 12. Talukdar MTF, Sakib SK, Pathan NS, Fattah SA (2014) Motor
imagery EEG signal classification scheme based on autoregres-sive reflection coefficients. In: Proceedings ICIEV, pp 1–4 13. Fattah S, Fatima K, Shahnaz C (2015) An approach for
classi-fying alcoholic and non-alcoholic persons based on time domain features extracted from EEG signals. In: Proceedings WIECON-ECE, pp 479–482
14. Keirn ZA, Aunon JI (1990) A new mode of communication between man and his surroundings. IEEE Trans Biomed Eng 37(12):1209
15. Duda RO, Hart PE, Stork DG (2012) Pattern classification. Wiley, New York
16. Kay SM (1988) Modern spectral estimation. Pearson Education India, New Delhi
17. Rangayyan RM, Reddy NP (2002) Biomedical signal analysis: a case-study approach. Ann Biomed Eng 30(7):983
18. Kung SY (2014) Kernel methods and machine learning. Cam-bridge University Press
Md. Mostafizur Rahmanreceived his B.Sc. degree in Electrical and Electronic Engineering (EEE) from Islamic University of Technology (IUT), Gazipur, Bangladesh in 2012, and completed his M.Sc. degree in EEE from Bangladesh University of Engineering and Technology (BUET), Dhaka, Bangladesh. He joined Dhaka Power Distribution Company (DPDC) in 2015 as an assistant Engineer and is currently working there. His research interest includes biomedical engineering, signal processing and industrial electronics.
Md. Asif Chowdhury received his B.Sc. degree in Electrical and Electronic Engineering (EEE) from Bangladesh University of Engi-neering and Technology (BUET), Dhaka, Bangladesh in 2015, and currently continuing his M.Sc. in the same university. He joined Dhaka Electric Supply Company Limited (DESCO) in 2017 as an assistant Engineer and is currently working there. His research interest includes biomedical signal processing, smart grid and power system protection.