Value‑added disaggregated social
accounting matrix for the Indian economy
of the year 2007–2008
Barun Deb Pal
1*and Jayatilleke S. Bandarlage
21 Introduction
The Indian economy is growing fast since the introduction of the economic reform process has been recognized by policy analysts and policy makers (Kotwal et al. 2011; Ahluwalia 2002). However, the poverty and income distributional implications of
Abstract
India is pioneer in constructing the social account matrices for its economy for various years, but limited efforts have been made to construct a SAM for India with detailed description about types labour input employed in various economic activities and subsequently the distribution of labour income across various households groups. To bridge this gap, we have constructed a 78-sector SAM for India which takes into account 48 types of labour input for economic activities and 80 types of households classes in India. Integrating the existing input–output database of the year 2007–2008, a 78-sector SAM of the year 2007–2008 and unit-level data published by National Sam-ple Survey Office of India. This SAM differs from the existing 78-sector SAM in terms of its sectoral classification and especially the level of disaggregation of value-added and households account. Further, in this study we have illustrated some applicability of this SAM in analysing income inequality across various social groups of households in India and their contribution to the national income of India. It is observed from this SAM that the rural other social category of households constituted 17% of total population in India and contributed 13% of its net national income, whereas the special social category households of rural areas (SC, ST and OBC) contributed significantly lower in India’s NNP than their share in population. Hence, these categories of households in rural India remain unproductive than the other social category of households. Contrary to this fact, the urban counterparts of these social groups of households are more productive in India. We have also estimated the Gini coefficients corresponding to each social group of households as a measure of level of income inequality. Further, the SAM multiplier model has been applied to observe the impact of agricultural growth on rural income and income equality. The estimated Gini coefficients revealed the facts that the growth in paddy crops will lead to high increase with low income inequality among the SC and ST households, whereas for the OBC and other category house-holds the same phenomena is observed corresponding to livestock sector.
Keywords: SAM, India, Household category, Value added, Agriculture, Poverty, Income inequality, Inclusive growth
Open Access
© The Author(s) 2017. This article is distributed under the terms of the Creative Commons Attribution 4.0 International License (http://creativecommons.org/licenses/by/4.0/), which permits unrestricted use, distribution, and reproduction in any medium, provided you give appropriate credit to the original author(s) and the source, provide a link to the Creative Commons license, and indicate if changes were made.
RESEARCH
*Correspondence: palbarundeb@gmail.com 1 International Food Policy Research Institute, NASC Complex, New Delhi 110012, India
economic policy reforms have often been the subject of policy debate in India. In order to examine such implications of economic policy reforms, an economy-wide database such as a social accounting matrix (SAM) that includes a detailed component of house-hold income distribution of different socio-economic groups is required. Furthermore, an economy-wide model based on such a detailed database is required to examine the impact of policy reforms on different socio-economic groups in the Indian economy. Therefore, the purpose of this paper is to outline a detailed framework for the construc-tion of an Indian SAM for the year 2007–2008. The main contribuconstruc-tion of the proposed SAM is the disaggregation of the value-added component of each sector in Indian econ-omy in a detailed manner.
The structure of the rest of the paper is as follows. The section 2 provides a brief over-view of a SAM and its historical evolution. The section 3 describes steps involved in extending the exisitng SAM of the year 2007-08 into a value added disaggregated SAM of the same year for India. Subsequently the consistency of the SAM has been validated using data on key macro economic indicators and this is described in the section 4. The section 5 briefly described the application of this SAM in analysing income inequality in India. In this section also we have applied the SAM multiplier analysis to assess the impact of sector specific growth on income inequality across various social groups. At the end the section 6 concludes this paper by citing the key limitiation of this SAM as well.
2 A brief overview of SAMs and historical evolution of compiling SAMs for India
A social accounting matrix is simply defined as a single-entry accounting system whereby each macroeconomic account is represented by a column for outgoings (pay-ments) and a row for incomings (receipts) (Hayden and Round 1982). It is represented in the form of a square matrix with rows and columns, which brings together data on production, income generation, consumption, investment and external transaction. In a SAM, incomings are indicated as receipts for the row accounts in which they are located and outgoings are indicated as expenditure for their column accounts. Since all incom-ings must be, in a SAM, accounted for the outgoincom-ings, the total of rows and columns must be equal for each account. Taylor and Adelman (1996) sees the SAM as a tabular presen-tation of the accounting identities, stating that incomings must be equal to outgoings for all sectors of the economy.
The SAM is a data system, including both social and economic data for an economy. The data sources for a SAM come from input–output table, national income statistics, and household income and expenditure statistics. Therefore, a SAM is broader than an input–output table and typical national account, showing more detail about all kinds of transactions within an economy. However, an input–output table records economic transactions alone irrespective of the social background of the transactors. A SAM, on the contrary the national accounts, “… attempts to classify various institutions to their socio-economic backgrounds instead of their economic or functional activities” (Chowdhury and Kirkpatrick 1994: 58).
1996; Pyatt and Round 1979) have extended Stone’s work to developing countries to address distribution issues of economic reforms. As a result, early SAMs were constructed for a number of developing countries such as Sri Lanka (Pyatt and Round 1979), Malaysia (Chan-der et al. 1980), Botswana (Hayden and Round 1982) and Indonesia (Thorbecke and Jung 1996). As summarized by Hayden and Rounds (1982), three principle motivations underlie compilation of SAMs. Firstly, a SAM assists us to bring together different sources of infor-mation to describe the main structural characteristics of an economy. Secondly, a SAM provides a proper accounting framework to identify the link between income distribution and different sectors of an economy. Thirdly, a SAM provides a detailed and comprehensive database to construct a computable general equilibrium (CGE) as a benchmark database.
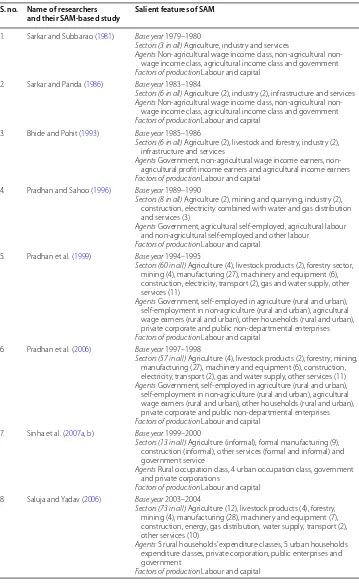
The popularity of SAM has also been recognized in many South Asian countries such as Sri Lanka (Bandara and Kelegama 2008), Pakistan and India (Pal et al. 2012). India was an early leader in compiling SAMs and developing models based on SAMs. To our best knowledge, Sarkar and Subbarao (1981) of National Council of Applied Economic Research (NCAER) constructed the first SAM for India way back in the 1980s, which provided the consistent database for their computable general equilibrium (CGE) model. Subsequently a number of SAMs were constructed over the years for Indian economy by different researchers. Table 1 provides a brief overview of the published SAMs and their salient features.
It is apparent from the above table that most of the SAMs for India have taken into account the aggregate labour and capital as primary factor input. But the labours are paid according to their level of skill and wage rates also vary across sectors. Again the factor income is key source of income for the households; disaggregation of labours and households will give detailed picture about the income distribution and source of income inequality in India. For example, the income distribution across different social groups of households depends on the amount of capital they are endowed with and the level of skilled labour they supply to different economic activities. Therefore, if a SAM can take into account more disaggregated level of factor income and its distribution across various social groups of households, it will be of intense use for understanding the causes of income inequality and poverty in the Indian economy. Moreover, if we can understand the sectorwise share of income received by various types of labour and their relationship with various types of households, it will help government to prioritize inter-ventions for poverty alleviation in India. However, the available SAMs for India as listed in Table 1 are not able to explain this phenomenon.
In this regard, the only evidence is obtained from the draft report on “Policy Dilem-mas in India: The impact of Agricultural Prices on Rural and Urban Poverty” prepared by Polaski et al. (2008). In this study, the authors have constructed a Micro SAM for India consisting of 115 sectors, 49 primary factors and 352 households. The factors of production are classified into 49 groups according to their social group (SC/ST/OBC), their education level and their sex (male/female). But the base year of this SAM is 1998– 1999 which is too old as compared to current structure of the Indian economy.
Table 1 Stylized facts of SAMs of India. Source: Pal et al. (2012) S. no. Name of researchers
and their SAM-based study Salient features of SAM
1. Sarkar and Subbarao (1981) Base year 1979–1980
Sectors (3 in all) Agriculture, industry and services
Agents Non-agricultural wage income class, agricultural non-wage income class, agricultural income class and government
Factors of production Labour and capital 2. Sarkar and Panda (1986) Base year 1983–1984
Sectors (6 in all) Agriculture (2), industry (2), infrastructure and services
Agents Non-agricultural wage income class, agricultural non-wage income class, agricultural income class and government
Factors of production Labour and capital 3. Bhide and Pohit (1993) Base year 1985–1986
Sectors (6 in all) Agriculture (2), livestock and forestry, industry (2), infrastructure and services
Agents Government, agricultural wage income earners, non-agricultural profit income earners and non-agricultural income earners
Factors of production Labour and capital 4. Pradhan and Sahoo (1996) Base year 1989–1990
Sectors (8 in all) Agriculture (2), mining and quarrying, industry (2), construction, electricity combined with water and gas distribution and services (3)
Agents Government, agricultural self-employed, agricultural labour and non-agricultural self-employed and other labour
Factors of production Labour and capital 5. Pradhan et al. (1999) Base year 1994–1995
Sectors (60 in all) Agriculture (4), livestock products (2), forestry sector, mining (4), manufacturing (27), machinery and equipment (6), construction, electricity, transport (2), gas and water supply, other services (11)
Agents Government, self-employed in agriculture (rural and urban), self-employment in non-agriculture (rural and urban), agricultural wage earners (rural and urban), other households (rural and urban), private corporate and public non-departmental enterprises
Factors of production Labour and capital 6. Pradhan et al. (2006) Base year 1997–1998
Sectors (57 in all) Agriculture (4), livestock products (2), forestry, mining, manufacturing (27), machinery and equipment (6), construction, electricity, transport (2), gas and water supply, other services (11)
Agents Government, self-employed in agriculture (rural and urban), self-employment in non-agriculture (rural and urban), agricultural wage earners (rural and urban), other households (rural and urban), private corporate and public non-departmental enterprises
Factors of production Labour and capital 7. Sinha et al. (2007a, b) Base year 1999–2000
Sectors (13 in all) Agriculture (informal), formal manufacturing (9), construction (informal), other services (formal and informal) and government service
Agents Rural occupation class, 4 urban occupation class, government and private corporations
Factors of production Labour and capital 8. Saluja and Yadav (2006) Base year 2003–2004
Sectors (73 in all) Agriculture (12), livestock products (4), forestry, mining (4), manufacturing (28), machinery and equipment (7), construction, energy, gas distribution, water supply, transport (2), other services (10)
Agents 5 rural households’ expenditure classes, 5 urban households expenditure classes, private corporation, public enterprises and government
India is 2007–2008, we have constructed the proposed SAM for the year 2007–2008. The following section describes in detail about the method construction and data sources.
3 Steps involved in constructing value‑added disaggregated SAM for the year 2007–2008
The latest official input–output (IO) table of Indian economy is available for the year 2007–2008 which consists of 130 sectors (CSO 2012). Further, this IO table has been used by Pradhan et al. (2013) to construct a SAM for India for the year 2007–2008 which consists of 78 sectors. Therefore, we have considered the 130-sector IO table, the 2007–2008 SAM, as the basis of our proposed disaggregated SAM for India for the year 2007–2008. Although the basis of our proposed SAM is the available SAM of the Indian economy for the year 2007–2008, they are significantly different in terms of the value-added disaggregation and the household classification. Our proposed SAM is an extension of the existing SAM of the year 2007–2008. As in compiling any SAM, the construction of our proposed disaggregated SAM involves a number of steps and these are explained as follows.
Step 1 Identify types of factor input and relevant data for every selected sector of SAM.
Step 2 Identify households’ classes and their source of income from various primary factors.
Step 3 Itemwise consumption expenditure of various households groups.
Step 4 Estimate sources of income other than factor income for various categories of Indian households.
Step 5 Balancing the database and consistency checks.
The detailed description of these steps is given in the subsequent paragraphs of this paper.
Table 1 continued S. no. Name of researchers
and their SAM-based study Salient features of SAM
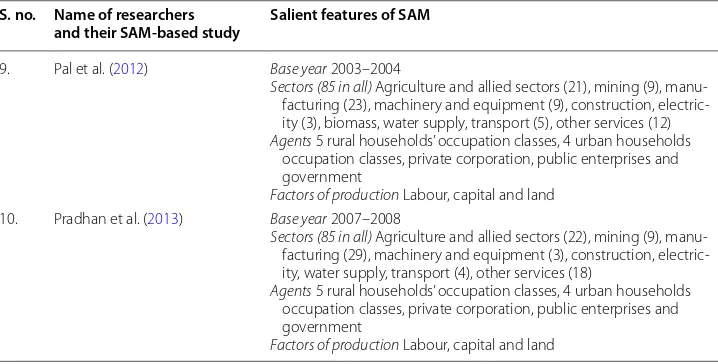
9. Pal et al. (2012) Base year 2003–2004
Sectors (85 in all) Agriculture and allied sectors (21), mining (9), manu-facturing (23), machinery and equipment (9), construction, electric-ity (3), biomass, water supply, transport (5), other services (12)
Agents 5 rural households’ occupation classes, 4 urban households occupation classes, private corporation, public enterprises and government
Factors of production Labour, capital and land 10. Pradhan et al. (2013) Base year 2007–2008
Sectors (85 in all) Agriculture and allied sectors (22), mining (9), manu-facturing (29), machinery and equipment (3), construction, electric-ity, water supply, transport (4), other services (18)
Agents 5 rural households’ occupation classes, 4 urban households occupation classes, private corporation, public enterprises and government
3.1 Step 1: identify types of factor input and relevant data for every selected sector of SAM
For the proposed disaggregated SAM, we have disaggregated only the labour input into 48 various types of labour. Here we have used region, social class, education and gender as four indicators to classify the labour input. The detail about these indicators is given in Table 2.
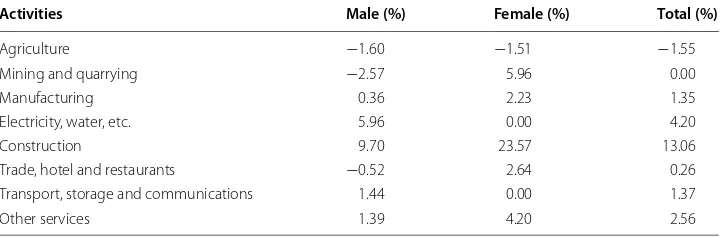
Once we classify the types of labour according to their location, social status, level of education and gender, our next task is to obtain data on payment for these types of labour by different sectors. In this case, we have estimated the distribution of labour pay-ment across the SAM sectors by using the unit-level households survey data on employ-ment and unemployemploy-ment situation in India. The National Sample Survey Organization (NSSO) of India conducts detailed household survey in every 5 years separately for consumption expenditure and employment unemployment situation in India. The 68th round survey data for the year 2011–2012 are latest available quinquennial survey data for both consumption expenditure and employment–unemployment situation in India. Prior to the 68th round survey, immediate latest quinquennial survey data are available for the year 2009–2010 (66th round) and for the year 2004–2005 (61st round). There-fore, it was challenging for us to select a database to fulfil the data need for this proposed SAM. It is also worth noting that the Indian economy has experienced 9% GDP growth during the periods from 2005–2006 to 2007–2008. Although the real GDP growth dipped down at 6.7% level in the year 2008–2009, it has reached more than 8% level and continued at that level till 2011–2012 (CSO 2012). Now with the faster economic growth between 2004–2005 and 2011–2012, structure of the economy has also changed and hence the structure of employment. Table 3 presents the compound annual growth rate (CAGR) of employment between the year 2004–2005 and 2011–2012. Table 3 shows that the employment in agriculture sector has fallen during this period at a rate of 1.55%, Table 2 Description of indicators to classify labour input
Region (2) × Social class (4) × Education (3) × Gender (2) = 48
Region Social class Education Gender
Rural Schedule caste (SC) Illiterate Male Urban Schedule tribe (ST) Up to high school Female
Other backward class (OBC) Graduate and above Others
Table 3 Sector‑specific employment growth between 2004–2005 and 2011–2012 (CAGR)
Activities Male (%) Female (%) Total (%)
whereas it has increased significantly at a rate of 13% in the construction sector. Apart from that, other sectors also experience positive growth in employment between the year 2004–2005 and 2011–2012.
Now since the base year of our proposed SAM is 2007–2008, the NSSO 61st round data will not capture the structural change happened during the golden periods of Indian economy during post-2004–2005 periods. Again as there was severe drought in India in the year 2009–2010, the 66th round quinquennial survey has been updated with 68th round survey for the year 2011–2012. Therefore, to capture the structural change in Indian economy during post-2004–2005 period, we have selected NSSO 68th round data to estimate required data for our proposed SAM of India for the year 2007–2008.
The NSSO employment survey classifies industries at the 5-digit level as described in National Industrial Classification (NIC) guideline. The households demographic and social profile data of the same survey have been first organized to classify the types of labour according to the description as mentioned in Table 3. Further, we have aggregated the industries according to their map of concordance with the sectors of our proposed SAM. In this context, the map of concordance between the sectors of our proposed SAM and the NIC 5-digit classification of industries is given in “Appendix 1”.
3.2 Step 2: identify households’ classes and their relationship with various primary factors
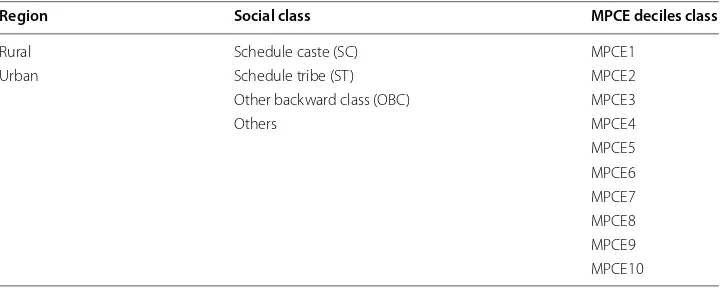
To make our value-added disaggregated SAM useful for poverty analysis, understand-ing structure of consumption expenditure across various social classes of households is important. Therefore, we have classified households into 80 different classes. In Table 4, we have listed various indicators which have been used to classify households.
After classifying households according to the above-mentioned categories of classes, we have estimated sources of income of these households from different types of labour and capital. It is also important to note that household’s typewise data on capital stocks are not readily available for Indian economy. Therefore, we have used the income of self-employed and own account category of households as proxy of the capital income. Now to estimate the capital income this way, we have cross-tabulated the NSSO 68th round employment–unemployment survey data between households categories (using demo-graphic profile) and types of labour (using status of work profile of the households). Again to obtain the income of the households from different types of labour, we have
Table 4 List of indicators to classify households
Region (2) × Social class (4) × MPCE (10) = 80
Region Social class MPCE deciles class
Rural Schedule caste (SC) MPCE1 Urban Schedule tribe (ST) MPCE2 Other backward class (OBC) MPCE3
Others MPCE4
prepared another cross-table between the household categories and the types of labour we have defined for our study purpose.
3.3 Step 3: itemwise consumption expenditure of various households groups
To complete the construction of consumption block of this proposed SAM, we have used National sample survey (NSS) 68th round data on households’ consumption expenditure. But the descriptions of commodities in these databases are different than the sectors of our proposed SAM. So to overcome this problem also, we have used the map of concordance between the NSSO items and SAM sectors as given by Pradhan et al. (2013).
3.4 Step 4 and Step 5: estimating households income from other sources and balancing the SAM
In the above-mentioned steps, we have estimated the required data for our proposed SAM especially for those accounts which make this SAM significantly different from others. Now in this step, we have completed the construction by obtaining data on households’ income other than factor income. This includes transfer income from gov-ernment, interest receive from public bonds and remittances from the abroad. To obtain these data corresponding to the different category of households, we have first taken the aggregate data from 2007 to 2008 SAM and then distributed it among the different class of households according to their share in aggregate consumption expenditure as obtained in the previous step.
Therefore, by following above-mentioned steps we have constructed a value-added disaggregated SAM for India for the year 2007–2008 which consists of 171 rows and column. The entire SAM is given as the supporting document along with this paper (Additional file 1: Appendix S1). But construction of proposed accounts for this SAM with NSSO data does not ensure that this SAM is balanced. This implies the row total is not equal to corresponding column total, because the NSSO data are obtained through primary sample survey and are available in market price, whereas data pre-sented in IO table are based on factor price. Therefore, to make this SAM balanced we have followed following two steps. First, estimate the distribution patterns for households factor income from different types of labour and itemwise consumption expenditure and sector wise labour payment using the NSSO data. Secondly, a pro-rata adjustment method has been applied to distribute the aggregated data of existing 2007–2008 SAM according the distribution pattern. Thus, we have adjusted the NSSO data with the aggregate-level data on household income, consumption expenditure and sectorwise labour payment as obtained from the existing SAM of the year 2007– 2008 to complete the construction procedure.
4 Validation of the value‑added disaggregated SAM
enterprises and net factor income from abroad. The IO table provides data on inter-industry transaction as factor price for the year 2007–2008. The available SAM of the year 2007–2008 also gives data on macroeconomic indicators in factor price. Finally the detailed consumption expenditure data are obtained from NSSO unit-level survey data of the year 2011–2012. Since we have adjusted the NSSO data to fit into our proposed SAM framework, it is also necessary to check whether the SAM loses its viability to represent the macroeconomic situation of the Indian economy for the year 2007–2008. Therefore, to validate the SAM we have extracted the data for key macroeconomic indi-cators and compared it with the officially available data for macroeconomic indiindi-cators of Indian economy for the year 2007–2008. The detail is given in Table 5.
As we observe from the above table that for most of the macroeconomic indicators the data obtained from our disaggregated SAM do not differ much with the official data available for Indian economy for the year 2007–2008. Again the maximum error is observed by 6% for net domestic transfer account. Apart from that, the exports and households savings data obtained from SAM recorded 5 and 3% error, respectively. However, the overall presentation of the above tables ensures that the disaggregated Table 5 Key macroeconomic aggregates from SAM and NAS data (trillion rupees)
SAM data NAS data Error (%)
GDP at factor cost 46.88 45.82 2.27 GNP at factor cost 46.68 45.62 2.28 PFCE at factor cost 28.29 28.41 −0.41
GFCE 5.01 5.13 −2.50
Domestic savings 18.41 18.36 0.25 Net factor income from abroad −0.21 −0.21 0.00 Net current transfer from abroad 1.68 1.68 0.00 Net domestic current transfer 3.47 3.69 −6.15 Net of taxes 4.05 4.05 0.00 Households savings 9.27 9.55 −3.02 Export 9.69 10.19 −5.14 Import 12.42 12.19 1.88 Government savings 0.23 0.23 0.00 Gross fixed capital formation 19.00 19.02 0.00
Table 6 Monthly per capita consumption expenditure obtained from SAM and NSSO 68th round survey (Rs.)
SAM data Rank NSSO data Rank
SAM is not only a balanced data set, but it represents the current macroeconomic situa-tion of the economy for the year of estimasitua-tion.
In addition to the above-mentioned macroeconomic indicators, we have also taken into account per capita consumption expenditure to check consistency in terms of their economic status of various social groups of households taken into consideration in this SAM. Table 6 describes the monthly per capita consumption expenditure of various categories of households. Here we have compared the monthly per capita consumption expenditure (MPCE) data as can be obtained from SAM with the available NSSO data of the year 2011–2012. Table 6 shows that the MPCE obtained from SAM differs from that of obtained from NSSO data, but the relative positions of each households group are same in both the cases. This is because of the adjustment of the data and the time period taken into consideration to collect the original data through primary survey. The NSSO uses consumption expenditure of the households for the month of survey as the reference for their estimation, whereas the SAM data take into account annualized value of the private final consumption expenditure. Furthermore, the NSSO data are based on current price, whereas the SAM data are on factor costs. So due to difference in method and year of estimation, one can get difference in terms of absolute numbers, but the relative position of the households as obtained from the NSSO must not vary irrespec-tive of data sources one is using for macroeconomic policy analysis. Therefore, we have adjusted the survey data in such a way that social and economic status of the Indian households does not change.
5 Application of value‑added disaggregated SAM
The purpose of constructing or extending a SAM will not be fulfilled unless we demon-strate its applicability in policy making for that country of concern. Therefore, in this section we have described some analyses using the SAM database. First, we have esti-mated the contribution of various social groups of Indian households on net domestic product (NDP) of India of the year 2007–2008. Further we have compared their con-tribution to NDP with their concon-tribution in total population of India in the year 2007– 2008. The purpose of this estimate is to understand the average productivity of various social groups of households in India. If it is found that a particular category of house-holds contributes smaller share in NDP but occupies larger share of population, it can be argued that this households group is lower productive than other group of house-holds. Secondly, we have estimated types of labour supply by the various social groups of household to understand the causes of lower contribution in NNP. Thirdly, we have estimated the Gini coefficients for rural and urban households separately to understand the level of income inequality within each social group of households. Finally, we have applied SAM multiplier model to analyse the impact of agriculture sectors growth on rural income inequality.
5.1 Contribution of households in India’s national income
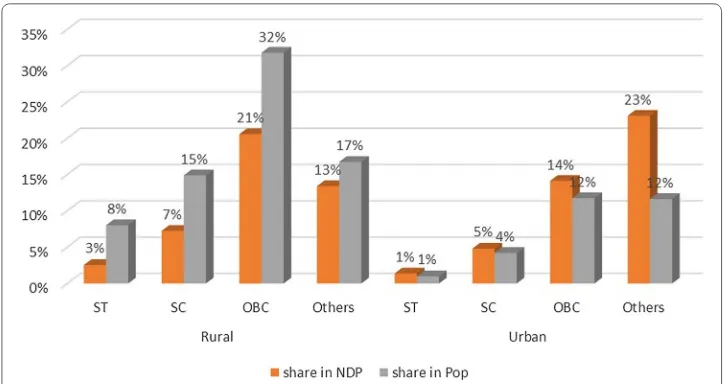
corporate and public non-departmental enterprises. In addition to estimating contribu-tion to NDP by various households groups, we have also estimated the composicontribu-tion of various social groups in India’s total population and it is superimposed in Fig. 1. Figure 1 shows that urban area in India is residence of almost 30% of her total population and contributing almost 43% of her NDP. By contrast, the 70% population lives in rural area and contributing only 44% of total NNP which is almost 30% lower than their population contribution. This scenario is quite obvious as rural economy is dependent on agricul-ture sector which is lowest contributor to GDP in India as compared to manufacturing and service sector. Again, more than half of the Indian population is based on agricul-ture sector as their primary source of livelihood. Yet again, it is interesting to observe that the gap between percentage contribution towards population and NDP is lower for the households belong to other social group in rural. According to Fig. 1, the other social group of households occupies only 17% of total population and contributes almost 13% India’s NDP in the year 2007–2008, whereas the households belong to OBC social group occupy one-third of the India’s population and contribute only 21% of India’s NDP. Thus, it can be argued from this figure that the average productivities of the rural population that belong to the social groups schedule tribe (ST), schedule caste (SC) and other back-ward class (OBC) are lower than the rural population belong of other social group. On the other hand, in urban area the percentage share in population is lower than their con-tribution to NDP across every social group. Hence, it can also be argued that the urban households irrespective of their social belonging are more productive than their rural counterpart.
Further, in Table 7 we have shown the distribution of worker across their skill. The number of workers is estimated using NSSO 68th round survey and their categoriza-tion according the level of skill is based on their level of educacategoriza-tion (see Table 7). Table 7 shows that in rural area 48% of total workers supplied by the ST category households are unskilled. In case of SC category households, the share of unskilled worker is 43% and it is 36% for the OBC category households. The share of unskilled worker in total worker for other social group households is lowest (i.e. 23%) in rural areas. However, in urban
areas the share of unskilled worker in each category of social group is lower as compared to their rural counterpart. Therefore, it can be argued from the above discussion that the source of income of the socially marginalized group in India is largely dominated by the income from unskilled worker, and hence, the average productivity is lower for these categories of households in India as shown in Fig. 1.
5.2 Analysis of income inequality across various social groups
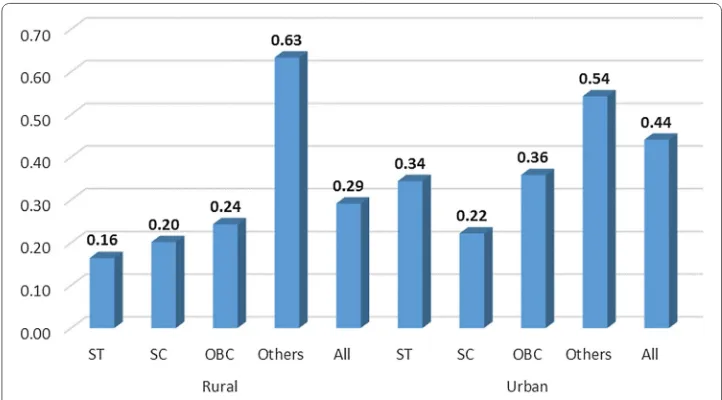
Again our value-added disaggregated SAM categorized households according to the expenditure deciles class. Therefore, the households income data presented in our value-added disaggregated SAM can be used to estimate the level of inequality across rural and urban households. In this study, we have estimated Gini coefficient as a measure of inequality and the results are shown in Fig. 2.
Figure 2 plots the Gini coefficients for different social groups of households across rural and urban area in India for the year 2007–2008. Higher value of Gini coeffi-cients explains higher level of income inequality. Here, the highest level of inequality is Table 7 Distribution of employed population (PS + SS) across various types of skills.
Source: Author’s estimate using NSSO 68th round data Households Unskilled labour
(illit-erate) (%) Semi-skilled labour (up to high school) (%) Skilled labour (graduate and above) (%) All (%)
Rural
ST 48 50 2 100
SC 43 55 2 100
OBC 36 60 4 100
Others 23 68 8 100
Urban
ST 34 56 10 100
SC 34 58 9 100
OBC 24 61 15 100
Others 9 59 33 100
observed for the urban households (0.44) than their rural (0.29) counterpart. In rural area, highest level of income inequality is observed among the other category house-holds (0.63) which is 2.5 times higher than the OBC category househouse-holds (0.24), 3 times higher than SC category households and 4 times than ST category of households. There-fore, the income inequality among the ST households (0.16) category is lowest in rural area. By contrast, the same is higher for the same social group (ST category) of house-holds in the urban area, i.e. 0.34. The lowest income inequality in urban area is observed for the SC category households (0.22). Further, it is interesting to note that the Gini coef-ficients for urban area are higher for all social groups of households that the rural areas except the households belongs to other social group. The Gini coefficient for other cat-egory of households is 0.54 for urban area as compared to 0.63 in rural areas. Now if we relate these income inequality estimates to their corresponding per capita income as shown in Table 8, we see a direct relationship between the two indicators for each group of households. Therefore, it can be argued that with the increase in per capita income the level of income inequality increases irrespective of region and social status of the households. This issue corroborates the rising part of the Kuznets curve. But at what point this level of inequality will starts falling is a crucial research question. Using the SAM multiplier model, one can further simulate with various policy options to under-stand their impact on income inequality in India. Below we have described an illustrative example of SAM multiplier analysis on the impact of growth in various crop and food processing sectors on rural income and inequality.
5.3 Impact of agricultural growth in rural income and inequality: SAM multiplier analysis
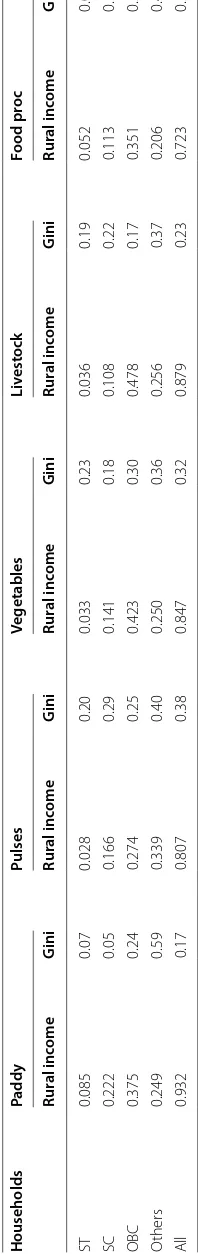
In this section, we have presented the SAM multiplier analysis to see the impact of agricultural growth on rural and income and inequality. The following table describes the cropwise impact on rural income for different types of households. The impact on income is obtained from the SAM multiplier matrix corresponding to the interaction between rows of the households and column of the economic activities. Thus, the value 0.085 for ST category households corresponding to paddy crops explains the impact on income of that particular group of households due to growth in paddy crop sector by one unit. Similarly we can explain the rural income values for each household category corresponding to various agricultural activities. Using this multiplier value, we have estimated the Gini coefficient to observe how the increase in income will be distrib-uted across various decile classes of households within each households class. Further we have also estimated the overall impact on rural income and rural income inequality. Again though we have ten various crop sectors in our SAM, we have selected few major crops for illustration purpose.
the households of those classes than the growth in other sectors. In totality, the rural income inequality will be lower, i.e. 0.17, due to growth in paddy crops than the growth in other activities reacted to agriculture and listed in this above table.
It is also interesting to observe that the growth in pulses crops will lead to overall growth in income by 0.807 unit which is lower than other farm-related activities but higher than the growth in food processing industry, i.e. 0.723. Yet again the growth in income due to growth in pulses crops leads to rise in rural income inequality (i.e. 0.38) than the growth in paddy (0.17), livestock (0.23) and even vegetables crop (0.32). Moreo-ver, growth in pulses crop leads to rise in income inequality among various social groups of households.
The SAM multiplier is a static observation for the year 2007 and is highly influenced by the social and economic structure of the Indian economy. Cereals being a principal crop in Indian agriculture (especially paddy) and paddy being the major staple food for most of the India, a large share of agricultural land is employed for this crop cultiva-tion. As a result, the growth in paddy crop leads less income inequality among the rural households in India. Further, the pulses crops are dominated in arid and dry agro-cli-matic zones in India, and due to such in equal distribution of pulses growers, the income effects also lead to rise in income inequality in Indian economy. Therefore, unless the area under pulses increases in other parts of the country the inequality in rural income cannot be reduced. In this context, Government of India has integrated pulses crop under national food security mission to promote pulses crops in India and rice fallow region of eastern India is also the prime focus for pulses production. Once achieved, we may expect reduction in income inequality within the rural area. It is also to be noted that the Indian economy has been moving through the structural transformation process since 1991, but to reduce the income inequality, a structural transformation is required within the agriculture sector with more focus towards livestock and pulses crops.
6 Conclusion
The SAM has been applied by various developed and developing countries since its inception in the academic literatures by the pioneer work by Stone (1962). India is not exception to this and it has been adopted as a policy planning tool for its government during decades of 1980s and 1990s. Despite this, limited effort has been made to extend the existing structure of a SAM with more detailed accounts so that more micro-level analyses can be done with the focus of inclusive growth. In this context, our attempt to construct a value-added disaggregated SAM for India fills the gap in macroeconomic database. Again the brief description about application of this SAM gives an overview of the social structure of the Indian economy and their contribution to the national income. Another important application of this SAM is that we have shown in this study by esti-mating Gini coefficient for each social group of households. It is also important to note here that the database presented in this SAM is robust as it is consistent with the official macroeconomic data of the Indian economy. Moreover, the analysis on income inequal-ity, using this SAM data, does not diverge from theoretical foundation of Kuznets curve as well as the reality of the Indian economy.
policy options on social inclusion and inclusive growth. The analysis can also be done to understand the impact on types of labour demand (skilled and unskilled) due to various policies. The demand of such types of analyses is crucial for the developing country such as India to guide her policy makers with suitable policy options to achieve sustainable goal. However, addressing this issue requires further research using this database.
However, constructing such a disaggregated level of SAM database is a tedious job and requires readily available data. Although we have made a challenging attempt to adjust the data obtained from different sources into a single matrix form, this task can be made more easily if Government of India can publish its IO table regularly corresponding to each NSSO rounds survey. Hence, the novelty of the SAM lies on its level of disaggrega-tion and further research is needed to make the data available and their applicability in policy making. This issue is also important for the developing country as they are plan-ning to move towards sustainable development goals.
Last but not the least, the SAM multiplier analysis can be extended by including more crops or economic economics to identify key economic activities to reduce rural income inequality as more than 70% population in India are living in rural areas. However, this analysis can be made more robust if we can have a SAM of the latest year, say, for the year 2014–2015. A latest available SAM will help us to observe the recent structural transformation and its impact on rural income inequality in India. Therefore, Indian IO table is available at a regular interval to conduct such types of robust analysis for the benefit of the scholars and policy makers across the world.
Authors’ contributions
Both the authors contributed to this article. Both authors read and approved the final manuscript.
Author details
1 International Food Policy Research Institute, NASC Complex, New Delhi 110012, India. 2 Department of Accounting, Finance and Economics, Griffith Business School, Griffith University, Building N50, Room 1.55 Nathan Campus, 170 Kes-sels Road, Nathan, QLD 4111, Australia.
Acknowledgements
We deeply express our sincere thanks to Professor Ross Guest Head, Department of Accounting, Finance and Econom-ics, Griffith University, for his kind support to make us possible to work together to prepare this paper of our research interest.
Competing interests
The authors declare that they have no competing interests.
Availability of data and materials
The entire 78-sector SAM can be made available for the readers by the publishers on request.
Consent for publication
Both the authors have consent to publish this manuscript with Journal of Economic Structure.
Appendix 1 See Table 9. Additional file
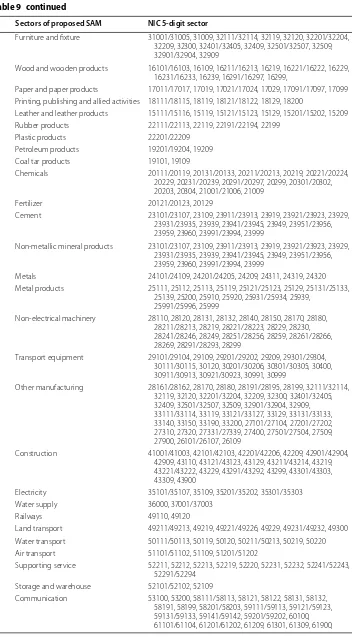
Table 9 Map of concordance between sectors of our SAM and NIC 5‑digit classification of Indian Industries
Sectors of proposed SAM NIC 5-digit sector
1 Paddy 01121/01124 2 Wheat 01111
Jowar 01112 Bajra 01112 Maize 01113 Gram and pulses 01114 Sugarcane 01140 Groundnut 01116 Coconut 01261
Other oilseeds 01115, 01117, 01118, 01119 Jute 01162
Cotton 01161
Tea 01271
Coffee 01272, 01273 Rubber 01291 Tobacco 01150
Fruits 01221/01225, 01229, 01231/01233, 01239, 01241/01243, 01249, 01251/01252, 01259, 01262, 01269
Vegetables 01131/01137, 01139
Other crops 01279, 01611, 01612, 01619, 01620, 01631/01633, 01639, 01640, 01700
Animal husbandry 01411/01413, 01420, 01430, 01441/01443, 01450, 01461, 01462, 01463, 01491/01493, 01499, 01500
Forestry and logging 02101/02102, 02109, 02201/02203, 02209, 02301/02303, 02309, 02401, 02402
Fishing 03111/03113, 03211/03214, 03215, 03219, 03221/03223, 03229 Coal and lignite 05101/05103, 05109, 05201/05203, 05209
Natural gas 06201/06202 Crude petroleum 06101/06102 Iron ore 07100 Manganese 07293 Bauxite 07292 Copper 07291
Other metallic minerals 0794/07296, 07299
Other non-metallic minerals 07210, 08101/08109, 08911/08915, 08919, 08920, 08931, 08932, 08991/08999, 09101/09104, 0900
Sugar and khandsari 10721/10729 Vanaspati 10401/10407 Tea and coffee processing 10791/10792
Processed food 10101/10109, 10201/10207, 10209, 10301/10309, 10409, 10501/10505, 10509, 10611/10619, 10621/10626, 10629, 10711/10712, 10719, 10731/10736, 10739, 10740, 10750, 10793/10799, 10801/10803, 10809
Beverages 11011/11012, 11019, 11020, 11031/11033, 11039, 11041/11045, 11049
Tobacco products 12001/12009
Textiles 13111/13114, 13119, 13121/13124, 13129, 13131/13136, 13139, 13911/13913, 13919, 13921/13926, 13929, 13931/13935, 13939, 13941/13946, 13949, 13991/13999
Table 9 continued
Sectors of proposed SAM NIC 5-digit sector
Furniture and fixture 31001/31005, 31009, 32111/32114, 32119, 32120, 32201/32204, 32209, 32300, 32401/32405, 32409, 32501/32507, 32509, 32901/32904, 32909
Wood and wooden products 16101/16103, 16109, 16211/16213, 16219, 16221/16222, 16229, 16231/16233, 16239, 16291/16297, 16299,
Paper and paper products 17011/17017, 17019, 17021/17024, 17029, 17091/17097, 17099 Printing, publishing and allied activities 18111/18115, 18119, 18121/18122, 18129, 18200
Leather and leather products 15111/15116, 15119, 15121/15123, 15129, 15201/15202, 15209 Rubber products 22111/22113, 22119, 22191/22194, 22199
Plastic products 22201/22209 Petroleum products 19201/19204, 19209 Coal tar products 19101, 19109
Chemicals 20111/20119, 20131/20133, 20211/20213, 20219, 20221/20224, 20229, 20231/20239, 20291/20297, 20299, 20301/20302, 20203, 20304, 21001/21006, 21009
Fertilizer 20121/20123, 20129
Cement 23101/23107, 23109, 23911/23913, 23919, 23921/23923, 23929, 23931/23935, 23939, 23941/23945, 23949, 23951/23956, 23959, 23960, 23991/23994, 23999
Non-metallic mineral products 23101/23107, 23109, 23911/23913, 23919, 23921/23923, 23929, 23931/23935, 23939, 23941/23945, 23949, 23951/23956, 23959, 23960, 23991/23994, 23999
Metals 24101/24109, 24201/24205, 24209, 24311, 24319, 24320 Metal products 25111, 25112, 25113, 25119, 25121/25123, 25129, 25131/25133,
25139, 25200, 25910, 25920, 25931/25934, 25939, 25991/25996, 25999
Non-electrical machinery 28110, 28120, 28131, 28132, 28140, 28150, 28170, 28180, 28211/28213, 28219, 28221/28223, 28229, 28230, 28241/28246, 28249, 28251/28256, 28259, 28261/28266, 28269, 28291/28293, 28299
Transport equipment 29101/29104, 29109, 29201/29202, 29209, 29301/29304, 30111/30115, 30120, 30201/30206, 30301/30305, 30400, 30911/30913, 30921/30923, 30991, 30999
Other manufacturing 28161/28162, 28170, 28180, 28191/28195, 28199, 32111/32114, 32119, 32120, 32201/32204, 32209, 32300, 32401/32405, 32409, 32501/32507, 32509, 32901/32904, 32909, 33111/33114, 33119, 33121/33127, 33129, 33131/33133, 33140, 33150, 33190, 33200, 27101/27104, 27201/27202, 27310, 27320, 27331/27339, 27400, 27501/27504, 27509, 27900, 26101/26107, 26109
Construction 41001/41003, 42101/42103, 42201/42206, 42209, 42901/42904, 42909, 43110, 43121/43123, 43129, 43211/43214, 43219, 43221/43222, 43229, 43291/43292, 43299, 43301/43303, 43309, 43900
Electricity 35101/35107, 35109, 35201/35202, 35301/35303 Water supply 36000, 37001/37003
Railways 49110, 49120
Land transport 49211/49213, 49219, 49221/49226, 49229, 49231/49232, 49300 Water transport 50111/50113, 50119, 50120, 50211/50213, 50219, 50220 Air transport 51101/51102, 51109, 51201/51202
Supporting service 52211, 52212, 52213, 52219, 52220, 52231, 52232, 52241/52243, 52291/52294
Storage and warehouse 52101/52102, 52109
Publisher’s Note
Springer Nature remains neutral with regard to jurisdictional claims in published maps and institutional affiliations
Received: 17 September 2016 Accepted: 23 May 2017
References
Ahluwalia MS (2002) Economic reforms in India since 1991: has gradualism worked? J Econ Perspect 16(3):67–88 Bandara JS, Kelegama S (2008) Compiling input–output (I–O) tables and social accounting matrices (SAMs) for Sri Lanka:
review of the progress, problems and the challenge. In: Senanayake SMP, Wimalaratana W, Silva AD (eds) Develop-ment perspectives: growth and equity in Sri Lanka. A Festschrift in Honour of Prof. W. D. Lakshman. DepartDevelop-ment of Economics, University of Colombo, Colombo
Bhide S, Pohit S (1993) Forecasting and policy analysis through a CGE model for India. Margin 25:271–285
Central Statistical Organization (CSO) (2012) Input–output table for India 2007–2008. Ministry of Statistics and Program Implementation, Government of India
Central Statistical Organization (CSO) (2014) National accounts statistics of India. Ministry of Statistics and Program Implementation, Government of India
Chander R, Gnasegarah S, Pyatt G, Round J (1980) Social accounts and the distribution of income: the Malaysia economy in 1970. Rev Income Wealth 26(1):67–85
Chowdhury A, Kirkpatrick C (1994) Development policy and planning: an introduction to models and techniques. Rout-ledge, London
Hayden C, Round J (1982) Developments in social accounting methods as applied to the analysis of income distribution and employment issues. World Dev 10:451–465
Table 9 continued
Sectors of proposed SAM NIC 5-digit sector
Trade 45101,45102, 45200, 45300, 45401/45403, 46101/46103, 46109, 47110, 47190, 47211/47215, 47219, 47221, 47222, 47230, 47300, 47411/47414, 47420, 47510, 47521/47522, 47523, 47531, 47532, 47591/47595, 47599, 47611, 47612, 47613, 47620, 47630, 47711/47714, 47721/47722, 47731/47739, 47740, 47810, 47820, 47890, 47911, 47912, 47990
Hotel and restaurants 55101, 55102, 55109, 55200, 55901, 55902, 56101/56104, 56210, 56291/56292, 56301/56304
Banking and insurance 64110, 64191/64192, 64199, 64200, 64300, 64910, 64920, 64990, 65110, 65120, 65020, 65300, 66110, 66120, 66190, 66210, 66220, 66290, 66301, 66302, 66309
Ownership of dwelling 68100
Education and research 85101/85104, 85109, 85211/85213, 85221/85223, 85301/85307, 85410, 85420, 85491/85494, 85499, 85500, 72100, 72200, Medical and health 86100, 86201/86202, 86901/86906, 86909, 87100, 87200, 87300,
87900
Business service 69100, 69201/69202, 70100, 70200, 71100, 71200, 73100, 73200, 74101/74103, 74109, 74201/74204, 74209, 74901/74904, 74909
Real estate 68100, 68200
Other service 62011/62013, 62020, 62091, 62092, 62099, 63111/63114, 63119, 63121, 63122, 63910, 63991/63992, 63999, 75000, 77100, 77210, 77220, 77291/77294, 77299, 77301/77309, 77400, 78100, 78200, 78300, 79110, 79120, 79900, 80100, 80200, 80300, 81210, 81291, 81292, 81299, 81300, 82110, 82191, 82192, 82199, 82200, 82300, 82910, 82920, 82990, 88100, 88900, 90001/90006, 90009, 91010, 91020, 92001, 92002, 92009, 93110, 93120, 93190, 93210, 93290, 94110, 94120, 94200, 94910, 94920, 94990, 95111, 95112, 95120, 95210/95222, 95230, 95240, 95291/95295, 95299, 96010, 96020, 96030, 96091/96092, 96903/96908, 97000, 98100, 98200, 99000
Kotwal A, Ramaswami B, Wadhwa W (2011) Economic liberalization and Indian economic growth: what’s the evidence? J Econ Lit 49(4):1152–1199
NSSO (various rounds), Employment and unemployment situation in India, Ministry of Statistics and Program Implemen-tation, Government of India
NSSO (various rounds), Employment and unemployment survey database, Ministry of Statistics and Program Implemen-tation, Government of India
NSSO (various rounds), Households consumption expenditure database, Ministry of Statistics and program Implementa-tion, Government of India
Pal BD, Pohit S, Roy J (2012) Social accounting matrix for India. Econ Syst Res 24:77–99
Polaski S, Panda M, Gangesh Kumar A, McDonald S, Robinson S (2008) Policy dilemmas in India: the impact of agricul-tural prices on rural and urban poverty. Indira Gandhi Institute of Development Research, Mumbai June 2008, WP-2008-012
Pradhan, B. K. and A. Sahoo (1996), “Social Accounting Matrix and Its Multipliers for India”,Margin, Vol. 28 (2), Jan-May. Pradhan BK, Sahoo A, Saluja MR (1999) A social accounting matrix for India 1994-95. Econ Polit Wkly 34(48):3378–3394 Pradhan BK, Saluja MR, Sharma AK (2013) A social accounting matrix for India 2007–08, IEG Working Paper No. 326,
Insti-tute for Economic Growth, New Delhi, India
Pradhan BK, Saluja MR, Singh SK (2006) Social accounting matrix for India: concepts, construction and applications. Sage Publications, New Delhi
Pyatt G, Roe A (1978) Social accounting for development planning with special reference to Sri Lanka. Cambridge Univer-sity Press, Cambridge
Pyatt G, Round JI (1979) Accounting and fixed price multipliers in a social accounting matrix framework. Econ J 89:850–873
Hayden C, Round JI (1982) Developments in social accounting methods as applied to the analysis of income distribution and employment issues. World Develop 10(6):451–465
Saluja MR, Yadav B (2006) Social accounting matrix for India 2003–2004. http://planningcommission.nic.in/reports/sere-port/ser/sr_sam.pdf
Sarkar H, Panda M (1986) Quantity-price money interaction in a CGE model. Margin 18:31–47
Sarkar H, Subbarao SV (1981) A short term macroforecasting model for India: structure and uses. Ind Econ Rev 16:55–80 Sinha A, Siddiqui KA, Munjal P (2007a) A SAM framework for the Indian informal economy. Oxford University Press, Oxford Sinha A, Siddiqui KA, Munjal P (2007b) A SAM framework for the indian informal economy. In: Harriss-White B, Sinha A
(eds) Trade liberalization and India’s informal economy. Oxford University Press, New Delhi, pp 233–306 Stone R (1962) A social accounting matrix for 1960. Volume 2S in a programme for growth. Chapman and Hall, London Taylor J, Adelman I (eds.) (1996) Village economies. Cambridge University Press, Cambridge