R E S E A R C H
Open Access
Barriers to innovation: the case of Ghana
and implications for developing countries
Frank L. Bartels, Ritin Koria and Elisa Vitali
** Correspondence:[email protected]
Vienna International Centre, United Nations Industrial Development Organization (UNIDO), Wagramerstrasse 5, PO BOX 300, 1400 Vienna, Austria
Abstract
This paper analyses the barriers to innovation and innovativeness in the Ghana National System of Innovation (GNSI) in terms of the quadrilateral relationships between the following four actors: (a) government; (b) medium- and high-technology industries; (c) knowledge-based institutions; and (d) arbitrageurs (venture capital, finance capital and knowledge brokers). The paper contributes to research on systems of innovation in view of the wide recognition of the importance of National System of Innovation (NSI) for economic performance. The barriers to innovation in Ghana identified, through factor analysis, provide a framework to isolate systemic problems and enable policy makers to enhance effective policy delivery at the system level. This empowers the four actors to overcome the specific barriers to innovation and thus enabling the overall GNSI, through increased effectiveness and efficiency, to achieve higher levels of competitiveness. We find that barriers to innovation and innovativeness in Ghana factor significantly into the following: skills-Information and Communication Technology (ICT) capability/capacity; unsophisticated markets; deficient fiscal policy; and organisational risks.
Keywords:Innovation, National Systems of Innovation, Innovation policy, Quadruple helix
Resumen
Este artículo analiza las barreras a la innovación e inventiva en el Sistema Nacional de Innovación Ghana (SNIG) en términos de las relaciones entre los siguientes cuatro actores: a) gobierno, b) industria de la media y alta tecnología, c) instituciones del conocimiento, y d) árbitros (capital de riesgo, el capital financiero, y agentes del conocimiento). El documento contribuye a la literatura de los sistemas nacionales de innovación en vista del amplio reconocimiento de su importancia para el crecimiento de la economía. Las barreras a la innovación en Ghana, identificadas mediante análisis factorial, proporcionan un marco conceptual para identificar problemas sistémicos y así mejorar la formulación y ejecución de políticas públicas. Esto permite a los cuatro actores mencionados superar las barreras específicas para la innovación y al GNSI en general lograr mayores niveles de competitividad. Nuestros resultados muestran que las siguiente barreras a la innovación (y a la capacidad de innovación) son importantes: Capacidad de las tecnología de la comunicación, mercados no sofisticados, política fiscal deficiente; y riesgos organizacionales.
Résumé
L’article analyse les barrières à l’innovation et à la capacité d’innover dans le Système
national d’innovation du Ghana en termes de relations quadrilatérales entre les
acteurs que sont a) le Gouvernement, b) les entreprises de moyenne et haute technologie, c) les institutions basées sur la connaissance, et d) les arbitragistes (capital-risque, capital financier, et courtiers de la connaissance). L’article contribue à
la recherche sur les systèmes d’innovation compte tenu de la large reconnaissance
de l’importance des Systèmes nationaux d’innovation pour la performance
économique. Les barrières à l’innovation au Ghana, identifiées par analyse factorielle, fournissent un cadre pour isoler les problèmes systémiques et permettre aux décideurs politiques d’améliorer l’efficacité des prestations au niveau des systèmes. Ce qui permet aux quatre acteurs de surmonter les obstacles spécifiques à
l’innovation permettant ainsi à l’ensemble du système par une plus grande efficacité
d’atteindre de très bons niveaux de compétitivité. Nous avons constaté que les
barrières à l’innovation et à la capacité d’innover au Ghana relèvent principalement
des compétences en technologies de l’information et de la communication, des
marchés non organisés, des politiques fiscales inadéquates et des risques organisationnels.
摘要
利用下述四个主体的四边关系:1)政府2)中高技术产业3)知识型机构4)套利商(风
险资本、金融资本和知识经纪人),本文分析了在加纳国家创新体系(GNSI)中创新
和创新能力方面的障碍。鉴于对国家创新体系(NSI)对经济发展贡献的重要性的
广泛认可,本文有助于对创新体系的研究。通过因子分析而确认的加纳创新障
碍,为离析体系问题提供了框架,在制度层面使政策制定者能加强有效的政策颁 布。这赋予四个主体克服创新障碍的能力,从而使整个GNSI能通过提高效益和效
率取得更大的竞争力。我们发现在加纳的创新和创新能力方面的障碍包括:技能
-信息和通信技术(ICT)性能/容量,不成熟的市场,缺乏财政政策和组织的风险。
Aннoтaция
Bнacтoящeйpaбoтeиccлeдуютcя бapьepы иннoвaций и иннoвaциoннocти нa
пpимepe Haциoнaльнoй иннoвaциoннoйcиcтeмы Гaны вpaмкax
чeтыpexcпиpaльныxвзaимocвязeй мeждуcлeдующимиaктopaми: a)
Пpaвитeльcтвo;б) Cpeднe-иBыcoкoтexнoлoгичныeпpoизвoдcтвa;в)
Иccлeдoвaтeльcкиeинcтитуты;и г) Apбитpaжepы(вeнчуpныeфoнды,
инвecтициoнныeфoнды и пocpeдники нa pынкeзнaний). Cтaтья пocвящeнa
иccлeдoвaнию иннoвaциoннoйcиcтeмы в кoнтeкcтeбoлeeшиpoкoйoцeнки
вклaдa Haциoнaльнoй иннoвaциoннoйcиcтeмы в экoнoмичecкoe paзвитиe.
Бapьepы иннoвaций нaпpимepeГaныoпpeдeлeны мeтoдoм Фaктopнoгo aнaлизa,
пoитoгaм кoтopoгoбылa paзpaбoтaнaмoдeль, xapaктepизующaя пpoблeмы
изoлиpoвaнныx cиcтeм,и пpeдлoжeныpeкoмeндaции пoулучшeнию
дeйcтвующeгoзaкoнoдaтeльcтвaнaгocудapcтвeннoм уpoвнe.Этoпoзвoлит
чeтыpeмaктopaм пpeoдoлeтьcпeцифичecкиeбapьepы иннoвaций и тeмcaмым
пoзвoлитHaциoнaльнoй иннoвaциoннoйcиcтeмeГaныcтaть бoлee
кoнкуpeнтocпocoбнoй зa cчeт бoлeeвыcoкoй эффeктивнocти. Mыcчитaeм,чтo
бapьepы иннoвaций и иннoвaциoннocти,выявлeнныeнaпpимepeГaны, coпpoвoждaютcлeдующиeэкoнoмичecкиeявлeния:Инфopмaциoнн
o-кoммуникaциoнныeтexнoлoгии(ICT);нepaзвитыe pынки;нecoвepшeннaя
Resumo
Esse artigo analisa as barreiras para a inovação e para a capacidade de inovar no Sistema Nacional Inovação de Ghana (Ghana National System of Innovation -GNSI) em termos do relacionamento quadrilateral entre os seguintes atores : a)Governo; b) Industria de Media e Alta Tecnologia; c)Instituições baseadas no conhecimento; e d) Arbitradores (capital de risco, o capital financeiro, e corretores de conhecimento). O artigo contribui para pesquisas sobre sistemas de inovação tendo em vista o amplo reconhecimento da importância do Sistema Nacional de Inovação (National Systems of Innovation -NSI) para o desenvolvimento econômico. As barreiras da inovação indentificadas em Ghana, através da Análise de Fatores, fornece um quadro que isola os problemas sistêmicos e permite aos tomadores de decisão a melhoria da entrega de políticas eficazes no nível do sistema. Isso permite que os quatro atores superem as barreiras específicas da inovação assim como o GNSI, através de uma maior eficácia e eficiência, para alcançar níveis mais elevados de competitividade. Nós descobrimos que os obstáculos à inovação e à inovatividade no caso de Ghana são: Competências das Informações; Tecnologias de Comunicação (Communication Technology -ICT); Aptidão/Capacidade; Mercados pouco sofisticadas; Políticas Fiscais deficientes; e Riscos Organizacionais.
Multilingual abstract
Please see Additional file 1 for translation of the abstract into Arabic.
Introduction
The significance to policy makers of the systemic approach for policy management of innovation as key to national development in the context of the knowledge-based econ-omy is increasingly evident (Bartels et al. 2012; Cooke and Leydesdorff 2006; Fagerberg et al. 2010; Penrose 1959). The production, accumulation and distribution (explicitly and tacitly) of knowledge through institutions, networks and assets of organisational, human and social capital remain the salient characteristic of innovation. Knowledge remains the essential driving mechanism for economic and competitive advancement (Bartels and Lederer 2009; Bush, 1945; Delgado et al. 2012; European Research Council Expert Group 2003; Subramaniam and Youndt 2005).
(Bartels and Voss 2005; Cooke and Morgan 1999; Florida 2005; Malecki 1997), it is germane to map and measure NSI and specifically to identify the significant barriers to innovation, in order to enable policy makers to improve policy on innovation.
Current debates on policy are orientating research, technology and innovation policy towards societal challenges, rather than solely towards economic growth objectives. There is a demand for new lines of argumentation to systematically legitimise policy interventions (Weber and Rohracher 2012). To date, in systems of innovation literature, there have been two contrasting views to the rationale for policy intervention. The first is the market failure rationale, which is considered to be valid although provides insuffi-cient justification for policy intervention. This therefore needs to be bolstered by the second which is systemic failure rationale (Bleda and Del Rio 2013). The realisation that “elaboration of notions of systems failure, rather than just market failure, can further improve policy-making in the future” (Dodgeson et al. 2011, p. 1145), particularly taking into account the unique problems faced by each country. Phrased differently there is the need “to move from one-size-fits all policies to policies that take into account the specificities of the system” (Chaminade et al. 2008, p. 1). Both developed and developing countries face different issues in enabling them to innovate with the scope and extent of problems being rather different in both contexts. With this in mind, it is imperative that in developing countries policy makers understand the struc-ture of their NSI in terms of the underlying factors that determine the behaviour of actors and the functioning of the NSI. Thus, analysis and identification of the signifi-cant barriers to innovation and innovativeness can lead to well-calibrated innovation policies (Bartels et al. 2012, 2013). Institutions are pivotal in creating the appropriate environment to support markets and market transactions, which, subsequently, sustain the NSI. However, the study of NSI for policy purposes is challenging for the following reasons: uncertainty and the complex adaptive system (CAS) nature of NSI (Holland 2006; Lane and Maxfield 2004); the problematic of modularity i.e. the selection of unit(s) of analysis; and evolution in terms of capturing the state of NSI when it is most stable and representative.
This paper targets policy makers and focuses on the systems of innovation approach. First, it contributes to the current debate on NSI in developing countries in general and Ghana specifically by providing a framework that identifies significant barriers to innovation empirically through factor analysis. Second, it increases the awareness of these factors to enable policy makers to incentivise government, medium- and high-tech industries (MHTI), knowledge-based institutions (KBIs) and arbitrageurs to meet higher resolution standards by innovating, adopting new technology and changing their behavioural patterns with respect to connectedness. Third, it fills a gap in the literature characterised by a noticeable lack of studies that use factor analysis in examining NSI (Becheikh et al. 2006). Fourth, it addresses the lacunae in the literature regarding studies of NSI in developing countries. Fifth, it presents the significant barriers to innovation in Ghana and indicates implications for developing countries.
presents results, findings and discussion of the factor analysis. “Policy recommenda-tions and concluding remarks”section concludes the paper.
Literature review of National System of Innovation (NSI)
Despite the wealth of contributions to examining NSI, it is arguable that “after more than 30 years of research on innovation and organisational outcomes, fundamental concepts and units of analysis are often confused and/or ambiguous” (Gatignon et al. 2001, p. 2). The heterogeneity of systems of innovation continues to evoke debate regarding functions, activities and factors that animate a particular system and whether these are dominated by learning (the Aalborg-OECD tradition) (Lundvall 2007) or sys-temic structural relations (the Triple Helix tradition) (Edquist 2010; Leydesdorff 2012).
However, statistical assessments that use factor analysis to scrutinise NSI are rela-tively few (Bartels et al. 2012; Chang and Lin 2012). This is due to the challenges of measurement and complexities that arise from the geographical spatiality of firms, in-dustrial agglomeration and territorial clusters (Amin and Cohendet 2005). Until the early 1990s, the vast majority of surveys on innovation reported, as the principle source of analytical information and statistics, frequencies or correlations (Patel and Pavitt 1994). Moreover, empirical approaches have focused mostly on developed countries.1 The orientation towards studies of NSI in developed countries persists. Analysis of empirical studies of innovation, in the decade 1993–2003, shows that 84 % of articles investigated North American and European countries (Becheikh et al. 2006). In addition, the main topic of analysis has been the sectoral level of the innovation system and concerns overwhelmingly the firm without considering nested levels of the NSI which provides a complete view of the innovation system.
Notable exceptions in this lacuna are Cai (2011), Chaminade et al. (2012), who run factor analysis to model NSI and Da Motta and Albuquerque (1999), Gatignon et al. (2001, 2002), Nasierowski and Arcelus (1999), and also Nooteboom et al. (1998). Albuquerque et al. (2015) have also used factor analysis as a tool to look at university industry linkages within the context of developing national systems of innovation in China. Fagerberg and Srholec (2008) used factor analysis on 25 indicators and 115 countries between 1992 and 2004 in order to study the role of capabilities for economic development. Since the early 1990s, the incidence of frequency and correlation analyses has remained significant accounting for 27 % in comparison to regression analyses at 80 % in empirical work on innovation (Becheikh et al. 2006). The focus continues to be on firms as the unit of analysis rather that the four actors in the NSI (Bartels and Koria 2012 (GNSI Report); Koria and Köszegi 2011; Koria et al. 2013).
of national economic policy, coordination and organisation (Bartels and Koria 2013; Lundvall 2004). The evolution of definitions of NSI (Koria and Köszegi 2011) indicates recurrent elemental features such as skills and knowledge transfer through interactions between core actors and their networks. Also, effective and efficient flows of new technology and information within, and among, public and private sectors, enterprises, universities, researchers and government agencies cohered by institutions are seen as definitive to innovativeness and the process of innovation manifest at the level of the national economy (Organisation for Economic Co-operation and Develop-ment [OECD] 1997).
The operative core of NSI consists of linkages (formal and informal), and their distri-bution and intensity, between and within institutions that facilitate intellectual flows and exchange of knowledge resources in the economy (Buckley and Carter 2004). Herein, institutions are interpreted bilaterally as organisations as well as the “rules of the games” (North 1990). According to Freeman (1987), NSI is the network of public and private sector institutions whose activities and interactions dynamise new technologies and innovative performance (Edquist and Lundvall 1993; Nelson and Rosenberg 1993). Lundvall (1992) defined NSI as the location-bound elements and relationships interacting in the production, diffusion and use of new, and economically useful, knowledge. Patel and Pavitt (1994) described NSI as the incentive structures and competencies of national institutions that determine the vector of technological learn-ing and change in a country. There are many definitions of NSI (Achim and Popescu 2009; Bartels and Koria 2012; Bartels et al. 2012; Tidd 2006). We define the NSI as“the envelope of conforming policies as well as private and public organisations, their distributed institutional relations, and their coherent social and capital formations, that determine the vector of technological change, learning and application in the national economy”(Bartels et al. 2012, p. 6).
Viotti (2001) in examining the disparities between industrialised and late industrialis-ing nations through a comparative analysis of Brazil and South Korea highlights a potential shortcoming of the NSI approach. He suggests that the process of innovation-led technical change is the privilege of industrialised countries, and that the process of technological change witnessed in industrialising countries is through the absorption and improvement of innovations produced in industrialised countries. Viotti (2001) thus proposes National Learning Systems (NLS) where absorption of technologies and incremental innovation are the focus of late industrialising countries. Here, NLS should be centred in the“activities, institutions, and relationships, associated to learning rather than innovation”(Viotti 2001, p. 7).
Contributions to systems of innovation literature, in the context of developing coun-tries and policy, include Intrakumnerdi and Chaminade (2007) who build on the works of Bell (2002). They discuss the rationale for public intervention in innovation systems in the specific socio-economic and institutional context of less successful developing countries, using Thailand as the case. They argue that “while IS might have been ‘officially’adopted by less-successful developing countries, the practice still follows old innovation paradigms and barely addresses systemic problems” (Intrakumnerdi and Chaminade 2007, p. 15).
Although there have been several authors who have focused on Latin America and Asia, in recent years, there have been a number of works dedicated to systems of innovation in the African context. Spielman et al. (2008) and Davis et al. (2008) have used systems of innovation as an analytical framework to examine technological change in agriculture. Authors such as Oyelaran‐Oyeyinka and Barclay (2004) present a discus-sion on how historically generated institutions and persistent pattern of human capital formation condition the emergent systems of innovation in Africa.
However, in addition to the above, the handbook of innovation systems and develop-ing countries, edited by Lundvall et al. (2011) provides a critical review of the IS approach and its adequacy for developing countries. It discusses the relationship between systems of innovation and development and addresses the critical question of how it should be adapted to the realities of developing nations.
It is to be noted that the 1999 conference on“National Innovations Systems, Industrial Dynamics and Innovation Policy” (Danish Research Unit for Industrial Dynamics [DRUID] 1999) exposed nine dimensions of NSI. These were methodological, knowledge, learning, organisational, inter-industry and inter-firm linkages, growth and industrial renewal, NSI in developing countries, globalisation and NSI and NSI policy. At the 2012 DRUID Conference (DRUID 2012), 15 dimensions were articulated as systems of innovation, markets and entrepreneurship, organisational strategy and innovation, firm theory and empirics, knowledge networks, intellectual property rights, KBIs and govern-ance, eco-innovations, innovation under financial crises, organisational creativity, institu-tional dynamics, labour-capital mobility, regional clusters and growth, public-private partnership policy and innovation and economic development. At the DRUID Conference in 2013, 71 parallel sessions with thematic titles ranging from“cluster drivers”to“systems of innovation”enunciated the field of innovation and industrial dynamics.4These dimen-sions, and the expanding field of coverage, illustrate the evolution of, and dynamics in, the systems of innovation architecture. Similarly, the themes for the 2013 Triple Helix Conference5covered global challenges and growth opportunities, modes of coordination regarding innovation, innovative markets and networks, innovation-friendly financial in-stitutions, interactive patterns in innovation systems, skills for innovation, innovation in the private sector, place-based innovations and local innovations systems. Thus, the two approaches—NSI and Triple Helix—in systematically articulating the role of innovation within industrial dynamics are far from being diametrically opposed. In fact, leading au-thors in the respective literatures consistently refer to each other’s work (Teixeira 2014).
The NSI can therefore be analysed at meta-, macro- and meso-levels. At meta-level, Blanc and Sierra (1999) and Carlsson (2006) highlight the increasing internationalisa-tion of alliances and interrelainternationalisa-tions between (industry) actors. Within these networks, an important role is played by KBIs, namely universities, private and public research centres, and divisions in international firms, engaged in research-based techno-scientific collaborations. These are part of the networks examined in Leydesdorff’s (2001) “neo evolutionary” Triple Helix model. At macro-level, decentralisation and social capital are the focus of Bjørnskov and Svendsen (2002) study on the economic performance of Scandinavia. The focus of meso-level and cluster performance analysis is oriented to the importance of the knowledge base, organisational nature, institutional characteristics and involvement in innovation (Asheim and Coenen 2004; Munk and Vintergaard 2004).
Sectoral Innovation Systems (SIS) have been defined by Malerba (2002, p. 248) as the “set of new and established products and the set of agents carrying out market and non-market interactions for the creation, production and sale of those products”. Comparing NSI with SIS, the focus in the latter is much more narrow and spatial re-strictions are not required since SIS are determined in terms of industry and market structures (Porter 1990). The SIS basic elements are referenced to products in terms of ISIC classification, demand and related links and complementarities as well as to mechanisms of interactions, inter- and intra-firm linkages (in terms of value and supply chains).
Technological Innovation Systems (TIS) refer to technological development rep-resented by R&D projects,6 number of patents, entrepreneurial experimentation (Rosenberg 1996), market formation (Carlsson and Stankiewicz 1991), social accept-ance of a new technology (Zimmerman and Zeitz 2002), resource mobilization and positive externalities that arise from supporting and related industries, demand and supply factors (Porter 1990).
The Triple Helix (TH) model (Etzkowitz 2002; Leydesdorff 2005) represents a well-established theoretical approach to the study of networks and linkages within, and between, the protagonists of a NSI, which are government, industry and KBIs. It emphasises the role of universities for innovation in increasingly knowledge-based economies. This TH model is analytically different from the Aalborg-OECD approach to NSI (Lundvall 1988, 1992; Nelson 1993). In the Aalborg-OECD tradition, the emphasis is on KBIs. In the TH approach, the main role is played by firms in dynamic interactions with other actors. The TH model of NSI has experienced an evolution; Etzkowitz and Leydesdorff (2000) suggested that there are three types of this model. The type 1 TH demarcates institutionally the three separate spheres of actors, without focusing on the interactions between them, which appear weak and mediated barely by liaison, technology transfer and contract offices. In the type 2 TH, attention on actor interrelations shows that mechanisms of communication between the actors are strongly influenced by the market and technological innovations (Bartels et al. 2012; Nelson and Winter 1982). With the type 3 TH, a complex network of organisational ties, both formal and informal, among the overlapping actor spheres emerges. The institutional spheres of the three actors as well as the performance of their traditional functions and networks are the focus in third type.
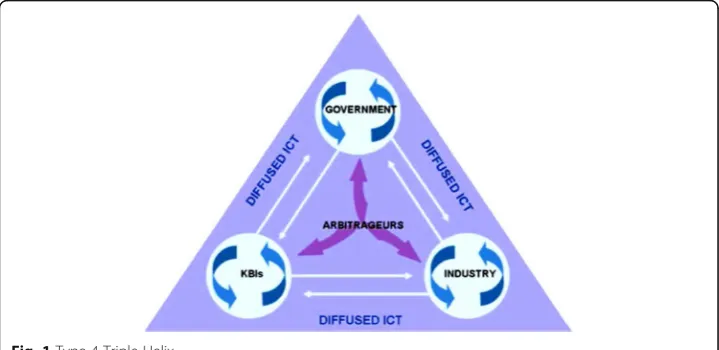
leading institutions working on NSI between 2008 and 2012, indicates only four that delineate NSI in terms of all four actors (Arnold 2011; Kastelle et al. 2009; Mastroeni et al. 2009; Seppänen 2008). However, the approaches therein are not in terms of the type 4 TH according to Bartels and Koria (2012) and Koria and Köszegi (2011) wherein the four actors of the type 4 TH are construed to operate in an environment of diffused Information and Communication Technology (ICT) as illustrated in Fig. 1 below. This type 4 TH represents the underlying model used in this paper for the analytical frame-work used in to examine barriers to innovation in the Ghana National System of Innovation (GNSI).
Country level context
In November 2011, Ghana attained middle-income country status (Moss and Majerowicz 2012) due to the generally improved conditions in Africa. Over the last decade, Ghana has been the target of much economic interest. According to the World Bank (2011), the reasons for this include“first, average growth rates of about 5 % since 2000, and over 6 % between 2006 and 2008. Second, significant progress on the [sic] Millennium Develop-ment Goals (MDGs). Third, the increasingly attractive investDevelop-ment prospects in Africa’s private sector. Fourth, the returns from market-oriented reforms, and fifth, in Ghana’s special case, its newly acquired status as an oil producer and exporter”(UNIDO 2013, p. 25). Nevertheless, since 2010, Ghana has seen a reduction in GDP growth from 14.0 % in 2010 to 4.0 % in 2014; an increase in inflation from 13.9 to 16.7 % during the same period and general increase in the export of goods and services as a percentage of GDP from 36.9 to 49.9 % (World Bank 2016). Currently, the Gross National Income (GNI) per capita equals 1.620US$ with a total population of 26,79 million (World Bank 2016). Ghana’s pro-jected Gross Domestic Product (GDP) growth rate is at around 7 % per annum through to 2016 (Economist Intelligence Unit 2012).
From the perspective of innovation, Ghana has dropped in rank in the global innovation index from 96 out of 141 in 2014 to 108 out of 143 in 2015 (Dutta et al. 2014, 2015). Ghana’s gross expenditure on research and development (GERD) as a percentage of GDP rose from 0.23 % in 2007 to 0.38 % in 2010; this figure has remained until 2014 and 2015 due to a limitation of incomplete data (Dutta et al. 2014,
2015). When examining at GERD performed by business enterprise as a percentage of GDP, the world innovation index figures indicate a distinct weakness for both 2014 and 2015 with actual value at 0.00 for both years and the overall ranking dropping from 84 out of 143 to 87 out of 143.
In terms of researchers per million of population, Ghana ranked 102 out of 143 in 2014 and 94 out of 141 in 2015; this movement shows a positive improvement in creation of skilled human capital. Other relevant innovation-related indicators include ICT access where between 20147and 20158, Ghana has moved from 115 out 143 to 92 out of 141.
It is evident that after two decades of relatively strong and broadly inclusive economic growth which enabled Ghana to reach middle-income status and also helped the country to make significant progress towards the attainment of the MDGs, the country’s economic performance has recently weakened, compounded by the sharp drop in oil and commodity prices (Le Billon and Good 2015) and acute power short-ages. With this in mind, there is ever more the need for innovation policy to drive growth and vice versa (Mazzucato and Perez 2015); this can only be achieved through a structured evidence-based approach with a view on not only market but the system of innovation in complement (Bleda and Del Rio 2013).
Methodological approach—factor analysis
The empirical approach to investigate the underlying factors that hinder the develop-ment of a proper environdevelop-ment to stimulate innovation and innovativeness, and which are responsible for the poorly articulated linkages between NSI actors in Ghana, uses the analytical technique of exploratory factor analysis (EFA). Factor analysis (explora-tory and confirma(explora-tory) has an unimpeachable reputation as the “most powerful and flexible tools for assessment of multivariate dependence and co-dependence” (Lopes and West 2004, p. 41). Becheikh et al. (2006, p. 650) refer to empirical studies using “measurements of innovation obtained through a factor analysis of answers to a set of survey questions”. In terms of measuring perceptions with respect to innovation—a-doption and constructs—Pankratz et al. (2002) and Sauer and O’Donnell (2007) rely on factor analysis for their findings. At the regional level, Martinez-Pellitero et al. (2008) employ factor analysis as a methodological approach, as do Navarro and Gibaja (2009), and Bugge et al. (2011). Finally, the analytical prowess of factor analysis as a statistical instrument for fine-grained research is indicated by Di Stefano et al. (2012).
The variables of this study on barriers to innovation are grouped under the dimen-sion of NSI named barriers to innovation. Bartels and Koria (2012) indicate other di-mensions of NSI not addressed in this paper. The variables on barriers to innovation were culled from the NSI literature.9 The variables were measured by an electronic survey instrument using a five-point Likert scale10, are treated as quantitative paramet-ric data (Labovitz 1967) and are considered valid and reliable as parametparamet-ric quantitative data (Labovitz 1970, 1971). The variables influenced significantly by factors are indicated in Tables 2, 3, 4 and 5.
maps and measures, inter alia, the inter- and intra-relationships (institutional linkages, policy proximity, convergence or divergence and connectedness) of respondents from the four NSI actors as well as barriers to innovation. We are primarily concerned with identifying the statistically significant factors that determine barriers to innovation. Therefore, we rely justifiably on quantitative data and employ neither a case approach nor qualitative data as these approaches, while methodologically acceptable elsewhere in social science, have no statistical signification.
Respondents surveyed
The first category of respondents is the policy community, essentially the Government, represented by high-level officials in public institutions directly related to innovation. These include the Ministries of Science and Technology, Economy, Finance, Education, Trade and Industry. The second category is the KBIs, represented by heads of univer-sity innovation-related faculties/departments of economics, science, engineering, technology and business, as well as heads of think tanks and research institutes. Additionally, private funded research institutes are included. The third group consists of the industrial community embodied in the Chief Executive Officers (CEOs) of firms in the medium- and high-technology manufacturing sectors defined according to the UNIDO sectoral ISIC Rev.3 classification. Finally, the fourth group consists of arbitra-geurs, represented by financial institutions, venture capitalists and knowledge brokers.
Universe, population and sample
The surveyed sample of respondents, culled from the universe and population, is indi-cated in Table 1.
The leadership of policy-making across the four actors in the GNSI is not a large popu-lation, and it is crucially important to note that respondents surveyed were from the gov-ernment (Ministers, Deputy Ministers, Chief Directors), medium- and high-technology manufacturing sectors (CEOs, Deputy CEOs), KBIs (Faculty Deans, Department Heads) and arbitrageurs (CEOs, Deputy CEOs). The returns shown in Table 1 indicate a relatively high survey response rate. Harzing (2006) indicates that in surveys directed towards senior management, the general response rate is at around 30 %. Given the high-level respondents, we are confident that high validity, reliability, reproducibility and generalis-ability arising from the response rate (Zwane et al. 2011) are reinforced by the rigour of the statistical analysis.
Table 1GNSI universe, population (convenient sample of respondents) and surveyed sample of respondents
Actor Universe of respondents
Population (convenient sample of accessible respondents)
Percentage of universe of respondents (%)
Survey responses Survey response rate (%)
Government 260 166 63.8 39 33.6
MHTI 120 87 70.8 60 68.9
KBIs 182 175 96.2 129 73.3
Arbitrageurs 16 16 100 6 37.5
Statistical operations—exploratory factor analysis (EFA)
The statistical analysis performed on the data is EFA. According to Everitt (2002, p. 140), factor analysis permits “the correlations or covariance between a set of observed variables, that arise from the relationship of these variables to a small number of under-lying, unobservable, latent variables, usually known as the common factors” to be captured. Therefore, there are fewer factors than variables. Exploratory factor analysis reduces the magnitude of data without losing the complexity of NSI. It reduces observed variables into factors within a pattern matrix (clusters of inter-correlated vari-ables) with “mutual interdependence” (Gaur 1997). Phrased differently, factor analysis discloses the latent factors that influence significantly the variation of the variables in the data, in the sample, and hence in the population and in the universe of respondents (Kim and Mueller 1978). The statistically significant confidence level in factor analysis, represented by the Kaiser-Meyer-Olkin (KMO) measure of sampling adequacy, shows the robustness of the sample in terms of distinct and reliable factors extracted. A KMO value needs to be higher than 0.7 in order to be at least“middling”sampling adequate, while a KMO value of 1 represents perfect sampling adequacy11 (Kim and Mueller 1978, p. 54). In addition, the Bartlett’s test of sphericity (BTS) indicates the significant confidence level regarding the coherence of factors and hence the reproducibility and generalisability of the results (Dziuban and Shirkey 1974; Kaiser 1974; Kim and Mueller 1978; Rummel 1970). The Kaiser criterion (Kaiser 1960) for the number of factors extracted is applied in this context. Thus a factor is disregarded unless it can explain the variance of at least one variable (eigenvalue higher than 1).
Furthermore, for robust explanatory power, we stipulate that the extracted factors explain at least 50 % of the total cumulative variance. The oblique rotation is selected as it represents exploratory factoring more accurately than orthogonal rotation methods which are preferred when confirming models. To maintain statistical signifi-cance, variables with less than 0.55 coefficient loading (equal to 30.25 % of the variance accounted for by the factor) are suppressed. Cut-off criteria for factor loadings remain a matter of debate (Bowles 2006; Conway and Huffcutt 2003; Cudeck and O’Dell 1994). Hair et al. (1998) suggest that the factor loading can be smaller the larger the sample size and the larger the number of variables being analysed; and that the larger the num-ber of factors, the larger should be the size of the loadings to maintain statistical signifi-cance. Shapiro et al. (2002) indicate several factor coefficient loading cut-offs.12 Heuristics suggest that loadings higher than 0.30 are salient, and that cut-off selection between 0.30 and 0.60 (Bagozzi and Yi 1998; Swisher et al. 2004) is representative of factor analysis in empirical social science literature. Regarding the factor names, they are assigned based on the factor loading of the variables taking the higher loading variables into consideration, that is, variables that are most influenced by the under-lying factor. Factor loadings point out the correlation between factors and variables, namely the extent to which the factors influence the variables, or phrased differently, the percentage of variation accounted for by factors.
with Cronbach’s alpha below 0.7 are deemed inconsistent and unreliable. They are therefore rejected for policy purposes of drawing out lessons for other countries since Cronbach’s alpha indicates the internal consistency and reliability of the factor and hence the cohesion of variables as a group.14
Results and discussion of the main barriers to innovation
We present the results of the factor analysis for all respondents as well as for the differ-ent groups of actors in the GNSI. Where appropriate comparisons and contrasts be-tween all, and individual, actors are offered. It is important to note from the outset that the internal consistency of the factor barriers to innovation, represented by Cronbach’s alpha, is high. Out of 16 Cronbach’s alpha, only two are below 0.6 at 0.598 and 0.532 which are deemed “questionable”. All others (87.5 %) are above 0.7 which is deemed “acceptable”. The reliability of our factor analysis is therefore robust.
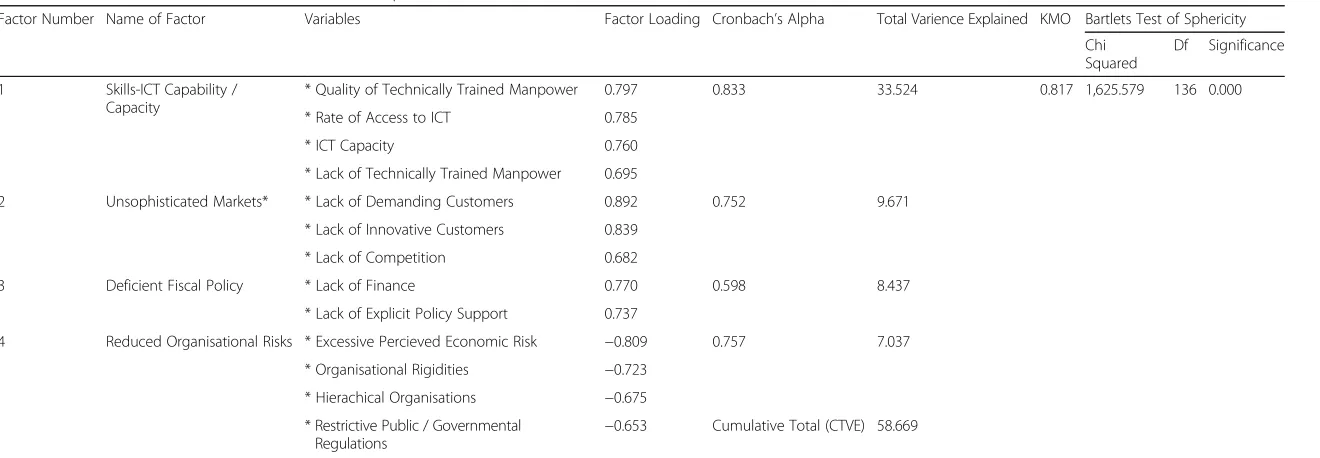
In the assessment of all respondents, four statistically significant factors influence the barriers to innovation. These are presented in Table 2. Factor 1, “skills-ICT capability/ capacity”, the highest barrier to innovation in the GNSI, accounts for 33.524 % of the total variance explained (TVE) and is responsible for 63.52 % of the variance of the first variable “quality of technically trained manpower” and 61.62 % of “rate of access” to ICT. This reflects the level, and uneven distribution, of skills and ICT resources in Ghana and generally within developing countries (Dutta and Bilbao-Osorio 2012). Even though Ghana has made efforts to bridge the digital divide (Koria et al. 2012), ICT in-frastructure, such as internet access, storage capacity and processing capability, needs to be prioritised in government budgetary expenditures, since economy-wide innova-tiveness and innovation is extremely difficult to attain without threshold levels in skills and ICT capability and capacity.
Factors 2, 3 and 4, which are “unsophisticated markets”, “deficient fiscal policy” and “Reduced Organisational Risks’ respectively, also represent significant barriers to innovation. Markets are not sophisticated due to the lack of demanding and innovative consumers. Taken together, these factors point to a vicious cycle. The government is relatively ineffective in setting the right policy, incentives or competition environment for firms to reduce organisational risks and increase their productivity, consumers do not demand innovative products, and hence firms tend not to invest in R&D and prod-uct development.15
Table 2Latent factors to barriers to innovation (all respondents)
Factor Number Name of Factor Variables Factor Loading Cronbach’s Alpha Total Varience Explained KMO Bartlets Test of Sphericity
Chi Squared
Df Significance
1 Skills-ICT Capability / Capacity
* Quality of Technically Trained Manpower 0.797 0.833 33.524 0.817 1,625.579 136 0.000
* Rate of Access to ICT 0.785
* ICT Capacity 0.760
* Lack of Technically Trained Manpower 0.695
2 Unsophisticated Markets* * Lack of Demanding Customers 0.892 0.752 9.671
* Lack of Innovative Customers 0.839
* Lack of Competition 0.682
3 Deficient Fiscal Policy * Lack of Finance 0.770 0.598 8.437
* Lack of Explicit Policy Support 0.737
4 Reduced Organisational Risks * Excessive Percieved Economic Risk −0.809 0.757 7.037
* Organisational Rigidities −0.723
* Hierachical Organisations −0.675
* Restrictive Public / Governmental Regulations
−0.653 Cumulative Total (CTVE) 58.669
NB. Residuals are computed between observed and reproduced correlations. There are 68 (50.0%) non-redundant residuals with absolute values greater than 0.05
Helix
(2016) 3:12
Page
15
of
Table 3Latent factors to barriers to innovation (government)
Number of Factor Name of Factor Variables Factor Loading Cronbach’s Alpha Total Varience Explained KMO Bartlets Test of Sphericity
Chi Squared
Df Significance
1 Constrained Human Capital Resources
* Quality of Technically Trained Manpower 0.873 0.798 26.75 0.551 317.755 136 0.000
* Lack of Technically Trained Manpower 0.833
* Lack of Information (Knowledge Gap) 0.622
* Restrictive Public / Governmental Regulations
0.579
2 Unsophisticated Markets * Lack of Demanding Customers 0.935 0.826 14.152
* Lack of Innovative Customers 0.822
3 Organisational Risks * Excessive Percieved Economic Risk 0.791 0.532 10.669
* Organisational Rigidities 0.693
4 Constrained ICT Stocks & Flows * Rate of Access to ICT −0.809 0.818 9.028
* ICT Capacity −0.799
* Hierachical Organisations −0.794
* Brain Drain −0.651
5 (THIS FACTOR IS NOT RELIABLE AND HENCE NOT NAMED)
* Lack of Higher Resolution Regulations 0.684 −0.08 6.784
* Lack of Competition −0.578
6 (THIS FACTOR IS NOT RELIABLE AND HENCE NOT NAMED)
* Lack of Finance 0.836 0.458 6.202
* Innovations Costs (Too High) 0.599 Cumulative Total (CTVE)
73.585
NB. Residuals are computed between observed and reproduced correlations. There are 66 (48.0%) non-redundant residuals with absolute values greater than 0.05
Helix
(2016) 3:12
Page
16
of
customers” and“lack of innovative customers”accounting for 87.4 and 67.6 % of vari-ance in these variables, respectively.
Factor 3 “organisational risks” is the third highest barrier to innovation which accounts for 10.669 % of TVE. This reflects the need for the business and work envir-onment not to be constrained either by organisational rigidities, such as long proce-dures, bureaucracy and high transaction costs, or by excessive perceived economic risk. Without the ease of doing business, economic agents are not confident sufficiently to approach either change or competition. This invokes the policy response of reducing economy-wide transaction costs. According to the World Bank Doing Business 2015, the average rankings of Sub-Saharan Africa (SSA) indicate “weaker legal institutions and more complex and expensive regulatory processes” (The World Bank and International Finance Corporation 2013, p. 4), and Ghana’s average rank is 64 out of 185 countries. However, this average conceals widely dispersed indices in the regulatory environment that determine transaction costs.
Finally, factor 4 “constrained ICT flows and stocks” although a significant barrier accounts only for 9.028 % of the TVE. Overcoming this barrier requires economy-wide infrastructure policy decisions to make available widely Internet broadband capacity so that Ghana can move towards an e-economy.
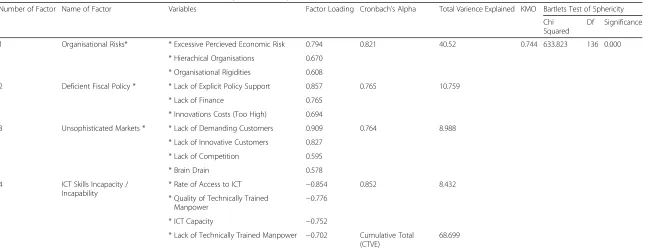
Table 4 presents the assessment of MHTI respondents. Analysing the MHTI perspec-tive, the main barrier to innovation in the GNSI is “organisational risks” (it accounts for 40.52 % TVE) in which the“excessive perceived economic risk” is the most crucial variable, since the factor is responsible of 63 % of its variance. Firms are constrained from innovating in Ghana. As in most developing countries, firms cannot price risk ad-equately and hence lack the incentive to take new initiatives or start new businesses at a sufficiently elevated pace as this appears economically risky especially given un-sophisticated markets that do not demand innovative products and services (Aubert 2005; Ernst 2000). Moreover, firms are not supported adequately by the fiscal, monetary, regulatory and standard policies designed by the government.16 The government and industry therefore need to engage in dialogue to align priorities through targeted policy.
Factor 2 “deficient fiscal policy”is the second highest barrier to innovation account-ing for 10.759 % of TVE. This is an extremely crucial factor as policy and finance sup-port, and the level of innovation costs, are essential in determining the rate and quality of innovation in firms and hence in the economy (Goh 2006; Smits and Kuhlmann 2004; Zagler and Dürnecker 2003). This is explained in the variables “lack of explicit policy support”, “lack of finance” and high “innovation costs” which is influenced by factor 2 and is responsible for 73.4, 58.5 and 48.2 % of the variation in these variables, respectively.
Table 4Latent factors to barriers to innovation (medium-and high-tech industry)
Number of Factor Name of Factor Variables Factor Loading Cronbach’s Alpha Total Varience Explained KMO Bartlets Test of Sphericity
Chi Squared
Df Significance
1 Organisational Risks* * Excessive Percieved Economic Risk 0.794 0.821 40.52 0.744 633.823 136 0.000
* Hierachical Organisations 0.670
* Organisational Rigidities 0.608
2 Deficient Fiscal Policy * * Lack of Explicit Policy Support 0.857 0.765 10.759
* Lack of Finance 0.765
* Innovations Costs (Too High) 0.694
3 Unsophisticated Markets * * Lack of Demanding Customers 0.909 0.764 8.988
* Lack of Innovative Customers 0.827
* Lack of Competition 0.595
* Brain Drain 0.578
4 ICT Skills Incapacity / Incapability
* Rate of Access to ICT −0.854 0.852 8.432
* Quality of Technically Trained
Manpower − 0.776
* ICT Capacity −0.752
* Lack of Technically Trained Manpower −0.702 Cumulative Total (CTVE)
68.699
NB. Residuals are computed between observed and reproduced correlations. There are 71 (52.0%) non-redundant residuals with absolute values greater than 0.05
Helix
(2016) 3:12
Page
18
of
overwhelmingly professionals, technicians and the highly skilled. According to Adepoju (2007), Ghana was a top ten source of migration of professionals to the UK with an outflow of some 21,500 professionals (1999–2001), especially related to science, such as medical officers, dentists, pharmacists and nursing/midwifery personnel. The “brain drain” is directly related to “lack of competition” through the absence of a professionally demanding group of consumers.
Factor 4,“skills-ICT incapacity/incapability”, is a significant barrier to innovation but explains only 8.432 % of the TVE. In order to enable enhanced logistics, distribution and transport, and hence accelerate the flows of goods, services and information within the economy, it is necessary to upgrade the ICT network capacity and the related skills capability that represent the“central nervous system”of the economy.
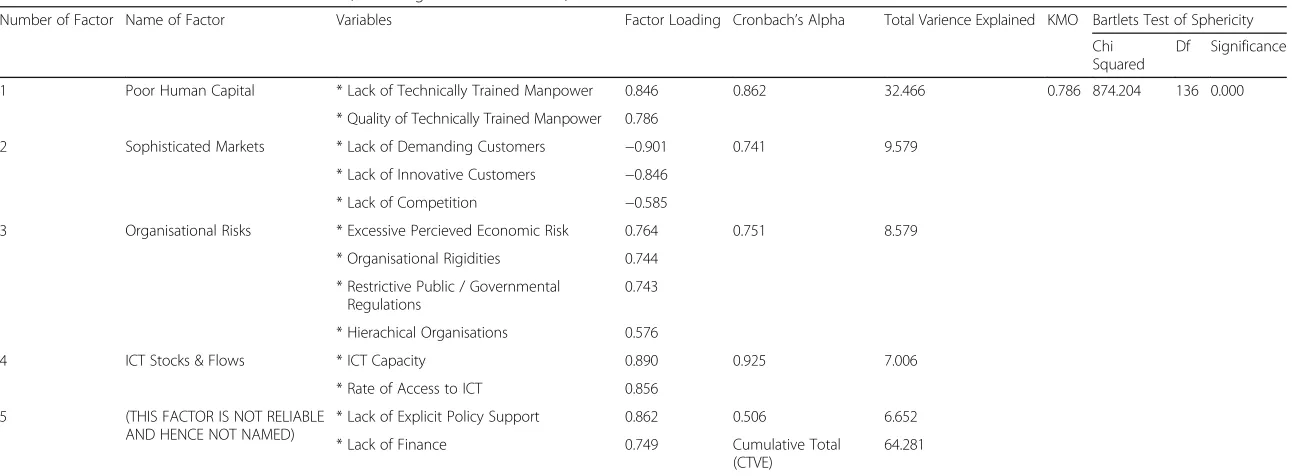
The perspective on factor barrier to innovation in the GNSI provided by KBIs is presented in Table 5.
The highest factor barrier to innovation from the KBI perspective is represented by factor 1 “poor human capital”, in which “lack of technically trained manpower” and “quality of technically trained manpower” are the most crucial variables. Factor 1 accounts for 32.466 % of TVE and is responsible for 71.6 and 61.8 % of the variance in the two respective variables. As mentioned previously, without adequate thresholds of human capital, the level of innovativeness and rate of innovation in the economy are likely to be severely debilitated and therefore inadequate to close the gap with the median middle-income countries.
Factor 2,“sophisticated markets”, the second highest barrier to innovation accounting for 9.579 % of TVE, influences the policy variables “lack of demanding customers”, “lack of innovative customers” and “lack of competition” and accounts negatively for 81.2, 71.6 and 34.2 % of variance in the variables, respectively. Innovative customers are decisive for stimulating companies to innovate and develop new process, new prod-ucts and patents (Porter 1990; Robertson and Yu 2001).
Factor 3 “organisational risks” is the third highest barrier accounting for 8.579 % of TVE and is responsible for 58.4, 55.4, 55.2 and 33.2 % of the variance in “excessive perceived economic risk”, “organisational rigidities”, “restrictive public/governmental regulations” and “hierarchical organisations”. Factor 4 is “ICT stocks and flows” but it accounts only 7.006 % of the TVE.
In conclusion, the four main statistically significant factors explaining the highest part of TVE for all the respondents are skills-ICT capability/capacity, unsophisticated markets, deficient fiscal policy and reduced organisational risks. The four statistically significant factors for government are constrained human capital resources, unsophisti-cated markets, organisational risks and constrained ICT flows and stocks. Regarding MHTI, the four factors are organisational risks, deficient fiscal policy, unsophisticated markets and skills-ICT incapacity/incapability. Finally, factors for KBIs are poor human capital, sophisticated markets, organisational risks and ICT stocks and flows.
system-Table 5Latent factors to barriers to innovation (knowledge-based institutions)
Number of Factor Name of Factor Variables Factor Loading Cronbach’s Alpha Total Varience Explained KMO Bartlets Test of Sphericity
Chi Squared
Df Significance
1 Poor Human Capital * Lack of Technically Trained Manpower 0.846 0.862 32.466 0.786 874.204 136 0.000
* Quality of Technically Trained Manpower 0.786
2 Sophisticated Markets * Lack of Demanding Customers −0.901 0.741 9.579
* Lack of Innovative Customers −0.846
* Lack of Competition −0.585
3 Organisational Risks * Excessive Percieved Economic Risk 0.764 0.751 8.579
* Organisational Rigidities 0.744
* Restrictive Public / Governmental Regulations
0.743
* Hierachical Organisations 0.576
4 ICT Stocks & Flows * ICT Capacity 0.890 0.925 7.006
* Rate of Access to ICT 0.856
5 (THIS FACTOR IS NOT RELIABLE AND HENCE NOT NAMED)
* Lack of Explicit Policy Support 0.862 0.506 6.652
* Lack of Finance 0.749 Cumulative Total (CTVE)
64.281
NB. Residuals are computed between observed and reproduced correlations. There are 60 (44.0%) non-redundant residuals with absolute values greater than 0.05
Helix
(2016) 3:12
Page
20
of
wide combinations of skills and assets for significant productivity enhancement based on science, technology, engineering, mathematics and information technology. The lack of innovating and demanding customers and the insufficiency in the level and quality of demand is the “market demand” dimension. This deficiency dissuades the manufac-turing and service sectors from innovating in order to offer products of enhanced qual-ities and values. According to Porter (1990), in the absence of sufficient policy capacity and capability to influence the NSI competiveness, resource-constrained developing countries would be better off concentrating on ensuring that markets work properly with respect to increasing sophistication of supply and demand, industry rivalry and related and supporting industries. “Organisational constraints” is considered as the third dimension. This points to the investment risks perceived and managerial rigidities that throttle the adaptive response mechanisms in the behaviour of the GNSI actors, who are moreover prevented from responding adequately and competitively to market signals (Pech and Oakley 2005; Schumpeter 1947). The last dimension named “fiscal and monetary deficiencies”depicts financial shortfalls with respect to supporting risk in innovation in general and innovative processes specifically in the early stages of ideation, invention and start-up and launch of new businesses.
The main features of GNSI are the following: the asymmetry in density and distribu-tion of actor inter-linkages; lack of sufficient levels of strategic coherence, organisa-tional performance and externalities; the largely unresponsive Ghana economy to supply- and demand-side signals; and systematical rigidity and inflexibility in the face of changing conditions (Bartels and Koria 2012). Therefore, the Ghana government’s intent to transform its“factor-driven”economic model into“innovation-driven” indus-trial development to deliver high levels of productivity, through enhancing competive-ness, employment and equitable social and economic development, confronts major hurdles. Relatively high barriers to innovation aligned with poorly configured and inadequately calibrated policy instruments imply incompatibilities in the GNSI that have to be tackled economy- and system-wide, as well as at the level of actor-specific interventions.
Our elaboration of the standard Triple Helix to a type 4, as indicated in Fig. 1, serves to identify statistically significant barriers to innovation,17 in terms of the factors that interrupt the intra-, inter-relations within, and between, the core actions in the NSI. We aver that, given the myriad complexities in the different varieties of “capital”18 which, in concert, drive socio-economic development and wealth creation (Svendsen and Svendsen 2003), to consider NSI without reference to the explicit role of arbitra-geurs and ICT is to miss out on valuable instrumentation for policy making. We argue that our type 4 Triple Helix model of NSI enables a deeper understanding of the relationships between innovation-driven economic growth and institutional dimensions (both formal and informal) of wealth creation.
venture capital; and available technology. These variables are central to our type 4 Triple Helix model for NSI.
In developing countries, barriers to innovation, expressed as the relatively poor effect-iveness and low efficiency of the NSI, are manifest in largely absent ICT, truncated link-ages between core actors, extremely thin arbitrageur (venture capital) intermediation and inadequate technologically competent human capital.
Policy recommendations and concluding remarks
With a management of innovation policy and pragmatic perspective, we now address the policy recommendations appropriate to the dimensions of identified barriers to innovation previously discussed and draw lessons for developing countries. Ghana shares many characteristics of development, with respect to innovation, with other developing countries.19 Policy recommendations to address deficiencies in “ organisa-tional capital”refer to the central role played concertedly by education, enterprise and management. This role, firstly, should be characterised by curricula reform that is reca-librated to the needs of MHTI. Secondly, by secondary and tertiary education, voca-tional training and specific enterprise-based training reoriented towards an increasing emphasis on science, technology, engineering, mathematics and information technol-ogy. Moreover, it is necessary to create an educational network between KBIs and MHTI to ensure knowledge transfer and the spread of new ideas thereby creating a work environment that is much more challenging and stimulating and thus able to mitigate the brain drain. Clearly, ICT needs to be included through the upgrade of the information systems infrastructure in order to enable ICT diffusion and the reduction of ICT network costs. However, given the nature of ICT (Chinn and Fairlie 2004; van Disk and Hacker 2003), this is a long-term policy dynamic. For example, India laid the foundations for its present excellence in providing out-sourced services in ICT and software-related industries in the 1950s and 1960s through the establishment of insti-tutes of technology (Mann et al. 2000; Piazolo 2001).
Policy recommendations to address insufficiencies in“market demand” include, firstly, the introduction, and improvement, of standards-based regulation and performance re-quirements to stimulate firms to be more adaptive technologically. Secondly, in order to cultivate a dynamic innovation environment, incentives for commercialisation of publicly funded R&D at KBIs should be strengthened and the patent management of the intellec-tual property rights (IPRs) needs to be improved. According to the International Property Rights Index 2015,20Africa ranks seventh (out of seven), the lowest, for intellectual prop-erty rights. Ghana ranks 50th (out of 129). Without the protection of law, intellectual assets—the wellspring of ideation, invention and innovation—and innovativeness can nei-ther be exploited effectively nor efficiently because collateralisation is virtually impossible.
Finally, the policy recommendations to address “fiscal and monetary deficiencies”in the GNSI focus more on the alignment of funding, fiscal and monetary, support of performance and the development of monitoring and audit instruments. For example regarding domestic credit provided by the banking sector (percentage of GDP 2012), Sub-Saharan African countries range from −8.9 (Congo Republic) to 187.2 % (South Africa) with most below 50 %.22
Implications for developing countries
The dimensional barriers to innovation in Ghana—lack of organisational capital, insuf-ficient market demand, organisational constraints and fiscal and monetary deficiencie-s—are prevalent in developing countries and particularly in Sub-Saharan Africa. These are manifest at different levels of intensity, with differing nuances, across the hetero-geneity of developing countries.
Across developing countries, these dimensions could be distilled into two primary interrelated constraining vectors that hinder innovation: the institutional, on the one hand (Rodrik et al. 2004; Trebilcock 1996; Trebilcock and Prado 2011); and on the other hand, the financial (Alfaro et al. 2008; Gorodnichenko and Schnitzer 2010). Indeed, it is this twin deficiency that defines developing countries and places them in the low-income divide compared to high-income countries (Durlauf and Quah 1999). The vectors are related in that, answering the question why capital does not flow from rich to poor countries, Alfaro et al. (2008, p. iii) conclude that “low institutional qual-ity23 is the leading explanation for lack of capital flows”. Furthermore, “financial con-straints restrain the ability of domestically owned firms to innovate and export and hence to catch up to the technological frontiers” (Gorodnichenko and Schnitzer 2010, p. iii). It is noticeable that total factor productivity differences between developed and developing countries are larger in machinery and equipment (Herrendorf and Valentinyi 2012). Aggregating these two vectors further, non-material forms of capital such as social capital explain differences in economic growth (Svendsen and Svendsen 2003) and Olson (1996, p. 19) indicates that “the only remaining plaus-ible explanation is that the great differences in the wealth of nations are mainly due to differences in the quality of their institutions and economic policies”.
Ghana, and other developing countries, would need to pay concerted attention to ensuring that their institutional architecture, which gives rise to organisational cap-ital and market demand, functions coherently and serves the interests of society as a whole. Policy prescriptions are not in short supply in this area (Bartels 2007; Bartels and Koria 2012; Birdsall et al. 2005) with respect to institutional quality and requisite investments in social stabilisers, law and order and non-corruption. Developing countries also would need to spend their limited financial resources wisely.24 It is cogent to revisit Bauer (1981, p. 248) regarding economic develop-ment requiring “charges in attitudes and mores adverse to material improvement… and the pursuit of appropriate government policies”.
makers to fix achievable targets and standards to stimulate firms and industry to be more productive and to create a better environment for all actors to innovate.
Endnotes
1
An early exception in 1993 is the edited book by Richard R. Nelson National Innovation Systems: A Comparative Analysis, which includes descriptive NSI analysis of European states as well as of selected states from Latin America.
2
These two expressions are considered interchangeable and both are found through-out the literature (see Fagerberg and Srholec 2008; Lundvall 1995; Nasierowski and Arcelus 1999; Niosi et al. 1993).
3See African Union Summit (2007) on science and technology for Africa’s
development. 4
The 35 DRUID Celebration Conference 2013, 17–19 Jun, ESADE Business School, Ramon Llull University, Barcelona.
5Triple Helix International Conference 2013, 8–10 July, University of London, United
Kingdom. 6
See Tidd (2006, p. 10), Fig. 1, for elucidation of the different types of innovation net-works between firms.
7Based on 2012 figures—global innovation index.
8Based on 2013 figures—global innovation index.
9
See Bartels et al. (2009, p. 14) and Bartels et al. (2013) for elucidation. 10
1 - very high constraint to 5 - very low constraint. The instrument was subjected to peer review by Prof. J. Howells (Centre for Research on Innovation and Competition, UK) and Prof. S. Mani (Centre for Development Studies, India).
11
KMO values higher than 0.9 represents “marvellous” sampling adequacy; a value between 0.8 and 0.9 represents “meritorious” sampling adequacy; between 0.7 and 0.8 represents “middling” sampling adequacy; the range between 0.6 and 0.7 represents “mediocre”sampling adequacy, while that including 0.5 and 0.6 represents“miserable” sampling adequacy; and values less than 0.5 represents “unacceptable” sampling adequacy.
12
These range from≥0.400 to≥0.600. 13
The sample of arbitrageurs is adequate as a significant fraction of the universe of arbitrageurs in Ghana. However, the absolute number does not meet the statistical re-quirements for performing exploratory factor analysis.
14
Cronbach’s α≥0.9 “Excellent”; 0.9 >α≥0.8 “Good”; 0.8 >α≥0.7 “Acceptable”; 0.7 >α≥0.6“Questionable”; 0.6 >α≥0.5“Poor”;α< 0.5“Unacceptable”. See Bartels and Koria (2012, p. 46, Table 9.6) and Cortina (1993).
15Ghana’s R&D expenditure is approximately 0.3 % of GDP (US$49 million), almost
all from government provision (UNCTAD, 2011, Science, Technology and Innovation Policy Review—Ghana, Geneva).
16
The available policy instruments are assessed by the actors in the GNSI as unsuc-cessful with respect to barriers to innovation (see Bartels and Koria 2012 for detailed analysis).
17
2014 Conference, 6–9 May 2014, Mauritius); as well as using structural equation mod-eling of the efficacy of the GNSI.
18
Svendsen and Svendsen (2003, p. 608) refer to a“plethora of capitals”in Woolcock M (1998). Social capital and economic development: toward a theoretical synthesis and policy framework. Theory and Society 27(2): 151–208.
19
It ranks 102th out of 189 countries for starting a business; 171th for trading across borders; 132th for dealing with construction permits and 161th for resolving insolvency according to the World Bank Doing Business rankings (http://www.doingbusiness.org/ rankings) of June 2015. From the 40 Sub-Saharan countries, 29 have rankings that are below 121 out of 189 for ease of doing business—a prerequisite for enabling innovative-ness in the economy.
20
http://internationalpropertyrightsindex.org/ accessed 27 May 2016. 21
Out of 189 countries, with respect to registering property, paying taxes and getting electricity, respectively, there are only one (Rwanda), five (Mauritius, South Africa, Seychelles, Zambia and Rwanda) and one (Mauritius) African countries in the top 50 rankings (http://www.doingbusiness.org/rankings).
22
World Bank data (data.worldbank.org/indicator/FS.DOMS.GD.ZS). 23
The quality of institutions means the quality of contract enforcement, property rights and shareholder protection (Levchenko, 2007).
24
According to nationmaster.com in the ranking of military expenditure per US$ GDP, developing countries feature 7 of out the top 10 spenders; 14 out of the top 20 spenders; and 24 out of the top 30 spenders. SSA spends approximately US$ 10 billion annually on the military. http://www.nationmaster.com/. Furthermore, according to the Stockholm International Peace Research Institute, SSA spent US$ 20.4 billion on mili-tary expenditure; Asia and Oceania US$ 364 billion; and South America US$ 66 billion. https://www.sipri.org.
Additional file
Additional file 1:Translation of the abstract into Arabic. (PDF 322 kb)
Received: 4 October 2015 Accepted: 6 October 2016
References
Abramovitz M (1986) Catching up, forging ahead, and falling behind. J Econ Hist 46:385–406. doi:10.1017/S0022050700046209 Achim IM, Popescu T (2009) The systemic approach to national innovation systems in a knowledge-based economy.
Annales Universitatis Apulensis: Series Oeconomica 11: 946–952
Adams J, Bessan J, Phelps R (2006) Innovation management measurement: a review. Int J Manag Rev 8:21–47. doi:10.1111/j.1468-2370.2006.00119.x
Adepoju A (2007) Migration in Sub-Saharan Africa. Background paper commissioned by the Nordic Africa Institute for the Swedish Government White Paper on Africa. Lagos: Human Resources Development Centre
African Union Summit (2007) Science technology and scientific research and climate change: Africa Union-Economic Commission for Africa, Science and Innovation Exhibition. Addis Ababa, Ethiopia, 22–30 January
Albuquerque EDM (1999) National systems of innovation and non-OECD countries: notes about a rudimentary and tentative“typology”. Braz J Polit Econ 19:35–52
Albuquerque E, Suzigan W, Kruss G, Lee K. (eds) (2015) Developing National Systems of Innovation: university industry interactions in the Global South. Edward Elgar Publishing, Cheltenham
Alfaro L, Kalemli-Ozcan S, Volosovych V (2008) Why doesn’t capital flow from rich to poor countries? An empirical investigation. Rev Econ Stat 90:347–368. doi:10.1162/rest.90.2.347
Amin A, Cohendet O (2005) Geographies of knowledge formation in firms. Ind Innov 12:465–486. doi:10.1080/13662710 500381658
Archibugi D, Iammarino S (1999) The policy implications of the globalization of innovation. Res Policy 28:317–336. doi:10.1016/S0048-7333(98)00116-4
Arnold E (2004) Evaluating research and innovation policy: a system world needs systems evaluations. Res Eval 13:3–17. doi:10.3152/147154404781776509
Arnold E (2011) Synthesis Report. International audit of research, development and innovation in the Czech Republic. Arocena R, Sutz J (2000a) Looking at national systems of innovation from the south. Ind Innov 7:55–75.
doi:10.1080/713670247
Arocena R, Sutz J, (2000b) Interactive learning and development policies in Latin America. DURID Summer Conference on the Learning Economy. Rebild, Denmark, 15–17 June
Asheim BT, Coenen L (2004) The role of regional innovation systems in a globalising economy: comparing knowledge bases and institutional frameworks of Nordic clusters. DRUID Summer Conference, 14–16 June
Asheim BT, Gertler MS (2005) The geography of innovation: regional innovation systems. Oxford University Press, Oxford
Asheim B, Iskasen A (2002) Regional innovation systems: the integration of local sticky and global ubiquitous knowledge. J Technol Transf 27:77–86. doi:10.1023/A:1013100704794TI
Aubert JE (2005) Promoting innovation in developing countries: a conceptual framework. World Bank Policy Research Working Paper No. 3554
Bagozzi RP, Yi Y (1998) On the evolution of structural equation models. Acad Market Sci 16:74–94. doi:10.1007/ BF02723327
Bartels FL (2007) Industry in growth and development: a review of contending development policy advisory directions. UNIDO Working Paper No 01/2001. UNIDO Research and Statistics Branch Staff, Vienna, Austria
Bartels FL, Koria R (2012) Evidence-based policy making. The Ghana national system of innovation—measurement, analysis & policy recommendations. GNSI Report 2012. UNIDO, Vienna, Austria
Bartels FL, Koria R (2013) Low carbon development: the challenges of‘green’innovation. Paper presented at Globalics Seminar on Learning, Innovation and Low Carbon Development, Report of the Globalics Seminar on Learning, Innovation and Low Carbon Development, Copenhagen, Denmark, 4–5 April
Bartels FL, Lederer S (2009) Changing patterns in industrial performance—a UNIDO competitive industrial performance perspective: implications for industrial development. UNIDO Working Paper No 05/2009. UNIDO, Vienna, Austria
Bartels FL, Voss H (2005) Determinants of national innovation systems. Paper presented at the 14th International Conference for the International Association of Management of Technology, Vienna, Austria
Bartels FL, Koria R, Carneiro S (2009) National systems of innovation in selected emerging market economies: an examination of actors, interactions and constraints. Euro-Asia management studies association (EAMSA) Bartels FL, Voss H, Lederer S, Bachtrog C (2012) Determinants of national innovation systems: policy implications for
developing countries. Innov Manag Policy Pract 14:2–18. doi:10.5172/impp.2012.14.1.2
Bartels FL, Koria R, Andriano L (2013) Determinants of innovativeness in the Ghana National System of Innovation (GNSI): policy implications for middle-income developing countries. Res Policy, under review
Bauer P (1981) Equality, the Third World, and economic delusion. Harvard University Press, Cambridge
Becheikh N, Landry R, Amara N (2006) Lessons from innovation empirical studies in the manufacturing sector: a systematic review of the literature from 1993–2003. Technovation 26:644–664. doi:10.1016/j.technovation. 2005.06.016
Bell M (2002) Knowledge resources, innovation capabilities and sustained competitiveness in Thailand: transforming policy processes. Report of the project“Thailand: National Science and Technology Policy Capacity”. SPRU, Sussex University. Mimeo
Birdsall N, Rodrik D, Subramaniam A (2005) How to help poor countries. Foreign Aff 84:136–152
Bjørnskov C, Svendsen GT (2002) Why does the northern light shine so brightly? Decentralisation, social capital and the economy. Aarhus School of Business, Working Paper 15
Blanc H, Sierra C (1999) The internationalization of R&D by multinationals: a trade-off between external and internal proximity. Camb J Econ 23:187–206. doi:10.1093/cje/23.2.187
Bleda M, Del Rio P (2013) The market failure and the systemic failure rationales in technological innovation systems. Res Policy 42(5):1039–1052
Bowles TV (2006) The adaptive change model: an advance on the transtheoretical model of change. J Psychol 140:439– 457. doi:10.3200/JRLP.140.5.439-457
Buckley PJ, Carter MJ (2004) A formal analysis of knowledge combination in multinational enterprises. J Int Bus Stud 35: 371–384. doi:10.1057/palgrave.jibs.8400095
Bugge MM, Mortensen PS, Bloch C (2011) Measuring public innovation in Nordic countries. Nordisk Institutt for Studier av Innovasjon, Forskning og Utdanning, Rapport 40/2011
Bush V (1945) Science—the endless frontier. United States Government Printing Office, Washington DC
Cai Y (2011) Factors affecting the efficiency of the BRICSs’national innovation systems: a comparative study based on DEA and panel data analysis. Discussion paper No 2011–52. http://www.economics-ejournal.org/economics/ discussionpapers/2011-52. Accessed 13 Oct 2016
Carlisle Y, McMillan E (2006) Innovation in organizations from a complex adaptive systems perspective. Emergence: Complexity and Organization 8: 2–9
Carlsson B (2006) Internationalization of innovation system: a survey of literature. Res Policy 35:56–67. doi:10.1016/j. respol.2005.08.003
Carlsson B, Stankiewicz R (1991) On the nature, function and composition of technological systems. J Evol Econ 1:93– 118. doi:10.1007/BF01224915
Chaminade C, Intarakumnerd P, Sapprasert K (2008) Measuring systemic failures in innovation systems in developing countries using innovation survey data: The case of Thailand