An algorithm for identification of natural
disaster affected area
M. V. Sangameswar
1, M. Nagabhushana Rao
2and S. Satyanarayana
3*Introduction
For any type of information social media is a boon. It is the gateway to real-time mecha-nisms providing irrepressible and effective information. Even though the data is a useful major chunk of social media data is the conversational type which does not require a search. Social media data are huge, noisy, unstructured, [1, 2] dynamic and distributed. Presently the focus of research is how to make the best use of social media data which is being accumulated in databases. This article attempts to examine the informative tweets from social media, especially during natural calamity in order to provide safety and relief measures for the affected people. Now a day’s broadcasting information to the people of the world is a micro-blogging site Twitter. It is a digital focal point where people con-verge for information, especially during the natural calamity. Generally, information
Abstract
An important source of information presently is social media, which reports any major event including natural disasters. Social media also includes conversational data. As a result, the volume of data on social media has an enormous increase. During the time of natural disaster like floods, tsunami, earthquake, landslide, etc., people require information in those situations, so that relief operations like help, medical facilities can
save many lives (Bifet et al. in J Mach Learn Res Proc Track 17:5–11, 2011). An attempt
is made in this article on Geoparsing which will identify the places of disaster on a Map. Geoparsing is a process of converting free text description of locations into the geographical identifier in an unambiguous manner with the help of longitude and latitude. With the help of geographical coordinates, it can be mapped and entered into geographical information system. A real-time, reliable at robust twitter messages which are the source of the information can handle a large amount of data. After collecting tweets at the real time we can parse them for the disaster situation and its location. This information will help to identify the exact location of the event. For knowing infor-mation on the natural disaster, tweets are extracted from twitter to R-Studio environ-ment. First the extracted tweets from twitter are parsed using R about “Natural Disas-ter”. Later we parsed the tweets and store in CSV format in R database. For all posted data tweets are calculated and stored in a file. Later visual analysis is performed for the data store using R Statistical Software. Further, it is useful to assess the severity of the
natural disaster. Sentiment analysis (Rahmath in IJAIEM 3(5):1–3, 2014) of user tweets is
useful for decision making (Rao et al. in Int J Comput Sci Inf Technol 6(3):2923–7, 2015).
Keywords: Twitter, Twitter API, R-Studio, Natural disasters, Real-time systems, Media, Geoparsing, Event detection, Data analytics, Sentiment analysis
Open Access
© The Author(s) 2017. This article is distributed under the terms of the Creative Commons Attribution 4.0 International License (http://creativecommons.org/licenses/by/4.0/), which permits unrestricted use, distribution, and reproduction in any medium, provided you give appropriate credit to the original author(s) and the source, provide a link to the Creative Commons license, and indicate if changes were made.
RESEARCH
from twitter can be obtained directly or indirectly. Directly it can be obtained by the people involved in the calamity. This information can also be obtained from reports or pointers of the information is available anywhere. The information on the natural calam-ity in social media can be clouded by conversation and incomplete information.
Analysis [3–5] of informative data will allow further to understand the information on tweets which will help to know the trends and extended the disaster. Data sources with information along with the derivate branches, when mapped identify the users (nodes) with sent @ replies (outbound) and received retweets. This will help to identify the numerous patterns including logistics or focal points of disasters [6]. Relieve efforts can be expedited if there is a system to filter information of conversational tweets combining geo-locations with sentimental analysis along with informative social media filtering will help to take correct decisions that will help the sufferings of the victims and also save the lives of humanity in natural calamities. An attempt is made to identify the location of the occurrences of natural disasters so as to send rescue teams to those locations.
There are two work phases suggested namely data streaming [7] from twitter and min-ing knowledge through R-Studio. For these two operations, the methods used are twitter API and sentiment analysis [8] through R. Twitter applications requests for connection twitter database. When the connection is established authentication is generated, provid-ing search key the natural disaster. A file will be data frame (DF) is generated with tweets and is converted into a comma separated values (CSV) file which can be visualized in a Map. Twitter applications requests for connection twitter database. When the connection is established authentication is generated, providing search key the natural disaster.
Big data analytics
The process of analyzing and mining big data [9] known as big data Analytics can pro-vide operation and business knowledge with clarity and uniqueness. One of the impor-tant tasks of big data is to analyse data collected by business houses for trends in leverage [10]. The innovative techniques of big data are primarily in data storage, processing and analysis [11]. These methods ensure reduction in storage cost and power consumption. Data centers will be profited by cost reduction techniques. Further the cloud computing increases the efficiency. Also new development of packages Hadoop for computation in distributed mode is a weaker tool. Processing large volume of data in parallel mode is an important measure [12]. Tradition analytics, big data analytics has several differences. Data tools namely Clojure, Scala, Python, Hadoop and java for Natural Language Pro-cessing (NLP) [13] and text mining and R, MAT can be used in data analytics.
Social media has become a very important tool to stay in touch with friends, to market any subject of interest.
mentions. When a message is posted and all users see the updates, they take note of the author of the message namely the submitter.
All posts in twitter are made public. The messages can’t receive if the submitter is not followed. The messages can be located by keywords or topics. Twitter follows its own concessions to make a distinct from other textual messages. For effective knowledge applications, understanding language and terms play a key role.
The following are the some of the terminology used on twitter.
1. A message posted in a twitter with a maximum of 140 character is called twit [14]. 2. It maps contained text, photos, links, and videos.
3. The user name of twitter appears after “@”.
4. To mark keywords are topics hashtag symbol is used “#” in a tweet. It categorises a message.
5. The other users of twitter are referred @ who get alerts.
The reply is used to respond to a tweet. Answering a tweet built up personal relation-ship among follower and friends in a conversation. When a tweet is chosen from others and tweeted again it is retweet. It can be done by a retweet button or addition own mes-sage including “RT” before retweeted. An easy way of identifying people and topics is through Twitters, hashtags mentioned. This allows searching and filtering information on any subject of interest.
Natural disasters in India
There are number of natural disasters that occur regularly in India. Some of them are earthquake, cyclones, landslide, cloudburst, storm, flood, tsunami, volcanic eruption, heat wave, and cold wave.
During the earlier day, the natural disaster information is communicated to others by a phone call or telegram, direct observation or personal interview. This process is used to gets delay the help or relief operations. When relief operations get delayed, the human and animal mortality increases and sufferings of people will increase.
Due to natural calamities namely floods tsunami, storms, etc. occurring almost every year. Thousands of human life and millions of dollars are including loss of animals and property damage. It’s being done. The internet technology developed can be used to some extent to reduce the sufferings of the tragedy victims. So to observe the moment of natural disasters in India, we have targeted the information from social network web sites like twitter to do sentiment analysis to see that among the Indian population, on natural disasters taking a sample of live tweets about natural disasters.
Tweets are the quick real-time sources of information. The information on natural dis-asters when tweeted will reach the rest of world faster than any other source. In many countries in the world, twitter information is used to manage natural disasters. Even though the damage due to calamities is more in India with regard to human population and damage to property compared to other countries because of effective management of twitter with respect to information on national disasters.
natural calamities occurrences in India using sources like news media both print and electronic, social media and search engine data and twitter data.
The response to disaster and relief data has to be streamlined for effective relief opera-tions through Tweet tracker and tweedr [15] systems built in the USA. Earlier research in this direction has proposed location inventory store emphasizing location tagging and information from news agencies. A wider source structure has to be proposed for India.
After identifying the different types of natural disasters occurring in India the places of their occurrences and their frequency has to be documented. The geographical data like lat-itude, longitude and any other landmarks for easy identification may be recorded. The infor-mation on reachability of the vulnerable areas of disasters by road, water, and air should be documented. A constant monitoring of these places be made and all available geo informa-tion may be provided to print media, electronic media, the internet and social media.
In case of emergencies, these sources can react for reporting the news and help in relief measures for the victims from Non Governmental Organizations (NGO) and other services organization in addition to Government services. Asia, tops in terms of number of disaster events among the continents. Close to 60% of the disasters in Asia are organ-ized in South Asia and 40% [1] are organorgan-ized in India.
Sentiment analysis
Sentiment analysis is the process of using text analytics to mine various sources of data for opinions. Often, sentiment analysis is done on the data that is collected from the internet and from various social media platforms. Politicians and governments often use sentiment analysis to understand how the people feel about themselves and their policies.
With the advent of social media, data is captured from different sources, such as mobile devices and web browsers, and it is stored in various data formats. Because the social media content is unstructured with respect to traditional storage systems (such as RDBMS, Rela-tional Database Management System), we need tools that can process and analyze this disparate data. However, big data technology is made to handle the different sources and different formats of the structured and unstructured data. In this article, I describe how to use big data tools to capture data for storage and process the data for sentiment analysis.
Architecture
It consists of
1. Twitter environment. 2. R-Studio.
3. R-Packages.
Environment of twitter
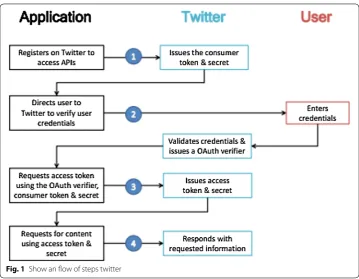
Oauth package of R is used for Twitter API confirmation procedure. Figure 1 shows the steps involved in usage of Oauth to Access Twitter API.
1. Upon registration by the user in twitter a key and secret key are provided which are required for application authentication.
3. This PIN is used for requesting an Access Token and Access Secret, which are exclusive to the particular individual from twitter API for continuing the next application process. 4. GetUserAccessKeySecret contain token and secret key, whose information are
required for further use.
R‑studio
For statistical analysis and a Graphical analysis of the large datasets, R studio environment is suitable. R studio which contains more than 8000 packages is available. Four window envi-ronments are provided in R Studio. The work area in the left bottom is called R console. Here the R scripts are implemented. The area where R scripts are written is the top left area which is called R script area. The area where variables are defined and reading of data sets in the right top area called Global environment. Display of charts [16] of data in the right bot-tom area called plot area. The script area of R-Studio is where the R code is written.
R packages
The number of packages is called R packages are used for R functions compiling code on sample data. These functions make the R library environment. At the time of instal-lation, R installs some packages by default. Based on requirement other R packages are installed and loaded separately as per the particular specifications. The number of pack-ages like twitters ROAuth, twitter, plyr, stringr, ggplot2 RColorBrewer and Devtools is used in the implementation of this paper.
1. TwitteR: It is mainly used for providing an interface to Twitter API. 2. ROAuth: it provides the users it means of o authenticate to the server.
3. Plyr: a package called for plyr is used for solving a big problem but using this package; we can divide a big problem into small pieces, solve them and put them again together. 4. Stringr: this is an easy function for String functions in R. These functions can handle
characters of zero length and NA’s also.
5. Gplot2: Graphics in R can be implemented by using ggplot2 functions. It supports multiple data sources and is useful for both base and lattice graphs.
6. RColorBrewer: This package can be used for drawing nice maps shared according to a variable through palettes.
7. Devtools: Devtools helps the developer in providing functions for simplifying many common tasks.
An R script is simply a text file containing (almost) the same commands that you would enter on the command line of R. (almost) refers to the fact that if you are using sink() to send the output to a file, you will have to enclose some commands in print() to get the same output as on the command line.
Methodology
In this study, a methodology is proposed to find location using twitter the social media. The proposed system constitute the following steps for twitter analysis.
1. Creation of twitter application.
2. Twitter API codes are executed trough R-studio. 3. Import tweets trough twitter API.
4. Standardizing the data. 5. Classification of the data. 6. Getting scores.
7. Establishing R maps to view results.
Creation of twitter application
Part of the recent tweets of twitter is accessed by twitter search API. The collected tweets are cleansed for usage in research work. For performing all these tasks creation for a twitter application is essential.
Using R‑studio execute twitter API code
R console executes twitter search Application Program Interface code. Establish the Twitter website to have an interface with tweets. Comma separated values (CSV) con-tains a file which has other tweets. There are many R-packages to be installed through R-command which is a part of Twitter API process.
Natural disasters.list < - searchTwitter (‘makeinindia’, n = 1000, lang="en")
The tweets from the source for the past couple of days on natural disasters are returned by the above command.
Import tweets through twitter API
done by search Twitter function. These lists [17] of tweets are converted into the data frame (DF) which in turn is converted to.csv format file.
Standardizing the data
The tweets are converted into useful uniform action by applying some function on the tweets. This procedure is called standardizing of the data. The burden of classification is reduced by removing the extra symbol which does not give any meaning to the tweet.
Classification of the data
Sentiment analysis consists of calculation of combination of the words of the tweets in respect of related list. For performing this word list is to be downloaded and saved to the working directory. Two additional packages PalyR and StringR are required to manipu-late strings in sentiment analysis.
Getting scores
Each individual tweet is scored by sentiment function [18]. Comparing the words with
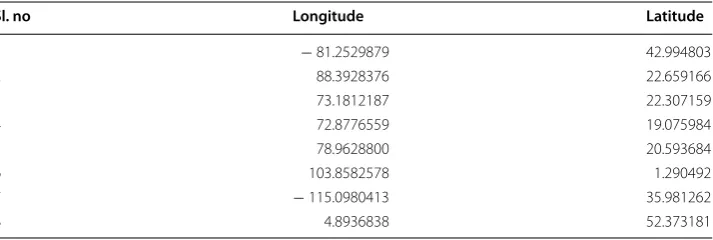
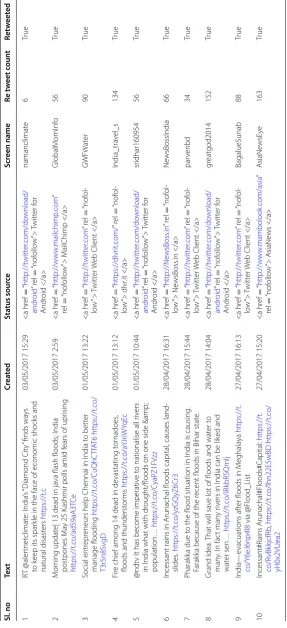
related words list gives is scored [19, 20]. In Table 1 shows, the imported tweets
lon-gitude and latitude information and Table 2 shows, natural disasters in India imported
Tweets using R-Studio.
Table 1 Natural disasters in India imported tweets longitude and latitude information
Sl. no Longitude Latitude
1 − 81.2529879 42.994803
2 88.3928376 22.659166
3 73.1812187 22.307159
4 72.8776559 19.075984
5 78.9628800 20.593684
6 103.8582578 1.290492
7 − 115.0980413 35.981262
8 4.8936838 52.373181
4 Algorithm
Start
Load Twitter API
Set CONSUMER_KEY, CONSUMER_KEY_SECRET; getInstance using Twitter Factory,ConfigurationBuilder;
Initialize AccessToken,AcessTokenSecretKey; Access accessToken, accessTokenSecret; Access Twitter (accessToken, accessTokenSecret);
Create Query ("Earth Quake In Nepal");//user search information Get today's date;
ModifiedDate toSimpleDateFormat("yyyymmdd"); Set modifiedDate;
QueryResult res; do
res = twitter.search(Query); List tweets = res.getTweets(); for each Status tweet : tweets
Store every Tweet in File//using tweets.getText Method End for
Table 2 Na tur al disast ers in I ndia imp or ted t w eets in R-studio Sl . no Te xt Cr eate d Sta tus sour ce Scr een name Re t w eet c oun t Ret w eet ed 1 RT @aler tnet climat e: I ndia ’s “Diamond Cit y” finds wa ys to k
eep its spar
kle in the face of economic shocks and
natural disast ers https://t.c 03/05/2017 15:29 <a hr ef = “ http://t witt er .com/do wnload/ andr oid ” r el = “nof ollo w ”> T witt er for Andr oid </a> namanclimat e 6 True 2 M or ning updat
e| 13 dead in ja
va flash floods; I
ndia
postpones M
ay 25 K
ashmir polls amid f
ears of upr
ising https://t.co/ad59aA3T Ce 03/05/2017 2:59 <a hr ef = “ http://w w w .mailchimp .com ” rel = “nof ollo w ”> M ailChimp </a> GlobalM omI nf o 56 True 3 Social entr epr
eneurs help Chennai in I
ndia t o bett er manage flooding https://t.co/C uQhC TfA T6 https://t.co/ T3r5n8Sv gD 01/05/2017 13:22 <a hr ef = “ http://t witt er .com ” r el = “nof ol -lo w ” > T witt er W
eb Client </a>
GWFW at er 90 True 4 Fir
e chief among 14 dead in de
vastating t
or
nadoes
,
floods and thunderst
or ms https://t.co/aY Jr iWY qE c 01/05/2017 13:12 <a hr ef = “ https://dlvr it.com/ ” r el = “nof ol -lo w ”> dlvr .it </a> India_tra vel_s 134 True 5 @ndt v I
t has become imperativ
e t
o nationalise all r
iv
ers
in I
ndia what with dr
ought/floods on one side &
population… https://t.co/C yaP Z1FV zz 01/05/2017 10:44 <a hr ef = “ http://t witt er .com/do wnload/ andr oid ” r el = “nof ollo w ”> T witt er for Andr oid </a> sr idhar160954 56 True 6
Incessant rains in Arunachal floods capital
, causes land
-slides . https://t.co/yzGQ yZ6Cr3 28/04/2017 16:31 <a hr ef = “ http://Ne wsBoss .in ” r el = “nof ol -lo w ”> Ne wsBoss .in </a> Ne wsBossI ndia 66 True 7 Pharak
ka due t
o the flood situation in I
ndia is causing
.
Farak
ka because of the r
ecent floods in Bihar stat
e. 28/04/2017 15:44 <a hr ef = “ http://t witt er .com ” r el = “nof ol -lo w ”> T witt er W
eb Client </a>
par venbd 34 True 8 Grand Idea.
That will sa
ve lot of floods and wat
er t o man y. I n fac t man y r iv
ers in I
ndia can be lik
ed and wat er sen… https://t.co/iR kbRSQmI j 28/04/2017 14:04 <a hr ef = “ http://t witt er .com/do wnload/ andr oid ” r el = “nof ollo w ”> T witt er for Andr oid </a> gr eat god2014 152 True 9 India— evacuations af
ter floods in M
eghala ya https://t. co/Y6eJ6np4l8 via @F lood_List 27/04/2017 16:13 <a hr ef = “ http://t witt er .com ” r el = “nof ol -lo w ”> T witt er W
eb Client </a>
Results
The status of public opinion is visualized [21] on the natural disasters in India shows in Fig. 2. The sentiments of the user can be visualized by creating visual maps. This can be accomplished through addMarkers function [22]. All the tweets are selected and a world map shape file is made.
We are maintaining event-related tweets words list in a directory. The dictionary includes a set of standard words that depict natural disasters affected in India words within a context. It identifies natural disasters like earthquake, cyclones, landslide, cloudburst, storm, flood, tsunami, volcanic eruption, heat wave, and cold wave used in social media. These word lists can be obtained from the NDMA (National Disaster Man-agement Authority, Government of India), updated regularly, and integrated into our analyses logic.
Convert free text description of locations into the geographical identifier by using lon-gitude and latitude. The following methods were used.
with(locations, plot(lon, lat))
map = leaflet() % >% addTiles() % >%
addMarkers(locations$lon,locations$lat,popup = tweetFrame$text) and print(map)
Conclusion and future works
It is a challenging the task to analyze large data emanating from social media with the existing data mining tool. Our aim is to access twitter and R-studio. Large data for deci-sion making is done by twitter and R-studio analysis. From the retrieved “Natural Disas-ter in India” data from TwitDisas-ter Sentiment Analysis has shown the opinion of the people. This concludes that R statistics tool is sufficiently used for the analysis of big data. The application of PYTHON for analysis of big data can be explored.
Authors’ contributions
MVS performed analysis on all samples, interpreted data, wrote manuscript. MNR supervised the development of work, helped in data interpretation and manuscript evaluation. SS helped to evaluate and edit the manuscript and acted as the corresponding author. All authors read and approved the final manuscript.
Authors’ information
Mr. M. V. Sangameswar Completed M.Tech from Allahabad University, and pursuing Ph.D. from Rayalaseema University, Kurnool. At present working as Assoc. Professor Department of MCA, Godavari Institute of Engineering and Technology, Rajahmundry, Andhra Pradesh, INDIA. Dr. M. Nagabhushana Rao did his Ph.D. in Computer Science area as Spatial Data Mining from Sri Venkatateswara University—Tirupathi. Presently working as Professor in Computer Science and Engineer-ing, K.L.University—Vijayawada, Andhra Pradesh, INDIA. Dr S. Satyanarayana did his Ph.D. in Computer Science and Engineering. Presently he is working as professor in Adama Science and Technology University, ETHIOPIA. Author details
1 Rayalaseema University, Kurnool, Andhra Pradesh, India. 2 CSE Department, K.L.University, Vijayawada, Andhra Pradesh, India. 3 CSE Department, Adama Science and Technology University, Adama, Ethiopia.
Acknowledgements
I have great pleasure in expressing my gratitude to Sri K. V. V. Satyanarayana Raju, Founder & Chairman, Chaitanya Group of Institutions, Sri K. Sasi Kiran Varma, Vice Chairman, Chaitanya Group of Institutions, Smt. Lakshmi Raju Executive Direc-tor, GIET, for their kind support in providing me an opportunity to do research in this college. I would like to extend my special thanks to Dr. D. V. RamaMurthy, Principal, Prof. PVGK Jagannadha Raju Vice Principal, GIET-Rajahmundry, Andhra Pradesh, India.
Competing interests
The authors declare that they have no competing interests.
Publisher’s Note
Springer Nature remains neutral with regard to jurisdictional claims in published maps and institutional affiliations.
Received: 5 July 2017 Accepted: 10 October 2017
References
1. Hu X, Tang J, Gao H, Liu H. Unsupervised sentiment analysis with emotional signals. In: Proceedings of the 22nd international conference on world wide web, p. 607–18. ACM, USA, 2013.
2. X. Hu, L. Tang, J. Tang, and H. Liu. Exploiting social relations for sentiment analysis in microblogging. In: Proceedings of the sixth ACM international conference on web search and data mining, p. 537–46. ACM, USA, 2013.
3. Spencer J, Uchyigit G. Sentimentor: sentiment analysis of twitter data. CiteSeerX 10M; 2012.
4. Sharma Y, Mangat V, Mandeep K. Sentiment analysis and opinion mining. Int J Soft Comput Artif Intell. 2015;3(1). 5. Rao NP, Srinivas SN, Prashanth CM. Real time opinion mining of twitter data. Int J Comput Sci Inf Technol.
2015;6(3):2923–7.
6. Bruns A, Liang YE. Tools and methods for capturing Twitter data during natural disasters. First Monday 2012;17:4–2. 7. Morstatter F, Pfeffer J. Is the sample good enough? Comparing data from twitter’s streaming API with Twitter’s
Firehose. In: The 7th international AAAI conference on weblogs and social Media. 2013.
8. Agarwal A, Xie B, Vovsha I, Rambow O. Sentiment analysis of Twitter Data. In: Proceeding LSM ’11, Proceedings of the workshop on languages in social media, p. 30–38, Portland, Oregon, 23 June 2011 Available from: dl.acm.org. 9. Sukhpal K, Rashid EM. Web news mining using back propagation neural network and clustering using K-Means
algorithm in Big data. Indian Journal of Science and Technology, 9(41). doi:10.17485/ijst/2016/v9i41/95598. http:// www.indjst.org/index.php/indjst/article/view/95598/74756.
10. Manyika J, Chui M, Brown B, Bughin J, Dobbs J, Roxburgh C, Byers AH. Big data: the next frontier for innovation, competition, and productivity. Chennai: McKinsey; 2011.
11. Wilder-James E. What is big data? An introduction to the big data landscape. 2012. https://www.oreilly.com/ideas/ what-is-big-data.
12. Prajapati V. Big data analytics with R and Hadoop. Birmingham: Packt Publishing; 2013.
14. https://en.wikipedia.org/wiki/Twitter. Accessed 17 June 2017.
15. Ashktorab Z, Brown C, Nandi M, Culotta A. Tweedr: mining twitter to inform disaster response. In: Proc. of ISCRAM, 2014.
16. Liang M, Trejo C, Muthu L, Ngo LB, Luckow A, Amy W. Evaluating R-based big data analytic frameworks. In: IEEE international conference on cluster computing. 2015. p. 508–09.
17. Pak A, Paroubek P. Twitter as a corpus for sentiment analysis and opinion mining. In: Proceedings of the seventh international conference on language resources and evaluation (LREC’10). 2010.
18. Ding X, Liu B, Yu PS. A holistic lexicon-based approach to opinion mining. In: Proceedings of first ACM international conference on web search and data mining WSDM. 2008.
19. Bifet A, Frank E. Sentiment knowledge discovery in twitter streaming data. New Zealand: Springer Link; 2010. p. 1–15.
20. Bifet A, Holmes G, Pfahringer B, Gavalda R. Detecting sentiment change in twitter streaming data. J Mach Learn Res Proc Track. 2011;17:5–11.
21. Fiaidhi J, Mohammed O, Mohammed S, Fong S, Kim TH. Opinion mining over twitter space: classifying tweets programmatically using the R approach. Newyork: IEEE; 2012. p. 313–9.
22. Parthiban P, Selvakumar S. Big data architecture for capturing, storing, analyzing and visualizing of web server logs. Indian J Sci Tech. 9(4). doi:10.17485/ijst/2016/v9i4/84173.
23. Rahmath H. Opinion mining and sentiment analysis-challenges and applications. IJAIEM. 2014;3(5):1–3. 24. Goswami S, Chakraborty S, Ghosh S, Chakrabarti A, Chakraborty B. A review on application of data mining