R E S E A R C H
Open Access
Task scheduling and resource allocation in
cloud computing using a heuristic
approach
Mahendra Bhatu Gawali
1*and Subhash K. Shinde
2Abstract
Cloud computing is required by modern technology. Task scheduling and resource allocation are important aspects of cloud computing. This paper proposes a heuristic approach that combines the modified analytic hierarchy process (MAHP), bandwidth aware divisible scheduling (BATS) + BAR optimization, longest expected processing time preemption (LEPT), and divide-and-conquer methods to perform task scheduling and resource allocation. In this approach, each task is processed before its actual allocation to cloud resources using a MAHP process. The resources are allocated using the combined BATS + BAR optimization method, which considers the bandwidth and load of the cloud resources as constraints. In addition, the proposed system preempts resource intensive tasks using LEPT preemption. The divide-and-conquer approach improves the proposed system, as is proven experimentally through comparison with the existing BATS and improved differential evolution algorithm (IDEA) frameworks when turnaround time and response time are used as performance metrics.
Keywords: Cloud computing, Task scheduling, Heuristic, Resource management, Analytic hierarchy system, BATS, BAR
Introduction
Cloud computing is an accelerating technology in the field of distributed computing. Cloud computing can be used in applications that include storing data, data ana-lytics and IoT applications [1]. Cloud computing is a technology that has changed traditional ways in which services are deployed by enterprises or individuals. It provides different types of services to registered users as web services so that the users do not need to invest in computing infrastructure. Cloud computing provides services such as IaaS (Infrastructure as a Service), PaaS (Platform as a Service), and SaaS (Software as a Service) [2]. In each type of service, the users are expected to submit the requests to the service provider through the medium of the Internet. The service provider is respon-sible for managing the resources to fulfill the requests generated by users. Service Providers employ scheduling algorithms to schedule the incoming request (tasks) and
to manage their computing resources efficiently. Task scheduling and resource management permit providers to maximize revenue and the utilization of resources up to their limits. In practice, in terms of the performance of cloud computing resources, the scheduling and allocation of resources are important hurdles. For this reason, researchers have been attracted to studies of task scheduling in cloud computing. Task scheduling is the process of arranging incoming requests (tasks) in a certain manner so that the available resources will be properly utilized. Because cloud computing is the tech-nology that delivers services through the medium of the Internet, service users must submit their requests online. Because each service has a number of users, a number of requests (tasks) may be generated at a time. Systems that do not employ scheduling may feature longer waiting periods for tasks moreover, some short-term tasks may terminate, due to the waiting period. At the time of scheduling, the scheduler needs to consider a number of constraints, including the nature of the task, the size of the task, the task execution time, the avail-ability of resources, the task queue, and the load on the
* Correspondence:[email protected]
1Department of Information Technology, Thadomal Shahani Engineering
College, Bandra (W), University of Mumbai, Mumbai, MS, India Full list of author information is available at the end of the article
resources. Task scheduling is one of the core issues in cloud computing. Proper task scheduling may result in the efficient utilization of resources. The major advantage of cloud computing is that it promotes proper utilization of resources [3]. Thus, task scheduling and resource allocation are two sides of a single coin. Each affects the other.
Currently, Internet users can access content anywhere and anytime, without needing to consider the hosting infrastructure. Such hosting infrastructure consists of vari-ous machines with varivari-ous capabilities that are maintained and managed by the service provider. Cloud computing enhances the capabilities of such infrastructure, which can access the Internet. Cloud service providers earn profits by providing services to cloud service users.
The cloud service end user can use the entire stack of computing services, which ranges from hardware to applica-tions. Services in cloud computing employ a pay-as-you-go basis. The cloud service end user can reduce or increase the available resources, per the demands of the applications. This is one the major advantages of cloud computing, but service users may be responsible for paying additional costs for this advantage. The cloud service user can rent the re-sources at any time and release them with no difficulty. The cloud service user has the freedom to employ any service based on application need. The freedom of service choice for users has led to problems; that is the next user request cannot be perfectly predicted. Thus, task scheduling and re-source allocation are mandatory parts of cloud computing research. The efficiency of resource uses depends on the scheduling and load balancing methodologies, rather than the random allocation of resources. Cloud computing is widely used for solving complex tasks (user requests). In solving complex task issues, the use of scheduling algorithm is recommended. Such scheduling algo-rithms leverage the resources. The proposed system employs features of the Cybershake scientific work-flow and the Epigenomics scientific workwork-flow, which are described in Section Input Data.
The major contributions of this paper are summarized as follows.
1. The analytic hierarchy process is modified to rank scientific tasks.
2. To manage the resources given bandwidth
constraints and the load on the virtual machine, the proposed system incorporates a version of the existing BATS algorithm that has been modified by introducing BAR system optimization.
3. Bipartite graphs are utilized to map tasks to appropriate virtual machines once the condition is satisfied.
4. A preemption methodology gives us the status of the virtual machine, and a modified divide-and-conquer
methodology has been proposed to aggregate the results after tasks preemption.
5. The proposed solution is experimentally investigated using the CloudSim simulator.
The remainder of the paper is organized as follows. Section“Introduction”provides an introduction to cloud computing and its outstanding issues, especially task scheduling and resource allocation. Section “Related work” focuses on related studies that investigate task scheduling and resource allocation. Section“Input data” describes the input data provided to the Cybershake scientific workflows and the Epigenomics scientific workflow. Section “Proposed system” addresses the architecture of the proposed system. Section "Proposed methodology” explains the proposed methodology. Section “Evaluation of the proposed heuristic approach” focuses on evaluating the proposed heuristic approach. Section “Results and discussion” describes the results and discusses the proposed system in comparison with the existing BATS and IDEA algorithms. Finally, con-cluding remarks and future directions are presented in Section“Conclusion”.
Related work
computing. Multi criteria decisions and multiple attri-butes are considered. Polverini et al. [12] introduced the optimized cost of energy and queuing delay constraints. Alejandra et al. [13] proposed the use of meta-heuristic optimization and particle swarm optimization to reduce execution costs through scheduling. Keshk et al. [14] proposed the use of modified ant colony optimization in load balancing. This method improves the makespan of a job. This system does not consider the availability of resources or the weight of tasks. Shamsollah et al. [15] proposed a system based on a multi-criteria algorithm for scheduling server load. Shamsollah et al. [16] pro-posed a system based on priority for performing divisible load scheduling that employs analytical hierarchy process. Gougarzi et al. [17] proposed a resource alloca-tion problem that aims to minimize the total energy cost of cloud computing systems while meeting the specified client-level SLAs in a probabilistic sense. Here, authors have applied a reverse approach that applies a penalty if the client does not meet the SLA agreements. Some authors have implemented a heuristic algorithm to solve task scheduling and resource allocation problem de-scribed above. Radojevic et al. [18] introduced central load balancing decision model for use in cloud environ-ments; this model automates the scheduling process and reduces the role of human administrators. However, this model is deficient in determining the capabilities of nodes and, configuration details, and the complete sys-tem has no backup, thus resulting in a single point of failure. In addition, Ghanbari et al. [19] and Goswami et al. [20] focus on scheduling tasks while considering various constraints. This state-of the art motivates the authors of this study to conduct additional research on task scheduling and resource allocation.
Input data
Cybershake scientific workflow
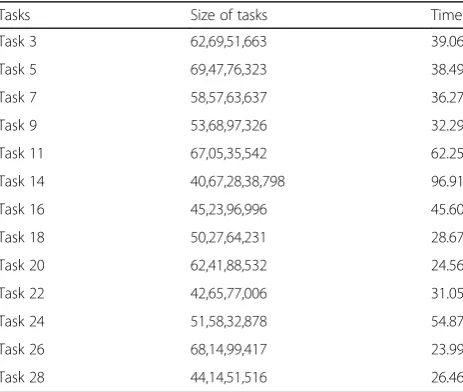
Cloud computing is the service provider paradigm in which users submit requests for execution. Thus, the responsibility of the cloud service provider is to schedule various requests and manage resources efficiently. To the best of the authors’ knowledge, most existing work involves scheduling tasks once they enter a task queue. However, the actual procedure of scheduling tasks and resource management begins with how the service provider addresses incoming tasks. The pro-posed system uses Cybershake scientific workflow data as in-put tasks [21]. Fig.1shows a visualization of the Cybershake scientific workflow, which is used by the Southern California Earthquake Center (SCEC) to characterize earthquake haz-ards using the Probabilistic Seismic Hazard Analysis (PSHA) technique. It also generates Green strain tensors (GSTs). Table 1 shows the Cybershake seismogram syn-thesis tasks with their sizes and execution times. The Cybershake is a collection of various node data that are
available for study [22]. The Cybershake scientific work-flow sample tasks are available with task size 30,50,100 and 1000. From a computational point of view, the seis-mogram synthesis tasks are quite demanding. The Cyber-shake spends a lot of time on seismogram synthesis during its execution. These types of tasks also require large amount of computational resources, such as CPU time, and memory.
Cybershake scientific workflow has been divided into 5 steps.
1. Extract GST - This step of the workflow extracts the GST (Green strain tensor) data for processing. 2. Seismogram synthesis–These tasks are the most
computationally intensive. Most of the time spent in running the Cybershake algorithm is employed on this step.
3. ZipSeis–This step aggregates the processed data.
Fig. 1Cybershake scientific workflow
Table 1Cybershake seismogram synthesis tasks
Tasks Size of tasks Time
Task 3 62,69,51,663 39.06
Task 5 69,47,76,323 38.49
Task 7 58,57,63,637 36.27
Task 9 53,68,97,326 32.29
Task 11 67,05,35,542 62.25
Task 14 40,67,28,38,798 96.91
Task 16 45,23,96,996 45.60
Task 18 50,27,64,231 28.67
Task 20 62,41,88,532 24.56
Task 22 42,65,77,006 31.05
Task 24 51,58,32,878 54.87
Task 26 68,14,99,417 23.99
4. PeakValCalcOkaya–The highest-strength values of each seismogram are calculated in this step. 5. ZipPSA - This step aggregates the processed data.
Epigenomics scientific workflow
Figure2shows the Epigenomics scientific workflow [22], which is used to automate the process of genome sequencing. This operation is associated with resource-intensive tasks. The generated data are converted into files and forwarded to Mag system. This process also involves many operations, and these operations are time consuming.
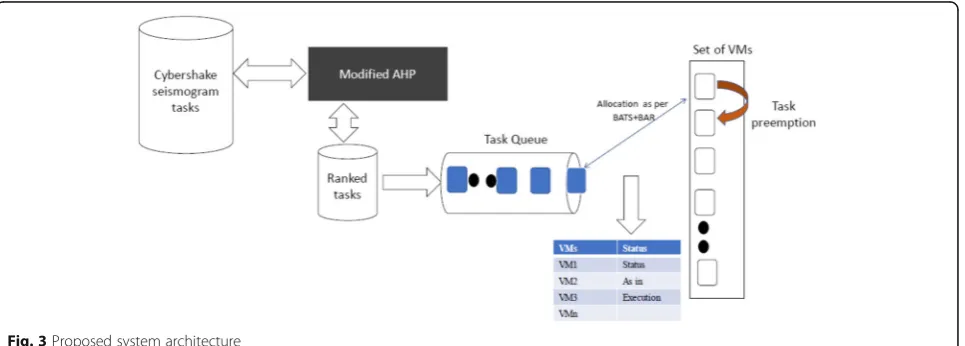
Proposed system
Figure3 shows the architecture of the proposed system. In practice, various types and sizes of tasks arrive at the cloud data centers for execution. The proposed system takes the real tasks as an input, as described in Section
3. In general, scientific tasks represent collections of different types and sizes. To manage the tasks that come into a cloud data center, the proposed system uses the analytic hierarchy process (AHP). The primary aim of this proposed system is to manage incoming tasks. Therefore, the proposed system uses the AHP method-ology to assign a rank to each task based on its length and run time. The procedure for ranking the tasks for scientific workflows is described in section 5.1. As soon as the tasks are assigned individual rankings, they are collected and arranged into task queues. The tasks in the task queue are strictly arranged following the AHP ranking. Thus, the first stage of the proposed system is completed. Next, in the second stage, the proposed sys-tem also addresses the computing resources of cloud data centers, such as CPU, memory and bandwidth using the proposed BATS+BAR optimized allocation methodology. This methodology works as follows. It takes the task to be executed from the task’queue. The assignment of resources and tasks follows the allocation Eq. 4. A detailed explanation is given in section 5.2. This stage is the second part of the procedure in which the allocations of resources have been carried out using BATS+BAR. In the next part, the proposed system uses a preemption methodology, i.e., the preemption method. LEPT continuously checks the load of the vir-tual machine. If it is exceeded the proposed system then uses a virtual machine status table to determine the current status of other virtual machines (VMs). In this regard, if the current virtual machine is overloaded and others are idle, then such VMs are located. After this identification, the proposed system uses a divide-and-conquer methodology, which breaks up the task and distributes it to other virtual machines, as de-scribed in detail in section 5.3. In this way, the pro-posed system has overcome the limitations of BATS in terms of the allocation of resources on the basis of CPU, memory and bandwidth. If any one resource (CPU,
Fig. 2Epigenomics scientific workflow
memory, bandwidth) is not available in sufficient amounts, then the tasks must wait. In addition, existing systems do not consider preemption, and the inputs to existing sys-tems are tasks of the same size. Fig.4presents a flow chart that represents the proposed heuristic approach.
Proposed methodology
Here, we provide a detailed explanation of the proposed system to overcome the scheduling challenge.
Analytic hierarchy process
The analytic hierarchy process [23] is designed to solve complex problems with multiple criteria. The proposed system uses this procedure in cloud comput-ing environments to rank the incomcomput-ing tasks in a certain manner. The proposed system uses scientific workflow tasks, such as those of Cybershake and Epigenomics, for experiments because such require long execution times. Initially, the workflow is divided into five stages, which are introduced in the input data section. Before proceeding with the proposed system, the AHP methodology is applied for the
Fig. 4Proposed system flowchart
Fig. 5Complete Bipartite graph
Table 2Numerical saaty preferences
Numerical rating Judgment preference
9 Extremely preferred
8 Very strongly to extremely preferred
7 Very strongly preferred to preferred
6 Strongly to very strongly
5 Strongly preferred
4 Moderately to strongly preferred
3 Moderately preferred
2 Equally to moderately preferred
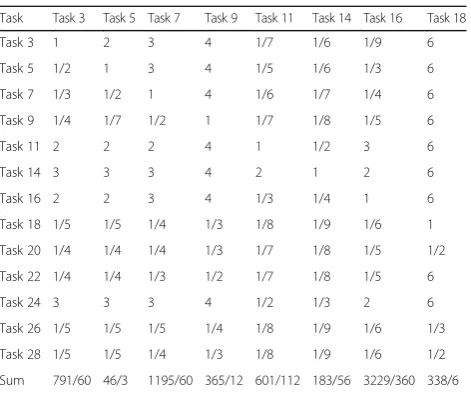
overall Cybershake workflow. The Cybershake work-flow is control work-flow dependent; thus, the second stage will execute only after the execution of the first stage. To evaluate preferences, the proposed system uses the Saaty preference table, which is given in Table 2 with its numerical ratings. To promote understanding while accounting for space limitations, the proposed system divides each calculation table into two parts. The first part extends from Task 3 to Task 18, whereas the other part shows the calculations from Task 20 to Task 28.
Here, the proposed system considers two significant cri-teria that are involved in scientific tasks; task length and task run time. The comparison numerical ratings are given in Table2, which is known as the Saaty preference table. Before
the actual calculation is begun, the proposed system assigns preference values to the tasks. Here, the preferences associ-ated with the tasks are based on their lengths and the execu-tion times of the different tasks. The proposed system slightly modifies the Saaty table preferences because, as tasks with different ranks are on a server, the ranks of subsequent tasks change, and new rankings must be calculated. The pro-posed system calculates such rankings of tasks. Tables 3 and4show the assignment of Saaty preferences according to comparing the sizes and runtimes of tasks. In the bottom row, the sum of each column is noted.
Tables5and6show the multiplication of the Saaty pref-erence values by the results arranged in the bottom rows of Tables3and4and then present the results of adding each column at the bottom.
Table 3Summation of each column-I
Task Task 3 Task 5 Task 7 Task 9 Task 11 Task 14 Task 16 Task 18
Task 3 1 2 3 4 1/7 1/6 1/9 6
Task 5 1/2 1 3 4 1/5 1/6 1/3 6
Task 7 1/3 1/2 1 4 1/6 1/7 1/4 6
Task 9 1/4 1/7 1/2 1 1/7 1/8 1/5 6
Task 11 2 2 2 4 1 1/2 3 6
Task 14 3 3 3 4 2 1 2 6
Task 16 2 2 3 4 1/3 1/4 1 6
Task 18 1/5 1/5 1/4 1/3 1/8 1/9 1/6 1
Task 20 1/4 1/4 1/4 1/3 1/7 1/8 1/5 1/2
Task 22 1/4 1/4 1/3 1/2 1/7 1/8 1/5 6
Task 24 3 3 3 4 1/2 1/3 2 6
Task 26 1/5 1/5 1/5 1/4 1/8 1/9 1/6 1/3
Task 28 1/5 1/5 1/4 1/3 1/8 1/9 1/6 1/2
Sum 791/60 46/3 1195/60 365/12 601/112 183/56 3229/360 338/6
Table 4Summation of each column-II
Task Task 20 Task 22 Task 24 Task 26 Task 28
Task 3 8 5 1/8 9 7
Task 5 8 5 1/4 9 7
Task 7 8 5 1/5 9 7
Task 9 8 5 1/6 9 7
Task 11 8 5 3 9 7
Task 14 8 5 2 9 7
Task 16 8 5 1/2 9 7
Task 18 8 1/2 1/7 9 7
Task 20 1 1/3 1/6 9 1/2
Task 22 8 1 1/6 9 7
Task 24 8 5 1 9 7
Task 26 1/2 1/4 1/7 1 1/3
Task 28 8 1/3 1/7 9 1
Sum 179/2 509/121 2161/280 109 431/6
Table 5Normalization of column value-I
Tasks 3 5 7 9 11 14 16 18
3 60/791 6/46 35/239 48/365 16/601 28/549 40/3229 9/84
5 30/791 3/46 35/239 48/365 112/300 28/549 120/3229 9/84
7 20/791 3/92 60/119 48/365 56/1803 8/183 90/3229 9/84
9 15/791 1/46 6/239 12/365 16/601 7/183 70/3229 9/84
11 120/791 6/46 24/239 48/365 112/601 28/183 1080/3229 9/84
14 180/791 9/46 35/239 48/365 224/601 56/183 720/3229 9/84
16 120/791 6/46 35/239 49/365 112/1803 14/183 360/3229 9/84
18 12/791 3/230 3/239 4/365 14/601 56/1647 60/3229 6/338
20 15/791 3/184 3/239 4/365 16/601 7/183 72/3229 3/338
22 15/791 3/184 4/239 6/365 16/601 7/183 72/3229 9/84
24 180/791 9/46 35/239 48/365 56/601 56/549 720/3229 9/84
26 12/791 3/230 12/119 3/365 14/601 56/1647 60/3229 1/168
28 12/791 3/230 3/239 4/365 14/601 56/1647 60/3229 3/338
Sum 1 0.96 0.9723 1 1.0576 0.9817 1.09 1.005
Table 6Normalization of column value-II
Tasks 20 22 24 26 28
3 16/179 60/509 35/2161 9/109 42/431
5 16/179 60/509 70/2161 9/109 42/431
7 16/179 60/509 65/2161 9/109 42/431
9 16/179 60/509 140/6483 9/109 42/431
11 16/179 60/509 840/2161 9/109 42/431
14 16/179 60/509 560/2161 9/109 42/431
16 16/179 60/509 140/2161 9/109 42/431
18 16/179 16/509 40/2161 9/109 42/431
20 2/179 4/509 140/6483 9/109 3/43
22 16/179 12/509 140/6483 9/109 42/431
24 16/179 60/509 280/2161 9/109 42/431
26 1/179 3/509 40/2161 1/109 2/43
28 16/179 4/509 40/2161 9/109 6/43
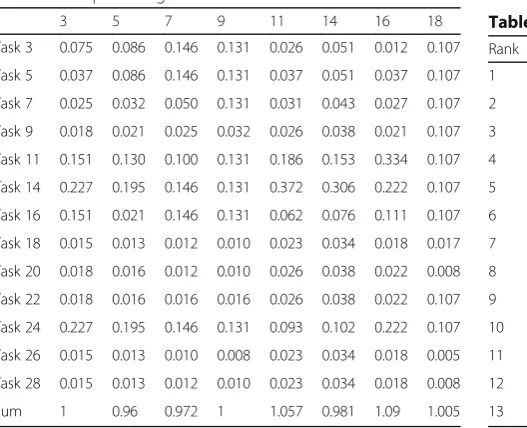
Tables7and8show the normalized values of Tables5 and 6, which appear earlier in the manuscript. These tables include average at the bottom. The results show that the summation of each column is equal to 1.
After this calculation, the rankings of Cybershake seismogram synthesis scientific workflow tasks are given in Table9.
BATS+ BAR system
The proposed system has two aspects, which involve scheduling tasks and managing resources. Here, we improve upon the BATS algorithm, which was originally proposed by Weiwei Lin [7]. Independent tasks of equal size are considered in the design of this system. How-ever, in allocating resources, the system does not con-sider the load on virtual machines because the waiting period for the tasks is long. In other cases, one virtual machine is busy while it executes a task, whereas others
are occupied and waiting for jobs. The bar systems (BSs) algorithm was proposed by Acebo and Rosa (2008) [24]. The social behavior of bartenders is the basis of BS systems. Swarm intelligence has added an optimization aspect to BS. In a bar, bartenders must act in a highly dynamic, asynchronous and time-critical environment, and no obvious greedy strategy (such as serving the best customer first, serving the nearest customer first or serv-ing the first-arrivserv-ing customer first) gives good results. Thus, multi-agent systems provide a good framework within which to address the challenge of developing a new class of adaptive and robust systems. In general, the crucial step in the BS algorithm is the choice of the task that the agent must execute in the next time step. In BSs, agents acting as bartenders, operate concurrently in Table 7Compute weighted sum-I
3 5 7 9 11 14 16 18
Task 3 0.075 0.086 0.146 0.131 0.026 0.051 0.012 0.107
Task 5 0.037 0.086 0.146 0.131 0.037 0.051 0.037 0.107
Task 7 0.025 0.032 0.050 0.131 0.031 0.043 0.027 0.107
Task 9 0.018 0.021 0.025 0.032 0.026 0.038 0.021 0.107
Task 11 0.151 0.130 0.100 0.131 0.186 0.153 0.334 0.107
Task 14 0.227 0.195 0.146 0.131 0.372 0.306 0.222 0.107
Task 16 0.151 0.021 0.146 0.131 0.062 0.076 0.111 0.107
Task 18 0.015 0.013 0.012 0.010 0.023 0.034 0.018 0.017
Task 20 0.018 0.016 0.012 0.010 0.026 0.038 0.022 0.008
Task 22 0.018 0.016 0.016 0.016 0.026 0.038 0.022 0.107
Task 24 0.227 0.195 0.146 0.131 0.093 0.102 0.222 0.107
Task 26 0.015 0.013 0.010 0.008 0.023 0.034 0.018 0.005
Task 28 0.015 0.013 0.012 0.010 0.023 0.034 0.018 0.008
Sum 1 0.96 0.972 1 1.057 0.981 1.09 1.005
Table 8Compute weighted sum-II
20 22 24 26 28 Average of I and II
Task 3 0.089 0.117 0.016 0.082 0.097 0.079
Task 5 0.089 0.117 0.032 0.082 0.097 0.116
Task 7 0.089 0.117 0.026 0.082 0.097 0.065
Task 9 0.089 0.117 0.021 0.082 0.097 0.053
Task 11 0.089 0.117 0.388 0.082 0.097 0.158
Task 14 0.089 0.117 0.259 0.082 0.097 0.180
Task 16 0.089 0.117 0.064 0.082 0.097 0.096
Task 18 0.089 0.011 0.018 0.082 0.097 0.033
Task 20 0.011 0.007 0.021 0.082 0.069 0.026
Task 22 0.089 0.023 0.021 0.082 0.097 0.055
Task 24 0.089 0.117 0.129 0.082 0.097 0.133
Task 26 0.005 0.005 0.018 0.009 0.046 0.016
Task 28 0.089 0.007 0.018 0.082 0.139 0.036
Sum 1 1.066 1.034 1 1.351 1.046
Table 9AHP rankings of cybershake seismogram synthesis tasks
Rank Before AHP After AHP
1 Task 5 Task 26
2 Task 3 Task 20
3 Task 9 Task 18
4 Task 7 Task 28
5 Task 20 Task 09
6 Task 22 Task 22
7 Task 11 Task 07
8 Task 24 Task 03
9 Task 16 Task 16
10 Task 26 Task 05
11 Task 14 Task 24
12 Task 28 Task 11
an environment in a synchronous manner; that is, they execute tasks by deciding which drinks to pour. After an initial phase, the“bartenders”make their decisions accord-ing to different problem-dependent properties (e.g. weight, speed, location, response time, maximum load, etc.), in-stead of making decisions randomly. Over time, if an agent is unable to adapt the environment to the preconditions of the task (such as the cost for the agent to execute the task in the current state of the environment) or if it is unable to carry the task out by itself, it will be eliminated. To over-come this behavior, we propose modifying BATS by adding a BAR system. The procedure is as follows:
1. Aggregate all of the task information that is ordered by rank.
2. Virtual machine (server) information is collected. This information includes the initial load on the virtual machine, its bandwidth and the time required to process the tasks on the server.
3. A bipartite graph is generated with the number of tasks. The ranking priorities, can be used to con-structed a graph, by which each task is allocated to a virtual machine.
The Load on the virtual machine(S) is calculated as,
Lini¼L
sini j s⊂S ð1Þ
The bandwidth is calculated as,
DBw¼b’i<¼bi ð2Þ
The total time taken to process the tasks is calculated as,
Lsfinð Þ ¼α Lsð Þα ð3Þ
Where, (α) = any task.
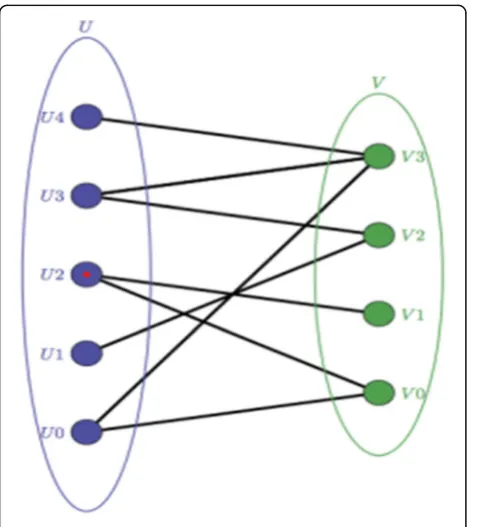
Bipartite graph
A bipartite graph is produced based on the following conditions:
1. A bipartite graph is constructed as-, G = (TnU S, E) in which‘Tn’represents the number of tasks,‘S’represents the servers, and‘E⊆T X S’that is, the set of edges that are present between the task and the server. An edge represents the tasks‘Ti⊂Tn’, which are present on virtual machine‘s⊆S’. A graph is constructed using bipartite graph with the number of tasks. 2. Balance the constructed graph with constraints
including the local cost, the initial load and the bandwidth.
3. Based on the local cost and the initial load we compute the total load on the virtual machine.
Ls¼LsiniþTN Sj
:Cloc ð4Þ
4. Next, we apply the condition represented by Eq.4. If this condition is satisfied, then we allocate the tasks to that particular virtual machine. If this condition is not satisfied by that virtual machine, then we move on the next server and check this condition. 5. After allocating the tasks, the constructed bipartite
is updated if any task remain to be processed. Fig.5
is the bipartite graph of the set of virtal machine and set of resources.
After allocating the tasks, the constructed bipartite is updated if any task remain to be processed
Preemption of the task
As described in earlier sections, the proposed system ranks the tasks and allocates them as per the constraints of bandwidth and load on the virtual machine. The proposed system next checks the tasks’ preemption conditions according to the LEPT policy. Before a task is preempted, we must check the status of the existing virtual machine (i.e. whether it is free or busy).
The system considers situations in which the resource-intensive tasks are still running on allocated virtual machines while other VMs are waiting for tasks at the same time. Therefore, the tasks must be distributed
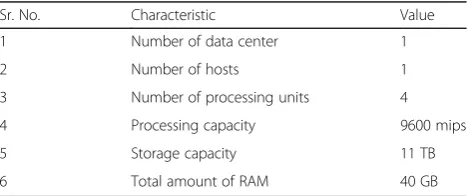
Table 10Data center information
Sr. No. Characteristic Value
1 Number of data center 1
2 Number of hosts 1
3 Number of processing units 4
4 Processing capacity 9600 mips
5 Storage capacity 11 TB
among the free VMs. However, we must first consider how and when to preempt tasks.
Here, we propose a mathematical description of the preemption scenario,
Given the ranking of the tasks, they are allocated to the VMs using a bipartite graph, but the issue is now one oftime,
Suppose‘P1’-‘VM1’has complete‘t1’, or VMn-1 has completed at time∑Pn-1. However, one VM is stillrunning with high-priority tasks, and its processing time is also greater.
Therefore, we preempt the task per the following methodology. Before preempting, we should check the status of the VM (i.e. whether it is free or busy).
V¼ mintn; tm
1
λnþλmþ λn λnþλmþV
ðf gn Þ þλnλnþλm Vðf gm Þ
ð5Þ
Here
V(t) denotes the expected value of the minimum remaining time needed to finish all of the jobs given the set
t = {t1,———,tn}
V*(t) denotes the time quantity t = {t1,——————, tn}
V* denotes the expected value of the remaining completion time when no task has yet been completed i.e., all tasks are in the running state.
λtndenotes the experimentally distributed time required for task tn
λtmdenotes the experimentally distributed time required for task tm.
1
⋋ tnþ⋋ tm
þ ⋋tn
⋋ tnþ⋋ tm V
ðf gtn Þ
ð6Þ
Eq. 6is the probability that task n (m) is the first task to be completed, multiplied by the expected remaining time needed to complete the tn-1tasks.
⋋ tm ⋋ tnþ⋋ tmV
ðf gm Þ ð7Þ
We can rewrite Eq.5in the following way:,
0¼ minn;mð1þ⋋ tnðVðf gtn Þ−VÞ þ⋋ tm ðVðf gtn Þ−VÞ
þð⋋ tnþ⋋ tmÞðV−VÞÞ
ð8Þ
Becauseλ1 andλ2 are the two smallestλt values, V*≥V. The last term is minimized by tn,tm = 1, 2 of the second and third terms.
Table 11Data center configuration details
Sr. No. Characteristic Value
1 Allocation policy BATS +BAR
2 Architecture X86
3 Operating system Linux
4 Hypervisor Xen
5 Upper threshold 0.8
6 Lower threshold 0.2 GB
7 VM migration Enabled
8 Monitoring interval 180
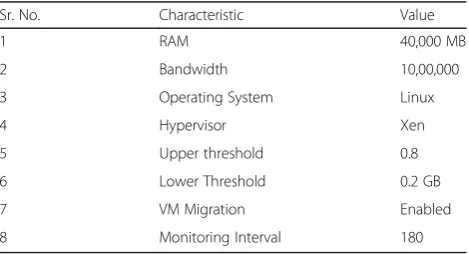
Table 12Host configuration details
Sr. No. Characteristic Value
1 RAM 40,000 MB
2 Bandwidth 10,00,000
3 Operating System Linux
4 Hypervisor Xen
5 Upper threshold 0.8
6 Lower Threshold 0.2 GB
7 VM Migration Enabled
8 Monitoring Interval 180
Table 13Customer configuration details
Sr. No. Information Contains
1 User 1
2 Cloudlets sent per minutes 50
3 Avg. length of cloudlet 50,000
4 Avg. cloudlet file size 500 bytes
5 Avg. cloudlet output size 500 bytes
Table 14Customer configuration details
Sr. No. Information Contains
1 Number of VMs 20
2 Avg. image size 1000 bytes
3 Avg. RAM 512 MB
4 Avg. bandwidth 1,000,000 Mbps
5 Procedure element 1
6 Priority 1
7 Hypervisor Xen
Ctn¼⋋ tn ðVðf gtn Þ − VÞ ð9Þ
Moreover, let,
Dtn;m ¼ Ctn − Ctm ð10Þ
Here
Ctndenotes the time at which the first VM has finish its task execution
Ctm denotes the last task completed by another VM
D denotes the difference between the completion of the first task and that of the last task i.e., in Eq.10
Substituting for Ctnand Ctm. Eq.10becomes,
⋋tn V
ðf gn Þ−V
ð Þ þ ⋋tm ðVf gÞm −VÞ ð11Þ
Equation11is minimized by j,k = 1,2 Let,
⋋tn ∠⋋tm≅Ctn ≤ Ctm ð12Þ
Therefore, we must improve D to obtain better results. Ctn and Dtn,m are considered to be functions of
λ1————λn.
Assuming tasks tn and tm are not members of set t,
we define Ctn(t) and Dtn,m (t); Ctn and Dtn,m
Ctnð Þ ¼t ⋋tn V
t U tn ð Þ−Vð Þt
ð Þ ð13Þ
Before, the procedure can continue, a number of identities must be formally described. If tn and tm are
the two smallest tasks in set J, the LEPT process tasks tn and tm will be executed first.
The following condition is the first task comple-tion result.
Vð Þ ¼t 1
⋋tnþ⋋tm
þ ⋋tn ⋋tnþ⋋tmV
t U t
n f g
ð Þ
þ ⋋tn ⋋tnþ⋋tmV
t U ftn g
ð Þ
ð14Þ
Equation14can be rewritten as follows:
⋋tnþ⋋tm
ð ÞV ð Þ ¼t 1þ⋋
tnV
t U t
n ð Þ
ð Þ
þ ⋋tmV ðt U tð Þm Þ
ð15Þ
Fig. 6Turnaround time
Fig. 7Turnaround time
Table 15Comparison of the proposed heuristic approach with the BATS and IDEA frameworks in terms of TAT in ms
Tasks BATS with
20 VM
IDEA with 20 VM
Heuristic approach with 20 VM
Task 3 3599.29 3666.27 2832.94
Task 5 3599.29 3666.27 2914.42
Task 7 3599.29 3666.27 2913.87
Task 9 3599.29 3666.27 2911.75
Task 11 3599.29 3666.27 2907.67
Task 14 3599.29 3666.27 2772.11
Task 16 3599.29 3666.27 2857.89
Task 18 3599.29 3666.27 2855.97
Task 20 3599.29 3666.27 2833.36
Task 22 3599.29 3666.27 2834.72
Task 24 3599.29 3666.27 2841.49
Task 26 3599.29 3666.27 2832.86
Task 28 3599.29 3666.27 2833.96
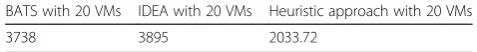
Table 16Comparison of the proposed heuristic approach with the BATS and IDEA frameworks in term of TAT in ms
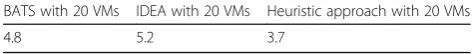
BATS with 20 VMs IDEA with 20 VMs Heuristic approach with 20 VMs
Similarly, the exponentially distributed processing times for 3 tasks are approximately λ1, λ2, λ3. Next, we substitute these values into Eq. 13,
Given tn=λ1, tm=λ2, and tp=λ3, Eq. 13 becomes,
λ1þλ2þλ3
ð ÞC1¼λ1ðλ1þλ2þλ3ÞVðf g1 Þ − λ1 ðλ1þλ2þλ3Þ V
ð16Þ
λ1þλ2þλ3
ð ÞC1¼λ1ð1þλ1 Vf g þ1 λ2 Vf1;2g
þλ3 Vf1;3gÞ
–λ1ð1þλ1 V f g1 þλ2 V f g þ2 λ3 Vf gÞ3
ð17Þ
ðλ1þλ2þλ3ÞC1¼λ1ðλ3Vf1;3g − λ3Vf g3 þλ2ðλ1Vf1;2gÞ
–λ1V f g þ2 λ3 A1
ð18Þ
Thus, Eq.18gives the value of the respectiveλ.
λ1þλ2þλ3
ð ÞC1¼λ1ðλ3Vf1;3g λ3Vf g3
þλ2ðλ1V f1;2gÞ λ1Vf g þ2 λ3 A1
ð19Þ
Alternatively,
λ1þλ2
ð ÞC1¼λ1C3 1ð Þ þλ2C1ð Þ2
λ1þλ2
ð ÞC2¼λ1C2ð Þ þ1 λ2C3ð Þ2
λ1þλ2
ð ÞCt¼λ1Ctð Þ þ1 λ2Ctð Þ2
For,
T= 1, 2——n. Thus,
D12= Ct1- Ct2if
D12¼ λt1 λt1þλt2
D32ð Þ þ1 λt2 λt1þλt2
D13ð Þ2
Fig. 8Response time for cybershake tasks
Fig. 9Response time for epigenomics tasks
Table 17Comparison of proposed heuristic approach with the BATS and IDEA frameworks in terms of RT in ms
Tasks BATS with
20 VMs
IDEA with 20 VMs
Heuristic approach with 20 VMs
Task 3 5.1 5.3 2.83
Task 5 5.1 5.3 2.91
Task 7 5.1 5.3 2.9
Task 9 5.1 5.3 2.91
Task 11 5.1 5.3 2.90
Task 14 5.1 5.3 2.77
Task 16 5.1 5.3 2.85
Task 18 5.1 5.3 2.85
Task 20 5.1 5.3 2.83
Task 22 5.1 5.3 2.83
Task 24 5.1 5.3 2.84
Task 26 5.1 5.3 2.83
Task 28 5.1 5.3 2.83
Table 18Comparison of the proposed heuristic approach with the BATS and IDEA frameworks in term of RT in ms
BATS with 20 VMs IDEA with 20 VMs Heuristic approach with 20 VMs
D2t¼ λt1 λt1þλt2
D2tð Þ þ1 λ λt2 t1þλt2
D3tð Þ2
We now assume as a hypothesis that
⋋tn<⋋tnand λ1…… ≤λn;
In that case, Dn,m≤0
and,
dD12
d⋋t1 ≥
0
In the second part of the proof, two in equalities are shown by induction on ‘n’, when n= 2
Dtn;m ¼ ⋋⋋tn−⋋tm tnþ⋋tm
ð20Þ
The two inequalities can be easily produced.
Assume that the two inequalities of the induction hy-pothesis hold when there are fewer than ‘n’ tasks remaining to be processed. The induction hypothesis then implies that Dt13 (2) and Dt23(1) are non-positive
when there are ‘n’ tasks remaining to be completed. It also requires
dDt13 2f g
d⋋t1 ≥
0 ð21Þ
The inequality presented in Eq. 21 has the follow-ing implications.
If increases, then dDt13(2) increases. The moment
λt1 reaches the value of λt2 tasks 1 and 2 are inter-changeable. Here, instead of changing task 2 and task 1 we break the respective tasks and migrate them onto other virtual machine.
Divide-and-conquer methodology
After, the tasks have been preempted, we apply the divide-and-conquer methodology by following the steps shown below.
Evaluation of the proposed heuristic approach
Experimental setup
The proposed heuristic approach is simulated on a cloud computing environment [25] that provides a real-time
and capacity. Every data center component generates a set of strategy for allocating bandwidth, memory and storage devices for hosts and virtual machines. Table11 shows the configuration for the data center, including its allocation policy, architecture, OS, hypervisor, schedul-ing and monitorschedul-ing interval, and threshold value, among other properties. The host in the data center is built with the configuration such as RAM, bandwidth, storage cap-acity, power, processing elements etc. of the given task, the processing of which by a data center is listed in Table 12. Table 13 provides the details of the customer configuration. Table14provides a detailed description of the virtual machines.
Results and discussion
This section briefly describes the performance of the proposed heuristic approach.
Evaluation of turnaround time
To check the performance of our proposed heuristic ap-proach, we first apply the algorithm to Cybershake seis-mogram synthesis and Epigenomics scientific tasks, which are described in the input data section. The per-formance of the proposed heuristic approach is evalu-ated, in terms of the turnaround time, which is the span of time from the submission of the task to the
completion of the task. In Fig. 6 the Cybershake tasks are shown on the X axix, whereas time shown on the Y axis. When we compare our proposed heuristic ap-proach with the existing BATS [7] and IDEA [4] frame-works, we find that our approach displays reduced turnaround time. Fig.7illustrates the results for the Epi-gonomics tasks, for which the turnaround time is also comparatively small. Table15and Table16show the re-sults in tabular form.
Evaluation of response time
As a second performance metric, we consider the response time of the algorithm to incoming tasks. The response time is essentially the time during which the request is actually considered. In other words, we can say that the response time is directly dependent on the availability of resources. The avail-ability of resources is dependent up on the scheduling of tasks. If the scheduling of tasks is performed prop-erly, then the resources will naturally be free early or in advance of deadlines, the response times will be less in such cases.
By, comparing the response times obtained for our proposed heuristic approach with those obtained using the existing BATS and IDEA frameworks, we can see that our system’s response time is almost 50% less. The response time comparisons for Cybershake and Epigenomics are presented in Figs. 8 and 9 respectively. The comparison is also shown in tabular form in Tables17 and 18. We consider two parameters the response time and turnaround time compare the proposed heuristic approach with the existing BATS and IDEA
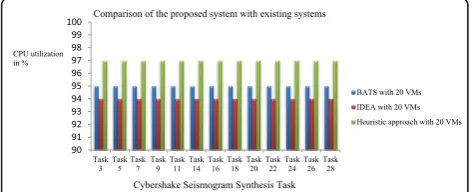
Fig. 10CPU utilization by Cybershake tasks
Fig. 11CPU utilization by Epigenomics tasks
frameworks. Because we are evaluating these frame-works in a cloud computing environment, the re-sponse time is generally less effective.
On the other hand, we also evaluated our proposed heuristic approach to determine its resource per-formance compare it to those of the existing BATS and IDEA frameworks.
Evaluation of CPU utilization
Figures 10 and 11 show key comparison of resource utilization between the proposed heuristic approach and existing BATS and IDEA frameworks. The proper utilization of resources produces profits for cloud computing service providers. The experimental results shows that the proposed heuristic approach utilized the CPU resource more efficiently than the existing BATS framework.
Evaluation of memory utilization
Figures 12 and 13 show the second key comparison of resource utilization between the proposed heu-ristic approach and the existing BATS and IDEA frameworks. The experimental results shows that the proposed heuristic approach utilizes memory re-sources more efficiently than the existing BATS and IDEA frameworks.
Evaluation of bandwidth utilization
Bandwidth, an important resource, is not considered in most existing frameworks. We take bandwidth into ac-count as a third important aspect of cloud computing data centers. We also compare our proposed heuristic approach with the existing BATS and IDEA frameworks. Figures 14 and 15 shows that our proposed heuristic approach utilizes bandwidth more efficiently than the existing BATS and IDEA frameworks.
Conclusion
In this study, we proposed heuristic algorithm that performs task scheduling and allocates resources effi-ciently in cloud computing environments. We use real Cybershake and Epigenomics scientific workflows as input tasks for the system. When we compare our proposed heuristic approach with the existing BATS and IDEA frameworks with respect to turnaround time and response time, we find that our approach gives improved results. On the other hand, from the viewpoint of re-source utilization, the proposed heuristic approach effi-ciently allocates resources with high utility. We obtained the maximum utilization result for computing resources such as CPU, memory and bandwidth. Most existing sys-tems consider only two resources, CPU and memory, in evaluating their performance the proposed system adds
Fig. 13Memory utilization for Epigenomics task
bandwidth as a resource. Future work will focus on more effective scheduling algorithms in which turn-around time and response time will be improved.
Abbreviations
AHP:Analytical hierarchy process; BATS: Bandwidth aware divisible task scheduling; FCFS: First come first served; GST: Green strain tensor; IDEA: Improved differential evolution algorithm; LEPT: Longest expected processing time; PSHA: Probabilistic seismic hazard analysis; SLA: Service level agreement
Acknowledgments
We would like to thank Mr. Amit Kolhe, the Managing Trustee of the Sanjivani College of Engineering, Kopargaon, India and the Principal of Thadomal Shahani Engineering College, Bandra (W), Mumbai, India, for providing the infrastructure needed to carry out the proposed research work.
Funding
Not applicable.
Availability of data and materials
The proposed heuristic approach is applied to real scientific tasks, i.e., Cybershake and Epigenomics, which are freely available for study and research. We provide the web site for these resources in the reference section under Reference-[22].
Authors’contributions
The work presented in this paper is based on Mahendra’s Ph.D. research and thesis, which was supervised by Dr. SKS, who is a professor and contributed equally to this research. We implemented and performed the simulations presented in this study. Both of the authors read and approved the final manuscript.
Competing interests
The authors declare that they have no competing interests.
Publisher’s Note
Springer Nature remains neutral with regard to jurisdictional claims in published maps and institutional affiliations.
Author details
1
Department of Information Technology, Thadomal Shahani Engineering College, Bandra (W), University of Mumbai, Mumbai, MS, India.2Lokmanya
Tilak College of Engineering, Kopar Khairane, University of Mumbai, Mumbai, MS, India.
Received: 3 May 2017 Accepted: 26 January 2018
References
1. Gubbi J, Buyya R, Marusic S, Palaniswami M (2013) Internet of things (iot): a vision, architectural elements, and future directions. Futur Gener Comput Syst 29(7):1645–1660
2. Mezmaz M, Melab N, Kessaci Y, Lee YC, Talbi E-G, Zomaya AY, Tuyttens D (2011) A parallel bi-objective hybrid meta heuristic for energy-aware scheduling for cloud computing systems. J Parallel Distributed Computing 71(11):1497–1508
3. Armbrust M, Fox A, Griffith R, Joseph AD, Katz R, Konwinski A, Lee G, Patterson D, Rabkin A, Stoica I et al (2010) A view of cloud computing. Commun ACM 53(4):50–58
4. Tsai J-T, Fang J-C, Chou J-H (2013) Optimized task scheduling and resource allocation on cloud computing environment using improved differential evolution algorithm. Comput Oper Res 40(12):3045–3055
5. Maguluri ST, Srikant R (2014) Scheduling jobs with unknown duration in clouds. IEEE/ACM Trans Netw (TON) 22(6):1938–1951
6. Cheng C, Li J, Wang Y (2015) An energy-saving task scheduling strategy based on vacation queuing theory in cloud computing. Tsinghua Sci Technol 20(1):28–39
7. Lin W, Liang C, Wang JZ, Buyya R (2014) Bandwidth-aware divisible task scheduling for cloud computing. Software: Practice and Experience 44(2):163–174 8. Ergu D, Kou G, Peng Y, Shi Y, Shi Y (2013) The analytic hierarchy process:
task scheduling and resource allocation in cloud computing environment. The Journal of Supercomputing. 64(3):835-848
9. Zhu X, Yang LT, Chen H, Wang J, Yin S, Liu X (2014) Real-time tasks oriented energy-aware scheduling in virtualized clouds. IEEE Transactions on Cloud Computing 2(2):168–180
10. Liu X, Zha Y, Yin Q, Peng Y, Qin L (2015) Scheduling parallel jobs with tentative runs and consolidation in the cloud. J Syst Softw 104:141–151 11. Shamsollah G, Othman M (2012) Priority based job scheduling algorithm in
cloud computing. Procedia Engineering 50:778–785
12. Polverini M, Cianfrani A, Ren S, Vasilakos AV (2014) Thermal aware scheduling of batch jobs in geographically distributed data centers. IEEE Transactions on Cloud Computing 2(1):71–84
13. Rodriguez MA, Buyya R (2014) Deadline based resource provisioningand scheduling algorithm for scientific workows on clouds. IEEE Transactions on Cloud Computing 2(2):222–235
14. Keshk AE, El-Sisi AB, Tawfeek MA (2014) Cloud task scheduling for load balancing based on intelligent strategy. Int J Intell Syst Appl 6(5):25 15. Ghanbari S, Othman M, Leong WJ, Bakar MRA (2014) Multi-criteria based
algorithm for scheduling divisible load. In: Proceedings of the first international conference on advanced data and information engineering (DaEng-2013), pp 547–554
16. Ghanbari S, Othman M, Bakar MRA, Leong WJ (2015) Priority-based divisible load scheduling using analytical hierarchy process. Appl Math Inf Sci 9(5):25–41 17. Goudarzi H, Ghasemazar M, Pedram M (2012) Sla-based optimization of power and migration cost in cloud computing. In Proceedings of the 2012 12th IEEE/ ACM International Symposium on Cluster, Cloud and Grid Computing (ccgrid 2012) (pp. 172-179). IEEE Computer Society
18. Radojevic B, Zagar M (2011) Analysis of issues with load balancing algorithms in hosted (cloud) environments. In: MIPRO, 2011 proceedings of the 34th international convention, pp 416–420
19. Ghanbari S, Othman M, Bakar MRA, Leong WJ (2016) Multi-objective method for divisible load scheduling in multi-level tree network. Futur Gener Comput Syst 54:132–143
20. Goswami S, Das A (2017) Optimization of workload scheduling in computational grid. In: Proceedings of the 5th international conference on Frontiers in intelligent computing: theory and applications, pp 417–424
21. Juve G, Chervenak A, Deelman E, Bharathi S, Mehta G, Vahi K (2013) Characterizing and profiling scientific workflows. Futur Gener Comput Syst 29(3):682–692
22. Center SC (2014) Cybershake and Epigenomics scientific workflow.
https://confluence.pegasus.isi.edu/display/pegasus/WorkflowGenerator. Accessed 1 Jan 2016
23. Handfield R, Walton SV, Sroufe R, Melnyk SA (2002) Applying environmental criteria to supplier assessment: a study in the application of the analytical hierarchy process. Eur J Oper Res 141(1):70–87
24. Del Acebo E, de-la Rosa JL (2008) Introducing bar systems: a class of swarm intelligence optimization algorithms. In: AISB convention communication, interaction and social intelligence, pp 18–23