R E S E A R C H
Open Access
Energy and macronutrient intake and dietary
pattern among school children in Bahrain: a
cross-sectional study
Nadia Gharib
1*and Parveen Rasheed
2Abstract
Background:Obesity is increasing in Bahrain and there is lack of information on the energy and macronutrient intake of children. The objective of this research was to study the energy and macronutrient intake as well as food frequency pattern of Bahraini school children.
Methods:This is a cross-sectional descriptive study conducted on Bahraini school boys and girls aged 6-18 years from all the 11 populated regions of the country. Data on food intake consisted of a 24-hour dietary recall and was obtained by interviewing a sub-sample of the study population. Information was also obtained through a self-administered questionnaire for the entire sample on the weekly frequency of food items that were grouped into 7 categories based on similarity of nutrient profiles. Dietary analysis was performed using the Nutritionist 5 (First Data Bank Version 1.6 1998).
Results:While the average energy intake of students was close to the Estimated Average Requirements of the UK Reference standards, protein intake substantially exceeded the Reference Nutrient Intake values as did daily sugar consumption. Dietary fiber fell short of the Dietary Recommended Values (UK) and 36%-50% students exceeded the Energy % limits for total fat, saturated fat and cholesterol. The Polyunsaturated: Saturated fat ratio remained at an unacceptable level of 0.6 for girls and boys. While sweets, snacks and regular soda drinks were popular, milk, fruits and vegetables were not commonly consumed.
Conclusions:High sugar consumption, low intake of dietary fiber and high energy % of saturated fat and dietary cholesterol by many Bahraini children, is likely to increase their risk of obesity and cardiovascular diseases in later life. Nutrition education programs in schools should emphasize the importance of healthy balanced diets for growth and health maintenance of children as well as dietary prevention of diseases.
Keywords:Energy and macronutrient intake, food frequency, energy % fat, saturated fat, overweight and obesity, Bahraini school children
Background
Increasing evidence suggests that diet and lifestyle in childhood and adolescence have a potential lifelong effect for risks of many chronic diseases such as obesity, coronary heart disease, hypertension, diabetes and cer-tain types of cancer [1-6]. The types of diet linked with chronic diseases are found to prevail before pubertal maturation, and children’s dietary patterns change only marginally during pubertal development [7]. Childhood
and adolescence are also considered two critical periods in the development of obesity, and hence, the preven-tion of obesity during this phase of life has been sug-gested as a public health priority [8,9].
With the progress of socio-economic status in Bahrain in recent years, there has been a substantial shift from traditional healthy foods, to diets consisting of high intake of fat, sugar and red meat [10,11] including wes-tern fast food. Research has shown that such diets have contributed to increased energy intake and consequently to increasing obesity in children and adults in this region [12-14]. The dietary habits of school children and * Correspondence: gharibn@gmail.com
1Nutrition Section/Ministry of Health, Manama, Bahrain
Full list of author information is available at the end of the article Gharib and RasheedNutrition Journal2011,10:62 http://www.nutritionj.com/content/10/1/62
adolescents are characterized by low intake of fresh fruits, vegetables and milk and a high intake of carbo-nated beverages and empty calorie foods [15]. Musaiger and Gregory reported that Bahraini teenagers are a group most susceptible to unsound food habits which places them at risk of an adverse nutritional status [16].
While studies have been conducted on the nutritional status and dietary habits of Bahraini children [12,15-20], there is lack of information on energy and macro- nutri-ent intake. Such information could guide us to suggest need based changes in the eating habits of children for delaying or preventing the development of chronic dis-eases. The current study addresses the intake of energy and macronutrients as well as food frequency in Bah-raini school children; a subsequent publication will focus on intake of micronutrients.
Methodology
Subjects and Methods
This is a cross-sectional descriptive study involving qua-litative and quantitative variables. The research was con-ducted from January/1999 to May/2001. The target population was Bahraini boys and girls of primary, inter-mediate, and secondary levels studying in public schools of the 11 populated regions of Bahrain.
Sampling
The sample size was determined as per standard method recommended by the WHO Expert Committee (1995) for studies on nutritional status [21]. By applying the standard formula, the estimated sample size obtained was 2443. The sample size finally chosen was 2594; however 32 students declined to participate in the study giving a response rate of 98.7%. A multi-stage sampling design was chosen that combined multi-cluster and sim-ple random sampling methods. Cluster sampling was used in two successive stages: first, for selection of the number of Bahraini students in proportion to the total number of students enrolled in each region; second for allocation of the schools in each region in proportion to the population size of the region. The allocated number of students from each level was chosen by randomly selecting few students from each class. There were 175 government schools, 88 for girls and 87 for boys enrol-ling a total of 104,189 Bahraini students (52,885 girls and 51,304 boys) from ages 6 to 18 years. Out of 54,782 primary level, 25,779 intermediate level and 23,628 sec-ondary level students, 1386 (2.5%), 596 (2.3%) and 612 (2.6%) students respectively, were chosen for the study sample. The distribution of primary schools in the dif-ferent regions ranged from 1 to 11, intermediate and secondary schools from 0 to 4. Selection of schools and number of students from each school is given in appen-dix 1/additional file 1 (decision by the editorial board)
Food frequency data was obtained for the entire sam-ple along with other nutritional status parameters that were objectives of a larger study. For the energy and macronutrient component of the study, a sub-sample of 500 students (~20% of the total sample), was selected by following a similar multi-stage sampling design as men-tioned above. Four students out of these refused to par-ticipate in the interview questionnaire on the 24-hour dietary recall, thus giving a response rate of 99% for this aspect of the study.
Ethical Considerations
Permission to conduct the study was obtained from the Ethical committees of the Ministry of Health and Minis-try of Education. Inclusion of a student in the study was determined by parental consent. All permission letters were sent to parents 3-4 weeks prior to the study allow-ing them adequate time to take a decision. Confidential-ity of information was assured to the parents and the children. Parents were informed if a student was found to have a nutritional health problem as determined by the different assessment methods that were part of the larger study.
Data Collection
The study instrument was a questionnaire which included information on the age and gender of the child, a 24-hour dietary recall and food frequency. Age was recorded in completed years and verified by the researcher (NG) from school records. While the food-frequency questionnaire was self-administered by all the selected students in the classroom, information on the 24-hour dietary recall was obtained for a sub-sample by interviews that were conducted in a special room in the school premises. Interviews were conducted by a trained nurse, a nutritionist or one of the investigators (NG). Care was taken to conduct the interviews in a
non-judg-mental manner. For children ≤ 10 years of age, the
interview for the 24-hour dietary recall was conducted in the presence of their mothers who were invited to attend the school on the day of the study. Most of the mothers in the girls’section attended the session but fewer mothers came in the boys’section. Mothers, who failed to attend the session, were contacted on telephone or home-visited by one of the interviewers to get data on the 24-hour dietary recall of their children. Effort was made to ensure that the child was present with his/ her mother at home during the interview session. Data for the 24-hour recall was obtained for all food eaten on the previous day from wake-up to bed time. Information collected represented food consumed on a week-day. Week-end food intake may be variable and hence may not be representative of the usual dietary pattern for most days. Mothers and children were not informed Gharib and RasheedNutrition Journal2011,10:62
http://www.nutritionj.com/content/10/1/62
about the method of data collection (24-hour dietary recall) prior to the study to avoid any bias which may have occurred due to change in the diet of children on the day before the interview.
During the interview, samples of local household dishes and utensils (different sizes of bowls, plates, cups, glasses, and spoons) were displayed to the child/mother. They were then shown pictures of common foods eaten in these dishes/utensils to indicate portion sizes con-sumed. One of the investigators (NG) had weighed dif-ferent portions of various food items, placed them in the dishes/utensils and photographed them prior to the survey. After a student/mother as child proxy had indi-cated the portion size of food consumed, the corre-sponding weight of that food was recorded in the 24-hour dietary questionnaire. The latter had a list of 156 different food/drink items including: milk and dairy pro-ducts, meat group, fast food types (local & interna-tional), bread and cereal group, mixed dishes eaten locally, vegetables and fruits, desserts and snacks, bev-erages (coffee & tea, juice, and fruit drinks), and other miscellaneous items. Some of these items were further classified, e.g.: type of milk (whole, low fat, or skim), type of meat eaten (boiled, fried, or grilled). There were open-ended questions for certain food items, e.g. type of fruit, vegetable and snack.
Mean energy and macronutrient intakes of the chil-dren were compared with the Dietary Reference Values (DRV) of the United Kingdom by age groups and gender [22]. Energy intake was compared to the Estimated Average Requirements (EARs) and macronutrient intake to the Reference Nutrient Intake (RNI) which is a value two notional standard deviations above EAR.
In addition, Energy percent (E%) from protein, carbo-hydrate and fat from total calories consumed, were assessed and compared to the DRVs recommended by the Committee on Medical aspects of Food Policy (COMA) [22].
To describe the potential effects of diet on serum lipid levels, dietary cholesterol levels and the Polyunsaturated to Saturated Fat Ratio (P: S ratio) were estimated. Diet-ary cholesterol intake of ≥ 300 mg and a P: S ratio of less than 1 was considered unacceptable [23].
Food Frequency Data
The food items were grouped into 7 categories based on similarity of nutrient profiles [24]. These categories were: (1) meats & alternatives, including fish, chicken, red meat, eggs, and legumes; (2) milk & dairy products; (3) cereals, including rice, bread, cornflakes, and pasta; (4) fruits & vegetables including leafy and other vegeta-bles; (5) sweets & snacks, including, cakes, chocolates, biscuits, candies, and crisps; (6) sauces & spreads,
including ketchup, hot sauce, jams, and butter; (7) soft drinks, including all fizzy drinks (regular & diet), fruit juices, tea and coffee. Response categories were never, 1-2 times a week, 3-4 times a week, and 5-7 times a week (almost daily).
Data Entry and Statistical Analysis
Dietary analyses were performed using Nutritionist 5 (First Data Bank, version 1.6, 1998) [25]. It is an Ameri-can food data base and nutrient analysis software that includes over 17,000 food items with approximately 80 nutrients and nutrient factors. It was also possible through this software to enter the ingredients of Bah-raini food recipes and obtain their nutrient content. Averages of energy and nutrient data by age groups and gender were then exported into Microsoft Excel 2000 (version 9.0). Statistical analyses were performed using Statistical Package for the Social Sciences (version 11.5, SPSS, 2002, SPSS Inc., Chicago, IL) for frequencies, means, standard deviations, and other descriptive and inferential statistics [26]. The chi-square, Kruskal-Wallis and Mann-Whitney tests were used where appropriate [27] A P-value less than 0.05 was considered to indicate statistical significance and a value of less than 0.01 as strongly significant.
Validity
Height and weight of these children was measured and BMI calculated as an objective of the larger study. Details of methods for the anthropometric measure-ments are described elsewhere [28]. We adopted the cri-teria of the World Health Organization for overweight status [29]. A comparison between the energy intake and the BMI status of students showed that the mean energy intake of the non-overweight (1775 Kcal/day) was significantly lower than those at-risk of overweight or overweight/obese (2182 Kcal/day) (p < 0.05). With these findings one can make some general assumptions on the validity of the students’reported energy intake.
Quality controls to improve reliability and validity included 1) a protocol that specified exact techniques for interviewing, recording and calculating results; 2) standardizing food portion sizes in commonly used dishes/utensils for quantification of foods and beverages consumed; 3) use of the American food data base, Nutritionist 5 [25]; 4) rigorous training of interviewers prior to the study and 5) involvement of mothers in the interview for children≤10 years old.
Results
The age of the students ranged from 6 to 18 years. Mean ages of the girls and boys were 12.63 (SD 3.27) and 12.45 (SD 3.39) respectively.
Gharib and RasheedNutrition Journal2011,10:62 http://www.nutritionj.com/content/10/1/62
1. Energy and Macronutrient Intake
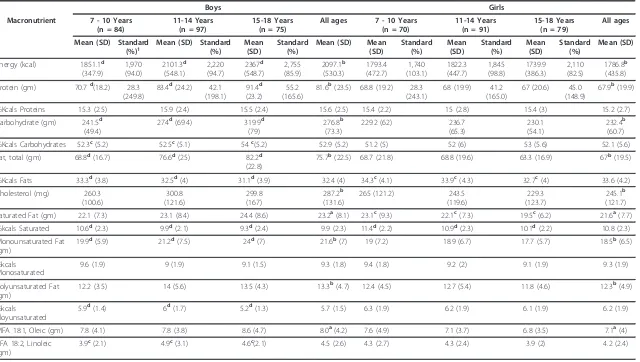
Overall, the mean energy intake of Bahraini students ranged between 82.5% and 103% of the recommended EARs for different age groups and gender. The percen-tage of mean energy intake when compared to the EAR values decreased with increasing age of boys and girls. Overall the mean energy intake in boys was significantly higher than that in girls (p < 0.01) and this pattern was consistent at all ages. (Table 1).
Table 1 shows that the mean intake of protein exceeded the RNI at all ages and in both genders. Chil-dren 7-10 years old consumed about 2.5 times more protein relative to RNI values whereas adolescent boys and girls consumed 1.5 times the RNI values. The Pro-tein E% from was 15.6% in boys and 15.2% in girls and these findings were close to the recommendations set by COMA [22] on energy intake from Protein (15%). The Protein E% did not change significantly with increasing age in boys and girls.
The mean daily intake of carbohydrate was signifi-cantly higher in boys (276.8 g ± 73.3) than in girls (232.4 g ± 60.7) (p < 0.01) (Table 1). This trend remained consistent for all age groups. In boys, carbohy-drate intake increased significantly with age up to 18 years (p < 0.01) but in girls, intake increased up to 14 years and decreased thereafter. The carbohydrate E% was 52.9% in boys and 52.1% in girls which is close to the recommendations of COMA [22] for energy intake from carbohydrate (50%). While in girls the E% from carbohydrate did not change with age, in boys, it signifi-cantly increased with age (p < 0.05).
The mean daily intake of total sugars (intrinsic and extrinsic sugars) of 101.3 g ± 37.3 for boys and 89.1 g ± 36.1 for girls was high according to the maximum recommended intake of 60 g/day by the DRV of UK [22]. Sugar consumption increased while lactose intake decreased with age. The mean daily intake of dietary fiber was significantly higher in boys (13.5 g ± 5.8) than in girls (12.4 g ± 5.9) (p < 0.05) (Table 1). For adoles-cents these values apparently fell short of the current recommendations for fiber intake [30-32].
The mean daily total fat intake for boys (75.7 g ± 22.5) was higher than that for girls (67 g ± 19.5) (p < 0.01) and this trend remained consistent in all age groups. Mean fat intake decreased in late adolescent girls. Over-all, boys had significantly higher mean daily intakes of monounsaturated and polyunsaturated fats than girls (p < 0.01; p < 0.01) (Table 1). The mean P: S ratio was 0.6 ± 0.2 for both boys and girls. The mean daily intake of cholesterol was 287.2 mg ± 131.6 for boys and 245.1 mg ± 121.7 for girls (p < 0.01). The Total fat E% was 32.4% for boys and 33.6% for girls and this was slightly lower than the recommendations set by COMA [22] for energy intake from fat (35%). The Total fat E%
did not change with age in girls but significantly decreased with age in boys (p < 0.01) (Table 1). The E% from saturated fat were slightly higher in girls (10.8%) than in boys (9.9%) (p < 0.01). The E% from saturated and polyunsaturated fats significantly decreased with age in boys (p < 0.01; p < 0.05)
According to the recommendations of the DRV stan-dards of COMA for children above 5 years, saturated fat and total fat should not provide more than 11% and 35% of total dietary energy respectively [22]. We found that 50.2% and 37.8% of girls and boys respectively, exceeded these limits for saturated fat and 46.9% and 39.2%, respectively for total fats. Diets of 35.8% girls and 50.2% boys contained more than 300 mg of cholesterol per day which is the suggested upper limit [33,34].
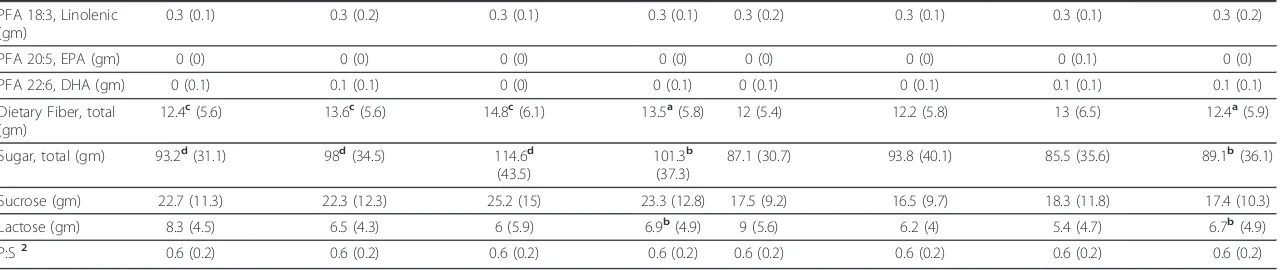
2. Mean Energy, E% of Macronutrients, Sugar, Fiber and P:S Ratio by Diets having Different Levels of Total Fat Contribution to Energy
Analysis was done to determine the association of mean energy intake, E% of macronutrients, dietary cholesterol, sugar and dietary fiber with diets having Total fat E% at 3 levels (< 30%, between 30-37%, and ≥38%). Table 2 shows that while Carbohydrate E%, sugar and dietary fiber were significantly higher in the less than more dense-fat diets (p < 0.01; p < 0.01; p < 0.01), a reverse trend was observed for fatty acids (saturated, monounsa-turated, and polyunsaturated) in the diet of girls and boys. Though not statistically significant, intake of dietary cholesterol (mg/1000 Kcal) was also found to increase with increasing density of total fat in diets. The P: S ratio remained below 1 at all 3 levels of fat-dense diets.
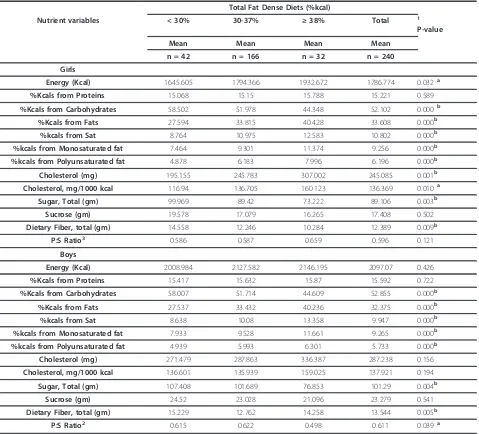
3. Food Frequency
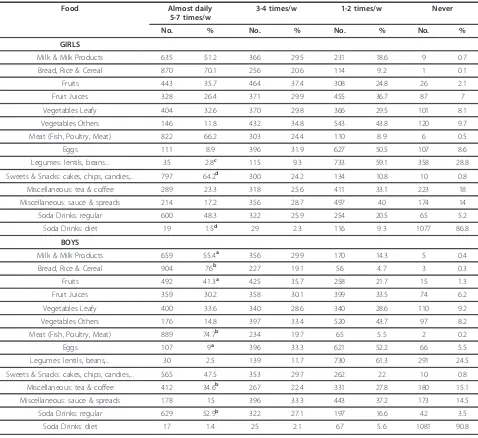
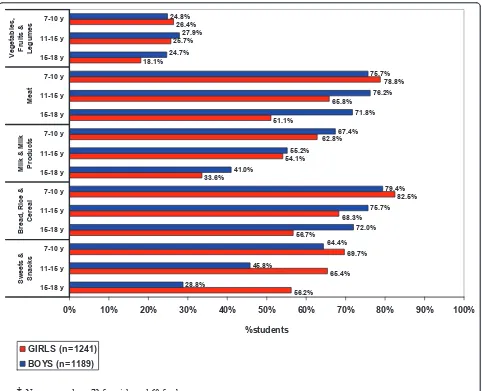
Table 3 shows that bread and cereal, meat group and sweets and snacks were the most commonly consumed daily food items among students. Only half of the children were consuming milk and its products and one-fourth of them were taking vegetables and fruits on a daily basis. However, regular soda drinks were consumed daily by approx. 50% of the children. Daily consumption of sweets and snacks was significantly more common in girls (64.2%) than in boys (47.5%) (p < 0.01). On the other hand, meat, milk and its products and tea/coffee were more popular with boys than girls (p < 0.01; p < 0.05; p < 0.01). Figure 1 shows that daily consumption of most food items in girls and milk and its products in boys decreased with age but intake of sweets and snacks increased with age in both genders.
Discussion
The current research is the first study to evaluate the energy and macronutrient intake in Bahraini school chil-dren. It was part of a larger study on nutritional status Gharib and RasheedNutrition Journal2011,10:62
http://www.nutritionj.com/content/10/1/62
Table 1 Daily Intake of Energy and Macronutrients of Bahraini students (Boys = 256 & Girls = 240) compared to the Dietary Reference Values (EAR, RNI) for
the United Kingdom according to age groups22
Boys Girls
Macronutrient 7 - 10 Years
(n = 84)
11-14 Years (n = 97)
15-18 Years (n = 75)
All ages 7 - 10 Years
(n = 70)
11-14 Years (n = 91)
15-18 Years (n = 79)
All ages
Mean (SD) Standard
(%)1
Mean (SD) Standard
(%)
Mean (SD)
Standard (%)
Mean (SD) Mean
(SD) Standard (%) Mean (SD) Standard (%) Mean (SD) Standard (%) Mean (SD)
Energy (kcal) 1851.1d (347.9) 1,970 (94.0) 2101.3d (548.1) 2,220 (94.7) 2367d (548.7) 2,755 (85.9) 2097.1b (530.3) 1793.4 (472.7) 1,740 (103.1) 1822.3 (447.7) 1,845 (98.8) 1739.9 (386.3) 2,110 (82.5) 1786.8b (435.8)
Protein (gm) 70.7d(18.2) 28.3 (249.8)
83.4d(24.2) 42.1 (198.1)
91.4d (23.2)
55.2 (165.6)
81.6b(23.5) 68.8 (19.2) 28.3 (243.1)
68 (19.9) 41.2 (165.0)
67 (20.6) 45.0 (148.9)
67.9b(19.9)
%Kcals Proteins 15.3 (2.5) 15.9 (2.4) 15.5 (2.4) 15.6 (2.5) 15.4 (2.2) 15 (2.8) 15.4 (3) 15.2 (2.7)
Carbohydrate (gm) 241.5d (49.4)
274d(69.4) 319.9d (79)
276.8b (73.3)
229.2 (62) 236.7 (65.3)
230.1 (54.1)
232.4b (60.7)
%Kcals Carbohydrates 52.3c(5.2) 52.5c(5.1) 54c(5.2) 52.9 (5.2) 51.2 (5) 52 (6) 53 (5.6) 52.1 (5.6)
Fat, total (gm) 68.8d(16.7) 76.6d(25) 82.2d (22.8)
75.7b(22.5) 68.7 (21.8) 68.8 (19.6) 63.3 (16.9) 67b(19.5)
%Kcals Fats 33.3d(3.8) 32.5d(4) 31.1d(3.9) 32.4 (4) 34.3c(4.1) 33.9c(4.3) 32.7c(4) 33.6 (4.2)
Cholesterol (mg) 260.3 (100.6) 300.8 (121.6) 299.8 (167) 287.2b (131.6)
265 (121.2) 243.5 (119.6)
229.3 (123.7)
245.1b (121.7)
Saturated Fat (gm) 22.1 (7.3) 23.1 (8.4) 24.4 (8.6) 23.2a(8.1) 23.1c(9.3) 22.1c(7.3) 19.5c(6.2) 21.6a(7.7)
%kcals Saturated 10.6d(2.3) 9.9d(2.1) 9.3d(2.4) 9.9 (2.3) 11.4d(2.2) 10.9d(2.3) 10.1d(2.2) 10.8 (2.3)
Monounsaturated Fat (gm)
19.9d(5.9) 21.2d(7.5) 24d(7) 21.6b(7) 19 (7.2) 18.9 (6.7) 17.7 (5.7) 18.5b(6.5)
%kcals Monosaturated
9.6 (1.9) 9 (1.9) 9.1 (1.5) 9.3 (1.8) 9.4 (1.8) 9.2 (2) 9.1 (1.9) 9.3 (1.9)
Polyunsaturated Fat (gm)
12.2 (3.5) 14 (5.6) 13.5 (4.3) 13.3b(4.7) 12.4 (4.5) 12.7 (5.4) 11.8 (4.6) 12.3b(4.9)
%kcals Ployunsaturated
5.9d(1.4) 6d(1.7) 5.2d(1.3) 5.7 (1.5) 6.3 (1.9) 6.2 (1.9) 6.1 (1.9) 6.2 (1.9)
MFA 18:1, Oleic (gm) 7.8 (4.1) 7.8 (3.8) 8.6 (4.7) 8.0a(4.2) 7.6 (4.9) 7.1 (3.7) 6.8 (3.5) 7.1a(4)
PFA 18:2, Linoleic (gm)
3.9c(2.1) 4.9c(3.1) 4.6c(2.1) 4.5 (2.6) 4.3 (2.7) 4.3 (2.4) 3.9 (2) 4.2 (2.4)
Table 1 Daily Intake of Energy and Macronutrients of Bahraini students (Boys = 256 & Girls = 240) compared to the Dietary Reference Values (EAR, RNI) for
the United Kingdom according to age groups22(Continued)
PFA 18:3, Linolenic (gm)
0.3 (0.1) 0.3 (0.2) 0.3 (0.1) 0.3 (0.1) 0.3 (0.2) 0.3 (0.1) 0.3 (0.1) 0.3 (0.2)
PFA 20:5, EPA (gm) 0 (0) 0 (0) 0 (0) 0 (0) 0 (0) 0 (0) 0 (0.1) 0 (0)
PFA 22:6, DHA (gm) 0 (0.1) 0.1 (0.1) 0 (0) 0 (0.1) 0 (0.1) 0 (0.1) 0.1 (0.1) 0.1 (0.1)
Dietary Fiber, total (gm)
12.4c(5.6) 13.6c(5.6) 14.8c(6.1) 13.5a(5.8) 12 (5.4) 12.2 (5.8) 13 (6.5) 12.4a(5.9)
Sugar, total (gm) 93.2d(31.1) 98d(34.5) 114.6d (43.5)
101.3b (37.3)
87.1 (30.7) 93.8 (40.1) 85.5 (35.6) 89.1b(36.1)
Sucrose (gm) 22.7 (11.3) 22.3 (12.3) 25.2 (15) 23.3 (12.8) 17.5 (9.2) 16.5 (9.7) 18.3 (11.8) 17.4 (10.3)
Lactose (gm) 8.3 (4.5) 6.5 (4.3) 6 (5.9) 6.9b(4.9) 9 (5.6) 6.2 (4) 5.4 (4.7) 6.7b(4.9)
P:S2 0.6 (0.2) 0.6 (0.2) 0.6 (0.2) 0.6 (0.2) 0.6 (0.2) 0.6 (0.2) 0.6 (0.2) 0.6 (0.2)
1: Standard Reference Values (UK): EAR for energy and RNI for Protein, (percentage of standard) [22]; 2: Polyunsaturated fat to Saturated fat ratio. a p < 0.05; b p < 0.01 (Mann-Whitney test) Significantly different between genders.
c p < 0.05, d p < 0.01 Significantly different across age groups.
Gharib
and
Rasheed
Nutrition
Journal
2011,
10
:62
http://ww
w.nutritionj.co
m/conten
t/10/1/62
Page
6
of
of children and hence it was possible to validate some of the findings. Though there is a possibility of under or over-reporting of food consumption in a 24-hour recall study for various reasons related to knowledge, memory and interview situation [35], reported data on energy intake when compared to Body Mass Index of the stu-dents showed a significant trend in the expected direc-tion. This finding allowed us to make some assumption on the validity of the responses.
There may have been some misreporting of data for boys≤10 years old whose mothers did not participate in the study. The study data has its drawbacks of a one-time 24-hour dietary recall that may not be representative of
the usual diet for an individual child. However, it does represent estimations of the average dietary intake of a group because the means of data collection are robust and unaffected by within-person variation [35].
The mean energy intakes of Bahraini children and adolescents were higher than the EAR standards as well as values reported from the US, some European coun-tries such as, Switzerland, Spain, Germany and the UK [36-40] and some Asian countries such as China, Greece and Bangladesh [37,41,42]. Mean energy intake of Bahraini children is comparable to data of adolescents from France [36]. High intake of energy by the Bahraini students is a cause of serious concern. Could excessive
Table 2 Distribution of Mean Energy, Macronutrient Densities, P: S Ratio, Mean sugar and Dietary fiber by levels of Total Fat dense diets in Bahraini Girls (n = 240) and Boys (n = 256)
Total Fat Dense Diets (%kcal)
Nutrient variables < 30% 30-37% ≥38% Total 1
P-value
Mean Mean Mean Mean
n = 42 n = 166 n = 32 n = 240
Girls
Energy (Kcal) 1645.605 1794.366 1932.672 1786.774 0.032a
%Kcals from Proteins. 15.068 15.15 15.788 15.221 0.589
%Kcals from Carbohydrates 58.502 51.978 44.348 52.102 0.000b
%Kcals from Fats 27.594 33.815 40.428 33.608 0.000b
%kcals from Sat 8.764 10.975 12.583 10.802 0.000b
%kcals from Monosaturated fat 7.464 9.301 11.374 9.256 0.000b
%kcals from Polyunsaturated fat 4.878 6.183 7.996 6.196 0.000b
Cholesterol (mg) 195.155 245.783 307.002 245.085 0.001b
Cholesterol, mg/1000 kcal 116.94 136.705 160.123 136.369 0.010a
Sugar, Total (gm) 99.969 89.42 73.222 89.106 0.003b
Sucrose (gm) 19.578 17.079 16.265 17.408 0.502
Dietary Fiber, total (gm) 14.558 12.246 10.284 12.389 0.009b
P:S Ratio3 0.586 0.587 0.659 0.596 0.121
Boys
Energy (Kcal) 2008.984 2127.582 2146.195 2097.07 0.426
%Kcals from Proteins. 15.417 15.632 15.87 15.592 0.722
%Kcals from Carbohydrates 58.007 51.714 44.609 52.855 0.000b
%Kcals from Fats 27.537 33.432 40.236 32.375 0.000b
%kcals from Sat 8.638 10.08 13.358 9.947 0.000b
%kcals from Monosaturated fat 7.933 9.528 11.661 9.265 0.000b
%kcals from Polyunsaturated fat 4.939 5.993 6.301 5.733 0.000b
Cholesterol (mg) 271.479 287.863 336.387 287.238 0.156
Cholesterol, mg/1000 kcal 136.601 135.939 159.025 137.921 0.194
Sugar, Total (gm) 107.408 101.689 76.853 101.29 0.004b
Sucrose (gm) 24.52 23.028 21.096 23.279 0.541
Dietary Fiber, total (gm) 15.229 12.762 14.258 13.544 0.005b
P:S Ratio2 0.615 0.622 0.498 0.611 0.039a
1 Significantly different across categories of total fat dense diets categories a p < 0.05; b p < 0.01 (Kruskal-Wallis test). 2 Polyunsaturated-Saturated Ratio.
Gharib and RasheedNutrition Journal2011,10:62 http://www.nutritionj.com/content/10/1/62
calorie consumption have contributed to the high preva-lence of overweight status found in Bahraini children of this study [43]?
The average protein intake was well in excess of the RNI at all ages. Although there are methodological dif-ferences between the present study and dietary studies from the UK [39], Sweden [44] and the USA (Bogalusa Heart Study) [45], Bahraini children were observed to consume more protein than children from these western countries.
Protein is required for growth of children. However, if it is consumed in excess of needs, it is diverted to the energy pathway, or if it is above caloric needs it is meta-bolized into fat [46]. In fact, a high protein intake early
in life could increase the risk of adiposity later in life [47].
The mean daily intake of sugars (intrinsic and extrin-sic) was high as per DRV recommendations [22] sug-gesting an increased risk of dental caries, obesity and its related health problems in Bahraini children. While sugar consumption increased with age due to increasing intake of chocolates, candies and sugared soft drinks, the intake of lactose which helps in calcium absorption, decreased with age due to reduced intake of milk (Table 2). It is a cause of concern that around 50% of the study population consumed at least 1 regular soda drink per day. Research has shown that daily consumption of a 12-oz sugared soda drink has been associated with a
Table 3 Frequency of consumption of Food Items among Bahraini Girls (n = 1241) and Boys (n = 1190)*
Food Almost daily
5-7 times/w
3-4 times/w 1-2 times/w Never
No. % No. % No. % No. %
GIRLS
Milk & Milk Products 635 51.2 366 29.5 231 18.6 9 0.7
Bread, Rice & Cereal 870 70.1 256 20.6 114 9.2 1 0.1
Fruits 443 35.7 464 37.4 308 24.8 26 2.1
Fruit Juices 328 26.4 371 29.9 455 36.7 87 7
Vegetables Leafy 404 32.6 370 29.8 366 29.5 101 8.1
Vegetables Others 146 11.8 432 34.8 543 43.8 120 9.7
Meat (Fish, Poultry, Meat) 822 66.2 303 24.4 110 8.9 6 0.5
Eggs 111 8.9 396 31.9 627 50.5 107 8.6
Legumes: lentils, beans... 35 2.8c 115 9.3 733 59.1 358 28.8
Sweets & Snacks: cakes, chips, candies,... 797 64.2d 300 24.2 134 10.8 10 0.8
Miscellaneous: tea & coffee 289 23.3 318 25.6 411 33.1 223 18
Miscellaneous: sauce & spreads 214 17.2 356 28.7 497 40 174 14
Soda Drinks: regular 600 48.3 322 25.9 254 20.5 65 5.2
Soda Drinks: diet 19 1.5d 29 2.3 116 9.3 1077 86.8
BOYS
Milk & Milk Products 659 55.4a 356 29.9 170 14.3 5 0.4
Bread, Rice & Cereal 904 76b 227 19.1 56 4.7 3 0.3
Fruits 492 41.3a 425 35.7 258 21.7 15 1.3
Fruit Juices 359 30.2 358 30.1 399 33.5 74 6.2
Vegetables Leafy 400 33.6 340 28.6 340 28.6 110 9.2
Vegetables Others 176 14.8 397 33.4 520 43.7 97 8.2
Meat (Fish, Poultry, Meat) 889 74.7b 234 19.7 65 5.5 2 0.2
Eggs 107 9a 396 33.3 621 52.2 66 5.5
Legumes: lentils, beans,... 30 2.5 139 11.7 730 61.3 291 24.5
Sweets & Snacks: cakes, chips, candies,... 565 47.5 353 29.7 262 22 10 0.8
Miscellaneous: tea & coffee 412 34.6b 267 22.4 331 27.8 180 15.1
Miscellaneous: sauce & spreads 178 15 396 33.3 443 37.2 173 14.5
Soda Drinks: regular 629 52.9b 322 27.1 197 16.6 42 3.5
Soda Drinks: diet 17 1.4 25 2.1 67 5.6 1081 90.8
Difference between genders: a p < 0.05; b: p < 0.01 (within gender); c p < 0.05, d p < 0.01 (between genders) * Non responders: 72 for girls and 59 for boys
Gharib and RasheedNutrition Journal2011,10:62 http://www.nutritionj.com/content/10/1/62
0.18-point increase in a child’s BMI and a 60% increased risk of obesity. Over-consumption is a problem when energy is ingested in liquid form; moreover, these drinks represent energy added to, without displacing other diet-ary intake [48].
Besides weight gain, increased sugar consumption in Bahraini children is likely to decrease their HDL choles-terol, increase LDL cholescholes-terol, triglycerides, blood glu-cose and insulin concentrations, factors which are related to Coronary Heart Disease mortality [49]. Further, research suggests that high sugar intake may lead to nutritional inadequacy of micronutrients espe-cially those of Vitamin A, C, B12, Folate, Calcium, Phos-phorus, Magnesium and Iron [50].
Dietary fiber is a part of carbohydrate and is necessary for normal laxation; it may also help prevent future risk of cardiovascular disease, some cancers, and adult-onset
diabetes [31,32]. A reasonable goal for dietary fiber intake during childhood and adolescence may be approximately equivalent to the age of the child +5 grams per day and a safe range is age +5 to +10 g/day [30-32].
Fiber intake by the Bahraini adolescents apparently fell short of the current recommendations and may be con-sidered inadequate for optimal health promotion and chronic disease prevention [31]. This is apparently due to low consumption of fresh fruits and vegetables as observed in the food frequency data of the children and possibly due to insufficient quantities of other sources of fiber such as whole grains, legumes, and high fiber cereals. Indeed, findings of this survey were consistent with those of a recent national nutrition survey ducted on Bahraini adults, 50% of whom were not con-suming fruits and vegetables on a daily basis [9].
GIRLS (n=1241) BOYS (n=1189)
*
Non responders: 72 for girls and 60 for boys
25.7%
28.8%
45.8%
72.0% 75.7%
79.4% 41.0%
55.2%
67.4% 71.8%
76.2% 75.7% 24.8%
33.6%
54.1%
62.8% 51.1%
65.8%
78.8%
82.5%
68.3%
56.7%
69.7%
65.4%
56.2% 26.4%
18.1% 24.7%
64.4% 27.9%
0% 10% 20% 30% 40% 50% 60% 70% 80% 90% 100%
15-18 y 11-15 y 7-10 y 15-18 y 11-15 y 7-10 y 15-18 y 11-15 y 7-10 y 15-18 y 11-15 y 7-10 y 15-18 y 11-15 y 7-10 y
Sw
eet
s &
Sn
acks
Bread, Rice &
Cereal
Milk & Milk Products
M
eat
Vegetables, Fr
uits &
Legumes
%students
Figure 1Daily consumption of food groups by Bahraini students of different age groups. Gharib and RasheedNutrition Journal2011,10:62
http://www.nutritionj.com/content/10/1/62
Regional studies have also shown that daily consump-tion of fruits and vegetables were uncommon among Omani adolescent girls and young females from the United Arab Emirates [15,51].
Nutrition messages in Bahraini school children should emphasize that foods high in starches (polysaccharides; e.g., bread, pasta, cereal, potatoes) are recommended over sugar (monosaccharide’s and disaccharides) as per dietary guidelines of the American Heart Association [49]. Moreover, foods that are sources of complex car-bohydrates (whole grains) as well as nutrient-fortified and enriched starches, such as cereals should be the major sources of calories in the diet.
A higher mean total fat intake by boys than girls might be explained by their more frequent consumption of fat-rich foods such as meats, eggs, and whole milk and dairy products. The mean total fat intake was lower among Bahraini adolescent girls compared to their younger counterparts. Two possible reasons could explain these finding. Older girls are more likely to be preoccupied with body image [52], and hence are less keen to accurately report foods higher in fat and sugar, which they perceive to be “unhealthy"; alternatively some of them were under a controlled diet at the time of the survey to reduce their body weight and hence were cautious in fat consumption. These possibilities need further exploration since they were not investi-gated in the present study.
The mean E% of macronutrients among Bahraini boys and girls were close to the current dietary recommenda-tions set by COMA [22] and comparable with values of E% in the diet of French adolescents (48.1% carbohy-drate, 36.9% fat, 15% protein) [36] and the UK children and adolescents (51.5% carbohydrate, 35.4% fat, 13.1% protein for boys; and 51% carbohydrate, 35.9% fat, 13.1% protein, for girls) [39]. However, a higher total fat E% was found in American children and adolescents (38%) [53] and Greek adolescents (40.25%) [37] compared to their Bahraini counterparts of this study.
The E% from fat and fatty acids for young people is generally compared with the DRVs for adults since the significance of any long-term effects are less well estab-lished for children than for adults and hence reference values have not been formulated separately for children. However it is suggested that the dietary patterns of fat intake recommended for adults should be appropriate for children from the age of five years [22].
It was encouraging to note that the average E% of total fat and saturated fat among Bahraini students were equal to or lower than the recommended Dietary Values [22]. Whether this suggests a lower risk of ischemic heart disease in the long term has yet to be established. Bahraini mean values of E% for saturated fat were also lower than the US mean values of 12% (NHANES III)
for children aged 2 to 19 years [38] and UK mean values of 14% for children aged 7 to 18 years [39].
The mean E% of monounsaturated fat among Bahraini students was lower than the DRV value of 13% and that of the US children (12.5%) and UK children (11.8%) [22,38,39]. Bahraini E% values of polyunsaturated fat were close to the DRV of 6.5%, as well as to the mean values of boys and girls in the UK (6%) [22,39]. However, the P:S ratio of 0.6 for both girls and boys, was lower than the usually recommended value of 1, suggesting higher consumption of saturated fat compared to polyun-saturated sources [23]. This situation is not encouraging considering saturated fatty acids in the diet raise plasma total and LDL cholesterol while polyunsaturated fatty acids (particularly linoleate in corn, safflower, sunflower, and soybean oils) and monounsaturated fatty acids (prin-cipally oleate in olive oils), lower these blood lipids [33].
The mean daily intake of dietary cholesterol among Bahraini boys was higher as per DRV standards of≤300 mg/day [22] and is a cause of concern. A higher dietary cholesterol intake in boys than girls is possibly due to their higher consumption of cholesterol-rich foods such as meats, eggs, milk and other dairy products.
While the mean E% of total fat and saturated fat as well as mean cholesterol intake in the diet of Bahraini children was at an acceptable level as per DRV recom-mendations, a substantial proportion of the students exceeded prudent dietary recommendations. There are data to suggest, that children with high levels of serum cholesterol may have an increased risk of having high serum cholesterol as adults [54]. Dietary fat intake in children is of interest because of concerns about the atherosclerotic process which begins in childhood and increases cardiovascular disease risk factors including hypertension [53,54]. Current dietary findings suggest that one-third to half of the Bahraini children may be at increased risk of cardiovascular disease and mortality in their adult life.
Though the mean E% of total and saturated fat in the study population was acceptable, increasing values of saturated fat and cholesterol and decreasing values of fiber intake in high fat dense diets
(> 30%) indicates the higher potential of an athero-genic effect and cardiovascular disease risk in those con-suming such diets. P: S values of all 3 fat-dense diets were lower than the usually recommended value of 1 [23], suggesting that diets with apparently ‘unfavorable’ lipid profiles are not a phenomenon exclusive to the high fat group. These data suggest that, in addition to the quantitative aspects, the qualitative nature of dietary fat intake of school-aged children and adolescents deserves attention.
Sugar intake was significantly more in those on low than high fat dense diets. It is not unreasonable to Gharib and RasheedNutrition Journal2011,10:62
http://www.nutritionj.com/content/10/1/62
speculate that students on low fat dense diets might compensate by increasing the use of sucrose to maintain energy requirements. In the Bogalusa Heart Study, chil-dren whose E% from total fat was less than 30% con-sumed more carbohydrates (mainly sucrose) than children who ate high-fat food [55]. To avoid increased calorie consumption and hence weight gain, high sugar and nutrient-poor foods should not be a substitution for reduced fat intake as per AHA guidelines [49].
The food frequency data showed that a small selection of foods made up the total diet for most children. While milk is a good source of protein and calcium necessary during the growth phase of children, there is concern about its infrequent consumption especially during ado-lescence. Infrequent intake of fruits and vegetables reflects lack of protective and healthy foods in the diet of Bahraini children. Moreover, high intake of regular soda drinks, sweets and snacks will contribute to surplus empty calories with an increased risk for obesity and its consequences.
Conclusions
Low intake of fruits and vegetables and dietary fiber, high sugar intake and high Energy % of saturated fat and dietary cholesterol by a substantial proportion of Bahraini children is likely to increase their risk of obe-sity and cardiovascular diseases in later life. Therefore, nutrition education programs in schools should empha-size the importance of healthy balanced diets and the risks of consuming empty calories. Parents too should be provided information on nutrients essential for the growth and health maintenance of children as well as dietary prevention of diseases. Moreover, food industries have a potential to change the eating habits of our chil-dren. They should provide healthier food choices and introduce attractive ways to market these new choices to appeal to the children. It is well known that the foun-dation for good health in adulthood is laid during child-hood and adolescent years.
Additional material
Additional file 1: Number of Schools Selected from each Region (no. of students). This file contains data on number of schools selected from each Region and number of students selected from each school.
Acknowledgements
The authors wish to thank the Ministry of Education, Kingdom of Bahrain for granting us permission to conduct the study, the schools for their kind support and cooperation during the study, the children and their parents for their patience and all fieldworkers (Amina Alhalwachi, Fatima Aljeeb, Fadhel Alholaibi and Khetam Ali) who helped in data collection. Special thanks to Mr. J. Mohsen (Senior Statistician and the Fellow of Royal Statistical Society -UK) for performing the statistical analysis. We are also grateful to the
Nutrition Section, Ministry of Health, Kingdom of Bahrain for their support in terms of financial and other resources for the conduct of the study.
Author details 1
Nutrition Section/Ministry of Health, Manama, Bahrain.2Department of Family and Community Medicine, College of Medicine, Dammam University, Dammam, Saudi Arabia.
Authors’contributions
NG designed the study, drafted the manuscript and supervised the data collection and statistical analysis. PR conceived the study, participated in its design and coordination, helped to interpret the data and draft the final form of the manuscript. Both authors read and approved the final manuscript.
Competing interests
The authors declare that they have no competing interests.
Received: 30 October 2010 Accepted: 5 June 2011 Published: 5 June 2011
References
1. Berenson GS, Srinivasan SR, Nicklas TA:Atherosclerosis: A Nutritional Disease of Childhood.Am J Cardiol1998,82:22T-29T.
2. McGill HC:Childhood Nutrition and Cardiovascular Disease.Nutr Rev 1997,55:S2-S11.
3. Dietz Wh:Critical Periods in Childhood for the Development of Obesity. Am J Clin Nutr1994,59:955-959.
4. Must A:Morbidity and Mortality Associated with Elevated Body Weight in Children and Adolescents.Am J Clin Nutr1996,63(suppl.3):S445-S447. 5. Welten DC, Kemper HC, Post HC, Staveren V, Twisk JW:Longitudinal
Development and Tracking of Calcium and Dairy Intake from Teenager to Adult.Eur J Clin Nutr1997,51:612-618.
6. Power C, Lake JK, Cole TJ:Measurement and long-term health risks of Child and Adolescent fatness.Int J Ones Relat Metab Disord1997, 21:507-526.
7. Clavien H, Theintz G, Rizzoli R, Bonjour JP:Does Puberty Alter Dietary Habits in Adolescents Living in a Western Society?J Adolesc Health1996, 19:68-75.
8. Obesity, Preventing and Managing the Global Epidemic. Report of a WHO Consultation on ObesityGeneva; 1997, 3-5.
9. Abdul Wahab AWM, Moosa K, Gharib N, Al-Sairafi M, Al-Raees G, Al-Amer M: National Nutrition Survey for Adult Bahrainis Aged 19 Years and Above Ministry of Health, Kingdom of Bahrain; 2002.
10. Musaiger AO:The State of Nutrition in Bahrain.Nutrition and Health2000, 14:63-74.
11. Musaiger AO:The State of Food and Nutrition in BahrainArabian Gulf University; 1993.
12. Sendi AM Al, Shetty P, Musaiger AO:Prevalence of Overweight and Obesity Among Bahraini Adolescents: A Comparison Between Three Different Sets of Criteria.European Journal of Clinical Nutrition2003, 57:471-474.
13. Musaiger AO, Matter AM, Alekri SA, Mahdi ARE:Obesity among Secondary School Students in Bahrain.Nutrition and Health1993,9:25-32.
14. Flegal KM, Troiano RP:Changes in the Distribution of Body Mass Index of Adult and Children in the US Population.International Journal of Obesity 2000,24:807-118.
15. Musaiger AO:Change in Dietary Habits, Lifestyle and Trend in Disease in the GCC Countries.Bahrain Medical Bulletin1998,20(3):87-90.
16. Musaiger AO, Gregory WB:Dietary Habits of School Children in Bahrain.J Royal Society Health1992,112:109-112.
17. Sendi Aneesa M Al, Shetty P, Musaiger AO:Anthropometric and Body Composition Indicators of Bahraini Adolescents.Annals of Human Biology 2003,30(4):367-379.
18. Musaiger AO, Gregory WB:Profile of Body Composition of School Children (6-18 Y) in Bahrain.International Journal of Obesity2000, 24:1093-1096.
19. Musaiger AO, Gregory WB, Haas JD:Growth Patterns of School-Children in Bahrain.Annals of Human Biology1989,16(2):155-167.
20. Musaiger AO, Al-Mannai M:Anthropometry of Adolescent Girls in Bahrain, Including Body Fat Distribution.Ann Hum Bio2000,27:507-515. Gharib and RasheedNutrition Journal2011,10:62
http://www.nutritionj.com/content/10/1/62
21. Report of a WHO Expert Committee:Physical Status: The Use and Interpretation of AnthropometryGeneva; 1995.
22. Dietary Reference Values for Food Energy, Nutrients for the United Kingdom. Department of Health:Report of the Panel on Dietary Values of the Committee on Medical Aspects of Food Policy.8 edition. HMSO, London; 1996.
23. Lee RD, Nieman DC:Nutritional assessment.3 edition. WCB/McGraw-Hill. USA; 2003.
24. Frank GC, Nicklas TA, Webber LS, Major C, Miller JF, Berenson GS:A Food Frequency Questionnaire for Adolescents: Defining Eating Patterns.J Am Diet Assoc1992,92(3):313-8.
25. First Data Bank, Inc:“Nutritionist Five”Nutrition Analysis Software. Version 2.1.1 Data 9.1999.The Heart CorporationSan Bruno, California/US; 1998.
26. SPSS version 11.5. SPSS Inc., Chicago, IL; 2002.
27. Altman DG:Practical Statistics for Medical ResearchChapman & Hall/CRC London.
28. Gharib N, Rasheed P:Anthropometry and body composition of school Children in Bahrain.Ann Saudi Med2009,29(4):258-269.
29. De Onis M, Onyango AW, Borghi E, Siyam A, Nishida C, Siekmann J: Development of a WHO growth reference for school-aged children and adolescents.Bulletin of the World Health Organization2003,85:660-7. 30. Williams CL, Bollella M, Wynder El:Recommendation for Dietary Fiber in
Childhood.Pediatrics1995,96(5pt2):985-8.
31. American Academy of Pediatrics:Committee on Nutrition. Pediatric Nutrition Handbook.Elk Grove Village, IL;, 4 1998.
32. Williams CL:Importance of Dietary Fiber in Childhood.J Am Diet Assoc 1995,95:1140-1146.
33. Department of Health:Report of the Cardiovascular Review Group Committee on Medical Aspects of Food Policy.46 Nutritional Aspects of Cardiovascular DiseaseLondon: The Stationery Office; 1999.
34. Food and Agriculture Organization of the United Nations, The World Health Organization:Fats and Oils in Human NutritionReport of a Joint Expert Consultation. Rome; 1994.
35. Thompson FE, Subai AF, Coulston AM, Rock CL, Monsen ER:Dietary Assessment Methodology in: Nutrition in the Prevention and Treatment of DiseaseSan Diego, Calif: Academic Press; 2001.
36. Rolland-Cachera MF, Bellisle F, Deheeger M:Nutritional Status and Food Intake in Adolescents Living in Western Europe.European Journal of Clinical Nutrition2000,54(1):S41-S46.
37. Cruz JAA:Dietary Habits and Nutritional Status in Adolescents Over Europe - Southern Europe.European Journal of Clinical Nutrition2000, 54(1):S29-S35.
38. Troiano RP, Briefel RR, Carroll MD, Bialistosky K:Energy and Fat Intakes of Children and Adolescents in the United States: Data from the Nutrition Examination Surveys.Am J Clin Nutr2000,72(suppl):1343S-53S. 39. National Diet and Nutritional Survey: young people aged 4 to 18 years
London: The Stationery Office. UK; 2000.
40. Koletzko B, Dokoupil K, Reitmayr S, Weimert-Harendza B, Keller E:Dietary Fat Intakes in Infants and Primary School Children in Germany.Am J Clin Nutr2000,72(suppl):1392S-8S.
41. Chunming C:Fat Intake and Nutritional Status of Children in China.Am J Clin Nutr2000,72(suppl):1368S-72S.
42. Ahmed F, Zareen M, Khan MR, Banu CP, Haq MN, Jackson AA:Dietary Pattern, Nutrient Intake and Growth of Adolescent School Girl in Urban Bangladesh.Public Health Nutr1998,1(2):83-92.
43. Gharib NM, Rasheed P:Obesity Status among Children and Adolescents in Bahrain: Prevalence and Associated Factors.JBMS2008,20:114-123. 44. Samuelson G:Dietary Habits and Nutritional Status in Adolescents over
Europe. An Overview of Current Studies in the Nordic Countries. European journal of Clinical Nutrition2000,54(1):S21-S28.
45. Nicklas TA, Elkasabany A, Srinivasan SR, Berenson G:Trends in Nutrient Intake of 10-Year-Old Children over Two Decades (1973-1994).Am J Epidemiol2001,153:969-77.
46. Nieman DC, Butterworth DE, Nieman CN:NutritionWm C. Brown Publishers, US; 1992, Revised First Edition.
47. Rolland-Cachera MF, Deheeger M, Akrout M, Bellisle F:Influence of macronutrients on adiposity development: a follow up study of nutrition and growth from 10 months to 8 years of age.Int J Obes1995,19:573-8. 48. Committee on School Health:Soft Drink in School.Pediatrics2004,
113(1):152-155.
49. Krauss RM, Eckel RH, Howard B, Appel LJ, Daniels SR, Deckelbaum RJ, Etherton PK,et al:AHA Dietary Guidelines. Revision 2000: A statement for Healthcare professionals from the Nutrition Committee of the American Heart Association.Stroke2000,31:2751-2766.
50. Bowman S:Diets of Individuals Based on Energy Intake from Added Sugars. US Department of Agriculture, Center for Nutrition Policy and Promotion.Fam Econ Nutr Rev1999,12:31-8.
51. Musaiger AO:Nutritional Status and Dietary habits of Adolescent in Oman.Ecology of Food and Nutrition1994,31:227-237.
52. Crawley H, Summerbell C:Feeding Frequency and BMI Among Teenagers Aged 16-17 Years.International Journal of Obesity and Related Metabolic Disorders1967,21:159-161.
53. Nicklas TA:Dietary Studies of Children and Young Adults (1973-1988): The Bogalusa Heart Study.Am J Med Sci1995,310(suppl.1):S101-S108. 54. Lauer RM, Lee J, Clarke WR:Factors Affecting the Relationship between
Childhood and Adult Cholesterol Levels: The Muscatine Study.Pediatrics 1988,82(3):309-318.
55. Nicklas TA, Webber LS, Koschak M, Berenson GS:Nutrient Adequacy of Low Fat Intakes for Children: The Bogalusa Heart Study.American Academy of Pediatrics1992,89(2):221-228, Daily consumption of food groups by Bahraini students of different age groups.
doi:10.1186/1475-2891-10-62
Cite this article as:Gharib and Rasheed:Energy and macronutrient intake and dietary pattern among school children in Bahrain: a cross-sectional study.Nutrition Journal201110:62.
Submit your next manuscript to BioMed Central and take full advantage of:
• Convenient online submission
• Thorough peer review
• No space constraints or color figure charges
• Immediate publication on acceptance
• Inclusion in PubMed, CAS, Scopus and Google Scholar
• Research which is freely available for redistribution
Submit your manuscript at www.biomedcentral.com/submit Gharib and RasheedNutrition Journal2011,10:62
http://www.nutritionj.com/content/10/1/62