R E S E A R C H
Open Access
Consumer-centric resource accounting
in the cloud
Ahmed Mihoob, Carlos Molina-Jimenez and Santosh Shrivastava
*Abstract
“Pay only for what you use” principle underpins the charging policies of widely used cloud services that are on offer. Ideally for these services, consumers should be in a position to verify the charges billed to them. However, unlike traditional utility services such as gas and electricity, no consumer–trusted metering services are available for cloud services, so consumers have no choice but to rely on the usage data made available by the providers. In light of this, the paper proposes the notion of Consumer–centric Resource Accounting Models for cloud resources. An accounting model isstrongly consumer–centricif all the data that the model requires for calculating billing charges can be
collected independently by the consumer (or a trusted third party, TTP); in effect, this means that a consumer (or a TTP) should be in a position to run their own measurement service. With this view in mind, the accounting models of some widely used cloud services are examined and possible sources of difficulties in data collection are identified, including causes that could lead to discrepancies between the metering data collected by the consumer and the provider. The paper goes on to suggest how cloud service providers can improve their accounting models to make them consumer-centric.
Keywords: Cloud resource consumption, Storage resource, Computational resource, Resource metering, Accounting models, Amazon web services
1 Introduction
Cloud computing services made available to consumers range from providing basic computational resources such as storage and compute power (infrastructure as a ser-vice, IaaS) to sophisticated enterprise application services (software as a service, SaaS). A common business model is to charge consumers on a pay-per-use basis where they periodically pay for the resources they have con-sumed. Needless to say that for each pay-per-use ser-vice, consumers should be provided with an unambiguous resource accounting model that precisely describes all the constituent chargeable resources of the service and how billing charges are calculated from the resource usage (resource consumption) data collected on behalf of the consumer over a given period. If the consumers have access to such resource usage data then they can use it in many interesting ways, such as, making their applica-tions billing aware, IT budget planning, creating brokering services that automate the selection of services in line
*Correspondence: santosh.shrivastava@ncl.ac.uk
School of Computing Science, Newcastle University, Newcastle upon Tyne, NE1 7RU, UK
with user’s needs and so forth. Indeed, it is in the inter-est of the service providers to make resource consumption data available to consumers; incidentally all the providers that we know of do make such data accessible to their consumers in a timely fashion.
An issue that is raised is the accountability of the resource usage data: who performs the measurement to collect the resource usage data - the provider, the con-sumer, a trusted third party (TTP), or some combination of thema? Provider-side accountability is the norm for the traditional utility services such as for water, gas and electricity, where providers make use of metering devices (trusted by consumers) that are deployed in the con-sumers’ premises. Currently, provider-side accountability is also the basis for cloud service providers, although, as yet there are no equivalent facilities of consumer-trusted metering; rather, consumers have no choice but to take whatever usage data made available by the provider as trustworthy.
In light of the above discussion, we propose the notion of a Consumer–centric Resource Accounting Model for a cloud resource. We say that an accounting model is
weakly consumer–centric if all the data that the model requires for calculating billing charges can be queried programmatically from the provider. Further, we say that an accounting model is strongly consumer–centric if all the data that the model requires for calculating billing charges can be collected independently by the consumer (or a TTP); in effect, this means that a consumer (or a TTP) should be in a position to run their own measure-ment service. We contend that it is in the interest of the providers to make the accounting models of their services at least weakly consumer–centric. Strongly consumer– centric models should prove even more attractive to consumers as they enable consumers to incorporate inde-pendent consistency or reasonableness checks as well as raise alarms when apparent discrepancies are suspected in consumption figures; furthermore, innovative charging schemes can be constructed by consumers that are them-selves offering third party services. Strongly consumer– centric accounting models have the desirable property of openness and transparency, since service users are in a position to verify the charges billed to them.
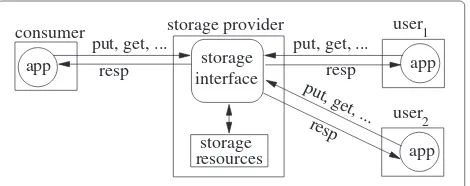
As a motivating example, consider a consumer who rents a storage service to run an application shown in Figure 1. The storage is consumed by the consumer’s application and by applications hosted by other users (user1, user2, etc.) that access the storage service at the consumer’s expense. An example of this case is a con-sumer using a storage service to provide photo or video sharing services to other users. The ideal scenario is that the consumer is able to instrument the application to col-lect all the necessary storage consumption data and use the accounting model of the provider to accurately esti-mate the charges, and use that information to provide competitively priced service to users.
Since cloud service providers do publish their charg-ing information, it is worth investigatcharg-ing whether their information matches the proposed notion of account-ing models that are consumer–centric. With this view in mind, we studied the accounting models of various ser-vice providers for two basic resource types, storage and processor. We concluded that the models of the lead-ing provider, Amazon Web Services, can be taken as the representative class. We therefore concentrate most on
app interface
storage
resourcesstorage
app user1
user2 put, get, ...
put, get, ...
resp resp
app resp
consumer
put, get, ...
storage provider
Figure 1Provider, consumer and users of storage services.
their models. We performed a detailed evaluation of the accounting models of two cloud infrastructure services from Amazon (Simple Storage Service, S3, and Elastic Compute Cloud, EC2) and Cloud Storage Network (CSN) from Nirvanix, a service that is similar to S3.
We began by independently collecting (by examination of requests and responses) our own resource usage (con-sumption) data for S3 and compared it with the provider’s data. Our investigations indicate that even though it is conceptually a very simple service, the accounting model description of S3 nevertheless suffers from ambiguities and incompleteness with the result that the resource usage data that the model requires for calculating billing charges as collected by a consumer can turn out to be different from that collected by Amazon. A similar evaluation of Nirvanix CSN and EC2 also revealed a few shortcomings. Service providers can learn from our evaluation study to re-examine their accounting models. In particular, we recommend that a cloud provider should go through the exercise of constructing a third party resource accounting service, and based on that exercise, perform any amend-ments to the model so as to remove potential sources of ambiguities and incompleteness in the description of the model, so that as far as possible, consumers are able to col-lect with ease their own usage data that matches provider side data with sufficient precisionb.
The paper reports the results of our work and makes the following contributions:
– it presents a systematic way of describing resource accounting models so that they can be understood and reasoned about by consumers;
– it precisely identifies the causes that could lead to discrepancies between the resource usage data collected by the provider and the consumer, and whether the discrepancies can be resolved; and – it presents ideas on how an accounting model should be constructed so as to make it
consumer–centric.
task of computing billing charges. Concluding remarks are presented in Section 10.
2 Related work
An architecture for accounting and billing in cloud ser-vices composed out of two or more federated infrastruc-tures (for example, a storage and computation providers) is discussed in [1]. The architecture assumes the exis-tence of well defined accounting models that are used for accounting resources consumed by end users and for accounting resources that the cloud provider consumes from the composing infrastructures. This issue is related to the scenario that we present in Figure 1. In [2], the author discuss the requirements for accounting and billing services, but within the context of federated network of telecommunication providers. A detailed discussion of an accounting system aimed at telecommunication ser-vices is also provided in [3]. These papers overlook the need to provide consumers with means of performing consumer–side accounting.
In [4], the authors observe that “the black–box and dynamic nature of the cloud infrastructure” makes it dif-ficult for consumers to “reason about the expenses that their applications incur”. The authors make a case for a framework for verifiable resource accounting such that a consumer can get assurances about two questions: (i) did I consume what I was charged? and (ii) should I have consumed what I was charged? Verifiability is clearly closely related to the notion of consumer–centric resource accounting developed in this paper.
Our concept of consumer–centric resource accounting is similar in spirit to that of monitorability of service level agreements, discussed in [5]; in this work, the authors point out that service level agreements signed between clients and providers need to be precise and include only events that are visible to the client and other interested parties.
In [6], the authors develop a model in which the consumer and provider independently measure resource consumption, compare their outcomes and agree on a mutually trusted outcome. The paper discusses the tech-nical issues that this matter involves, including consumer side collection of metering data, potential divergences between the two independently calculated bills, dispute resolution and non–repudiable sharing of resource usage records. Naturally, a starting point for such a system will be consumer–centric accounting models of cloud resources.
Good understanding of cloud resource accounting mod-els is essential to consumers interested in planning for minimisation of expenditures on cloud resources. The questions raised are what workload to outsource, to which provider, what resources to rent, when, and so on. Exam-ples of research results in this direction are reported in
[7-9]. In [8], the authors discuss how an accounting service deployed within an organisation can be used to control expenditures on public cloud resources; their accounting service relies on data downloaded from the cloud provider instead of calculating it locally. In [10], the authors take Amazon cloud as an example of cloud provider and esti-mate the performance and monetary–cost to compute a data–intensive (terabytes) workflow that requires hours of CPU time. The study is analytical (rather than experi-mental) and based on the authors’ accounting model. For instance, to produce actual CPU–hours, they ignore the granularity of Amazon instance hours and assume CPU seconds of computation. This work stresses the relevance of accounting models. The suitability of Amazon S3, EC2 and SQS services as a platform for data intensive scientific applications is studied in [11]; the study focuses on perfor-mance (e.g. number of operations per second), availability and cost. It suggests that costs can be reduced by building cost–aware applications that exploit data usage patterns; for example, by favouring data derivation from raw data against storage of processed data. These arguments sup-port the practical and commercial relevance of our study of resource accounting models.
3 Background
For resource accounting it is necessary to determine the amount of resources consumed by a given consumer (also called client and consumer) during a given time interval, for example, a billing period.Accounting systemsare com-posed of three basic services: metering, accounting and billing.
We show a typical consumer side accounting system in Figure 2. We assume that resources are exposed as ser-vices through one or more service interfaces. As shown in the figure, the metering service intercepts the message traffic between the consumer application and the cloud services and extracts relevant data required for calculat-ing resource usage (for example, the message size which would be required for calculating bandwidth usage). The metering service stores the collected data for use by the accounting service. The accounting service retrieves the metering data, computes resource consumption from the data using its accounting model and generates accounting data that is needed by the billing service to calculate the billing data.
accounting data accounting model accounting service
billing service
billing data metering
data
application service interface
accounting system service
metering provider
.
consumer
Figure 2Consumer side resource accounting system.
their own resource accounting. The difficulty here for the consumer is to extract the accounting model from their online documentation as most providers that we know of, unnecessarily blur their accounting models with metering and billing parameters. A structured description using a generic model, as suggested next, would be a great help. In the following discussion we gloss over the fine details of pricing, but concentrate on metering and accounting aspects.
4 Abstract resource
We suggest a systematic way of describing resource accounting models so that they can be understood and reasoned about by consumers. The key idea is very simple: first define a set of “elementary” chargeable resources and then describe the overall resource consumption of a given resource/service in terms of an aggregation of the con-sumption of these elementary resources. With this view in mind, we present the resource consumption model of an abstract resource.
With some small resource specific variations, the accounting models of resources such as S3, CSN and EC2 and other infrastructure level resources can be repre-sented as special cases of the abstract resource accounting model, and therefore can be understood and reasoned about in a uniform manner.
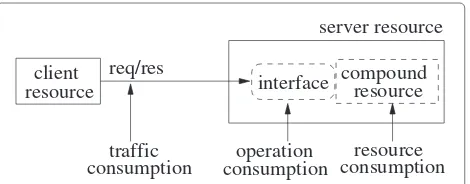
We consider a typical configuration where a server (cloud) resource and aclient resourceinteract with each other by means of requests/responses (req/res) sent through a communication channel (see Figure 3).
resourceclient interface compoundresource
consumptionoperation consumptionresource consumptiontraffic
server resource
req/res
Figure 3Accounting model of an abstract resource.
As shown in the figure, theclient resourceuses the inter-face of theserver resourceto place its requests and collect the corresponding responses. This deployment incurs three types of consumption charges:traffic consumption, operation consumptionandresource consumption. Traffic consumption represents the amount of traffic (for exam-ple in MBytes) generated by the requests and responses on the communication channel. Operation consumption captures the activities generated by the client resource on the interface such as the the number of requests (also called operations) and the number of responses produced. Finally, resource consumption represents the actual con-sumption of the resource measured in units that depend on the specific nature of the resource, for example, in units of volume (for example, MBytes), time or a combination of them (for example, MBytesHours).
As the figure suggests, the accounting model for a given resource is an aggregation of three elementary models: a model for traffic consumption, a model for operation consumption and a model for resource consumption. In particular, the accounting model of a particular resource will be strongly consumer–centric if all the three of its mentary models are strongly consumer-centric. These ele-mentary models operate independently from each other, thus they can be specified and examined separately.
Using the abstract resource model as the basis, we now evaluate the accounting models of the three resources indicated earlier to see to what an extent they match our notion of consumer-centric accounting. In particular, for each resource we determine if there are causes that could lead to discrepancies between the metering data collected by the provider and the consumer.
5 S3 accounting model
S3 customer is charged for: a) resource: storage space consumed by the objects that they store in S3; b) traf-fic: network traffic generated by the operations that the customer executes against the S3 interface; and c) oper-ations:number of operations that the customer executes against the S3 interface.
5.1 Storage resource
The key parameter in calculation of the storage bill is number of byte hours accounted to the customer. Byte Hours(ByteHrs) is the the number of bytes that a cus-tomer stores in their account for a given number of hours.
Amazon explains thatthe GB of storage billed in a month is the average storage used throughout the month. This includes all object data and metadata stored in buckets that you created under your account. We measure your usage in TimedStorage–ByteHrs, which are added up at the end of the month to generate your monthly charges. Next, an example that illustrates how to calculate your bill if you keep 2,684,354,560 bytes (or 2.5 GB) of data in your bucket for the entire month of Marchis provided. In accor-dance with Amazon the total number of bytes consumed for each day of March is 2684354560; thus the total num-ber of ByteHrs is calculated as 2684354560×31×24= 1997159792640, which is equivalent to 2.5 GBMonths. At a price of 15 cents per Giga Bytes per month, the total charge amounts to 2.5×15=37.5 cents.
They further state thatat least twice a day, we check to see how much storage is used by all your Amazon S3 buck-ets. The result is multiplied by the amount of time passed since the last checkpoint. Records of storage consump-tion in ByteHrs can be retrieved from the Usage Reports associated with each account.
From the definition of ByteHrs it follows that to cal-culate their bill, a customer needs to understand 1) how their byte consumption is measured, that is, how the data and metadata that is uploaded is mapped into consumed bytes in S3; and 2) how Amazon determines the number of hours that a given piece of data was stored in S3 —this issue is directly related to the notion of a checkpoint.
Amazon explains that each object in S3 has, in addition to its data, system metadata and user metadata; further-more it explains that thesystem metadatais generated and used by S3, whereasuser metadata is defined and used only by the user and limited to 2 KB of size [12]. Unfor-tunately, Amazon does not explain how to calculate the actual storage space taken by data and metadata. To clar-ify this issue, we uploaded a number of objects of different names, data and user metadata into an equal number of empty buckets. Figure 4 shows the parameters and results from one of our upload operations where an object named Object.zipis uploaded into a bucket namedMYBUCKET, which was originally empty.
into MYBUCKET
PUT Object.zip
8 char 10 char
295198 bytes 1537 bytes
of data of metadata
Storage consump. from Usage Reports: 295216 bytes
Figure 4Impact of data and metadata on storage consumption.
Notice that in this example, the object and bucket names are, respectively, ten and eight character long, which is equivalent to ten and eight bytes, respectively.
The object data and metadata shown in the figure corre-spond to information we extracted locally from the PUT request. In contrast, the storage consumption of 295216 bytes corresponds to what we found in the Usage Reports. The actual Usage Reports show storage consumption per day in ByteHrs; the value shown is the result of its con-version into bytes. Notice that this storage consumption equals the sum of the object data, the length of the object name and the length of the bucket name: 8+10+295198= 295216.
Three conclusions can be drawn from these experi-ments: first, the mapping between bytes uploaded (as measured by intercepting upload requests) and bytes stored in S3 correspond one to one; second, the stor-age space occupied by system metadata is the sum of the lengths (in Bytes) of object and bucket names and incur storage consumption; third, user metadata does not impact storage consumption. In summary, for a given uploaded object, the consumer can accurately measure the total number of bytes that will be used for calculating ByteHrs.
Next, we need to measure the ‘Hrs’ of ‘ByteHrs’. As stated earlier, Amazon states that at least twice a day they check the amount of storage consumed by a customer. However, Amazon does not stipulate exactly when the checkpoints take place.
To clarify the situation, we conducted a number of experiments that consisted in uploading to and delet-ing files from S3 and studydelet-ing the Usage Reports of our account to detect when the impact of the PUT and DELETE operations were accounted by Amazon. Our findings are summarised in Figure 5. It seems that,
SC for the 30th 2x24=48GBHrs
2 0 1
0 0
3
CP : 5GB
5x24=120GBHrs
CP : 3GB
3x24=72GBHrs
31 01
31 Mar
SC for the 1st SC for the 31st
30
CP : 2GB
currently, Amazon does not actually check customers’ storage consumption twice a day as they specify in their Calculating Your Bill document, but only once. From our observations, it emerged that the time of the checkpoint is decided randomly by Amazon within the 00:00:00Z and 23:59:59Z time intervalc.
In the figure, CP stands for checkpoint, thusCP30: 2GB indicate thatCP30 was conducted on the 30th day of the month at the time specified by the arrow and reported that at that time the customer had 2 GB stored in S3. SC stands for Storage Consumption and is explained below.
As shown in the figure, Amazon uses the results pro-duced by a checkpoint of a given day, to account the customer for the 24 hrs of that day, regardless of the oper-ations that the customer might perform during the time left between the checkpoint and the 23:59:59Z hours of the day. For example, the storage consumption for the 30th will be taken as 2×24 = 48 GBHrs; where 2 represents the 2GB that the customer uploaded on the 30th and 24 represents the 24 hrs of the day.
5.2 Traffic
Amazon explains that DataTransfer–In is the network data transferred from the customer to S3. They state that Every time a request is received to put an object, the amount of network traffic involved in transmitting the object data, metadata, or keys is recorded here. DataTransfer–Out is the network data transferred from S3 to the customer. They state thatEvery time a request is received to get an object, the amount of network traffic involved in transmitting the object data, meta-data, or keys is recorded here. By here they mean that in the Usage Reports associated to each account, the amount of DataTransfer–In and DataTransfer–Out gen-erated by a customer, is represented, respectively, by the DataTransfer–In–Bytes and DataTransfer–Out–Bytes parameters.
Amazon use an example to show that ifYou upload one 500 MB file each day during the month of MarchandYou download one 500 MB file each day during the month of Marchyour bill for March (imagine 2011) will be calcu-lated as follows. The DataTransfer–In would be 500MB× (1/1024)×31=15.14GB. At a price of 10 cents per Giga Bytes, the total charge would be 15.14×10=151.4 cents. In a second example they show that ifYou download one 500 MB file each day during the month of Marchthe total amount of DataTransfer–Out would be 15.14 GB which charged at 15 cents per GB would amount to 227 cents.
It is however not clear from the available information how the size of of the message is calculated. To clarify the point, we uploaded a number of files and compared information extracted from the PUT operations against bandwidth consumption as counted in the Usage Report.
into MYBUCKET 8 char 10 char
of data of metadata2024 bytes 0 bytes
PUT Object.zip
Bandwidth consump. (DataTransferIn) from usage reports: 0 bytes
into MYBUCKET PUT Object.zip
8 char 10 char
1537 bytes of data of metadata 295198 bytes
Bandwidth consump. (DataTransferIn) from usage reports: 295198 bytes
Figure 6Bandwidth consumption.
Two examples of the experiments that we conducted are shown in Figure 6: we used PUT operations to upload an object into a bucket. The data and metadata shown in the figure represent the data and metadata extracted locally from the PUT requests.
As shown by the Bandwidth consump. parameters extracted from the Usage Reports, only the object data consumes DataTransfer–In bandwidth; neither the meta-data or the object or bucket names seem to count as overhead. This observation refers to RESTful requests. In contrast, for SOAP messages, the total size of the message is always used for calculating bandwidth consumption.
5.3 Operations
It is straightforward for a consumer to count the type and number of operations performed on S3. To illustrate their charging schema Amazon provide an example in the Ama-zon Simple Storage Service FAQs where You transfer 1000 files into Amazon S3 and transfer 2000 files out of Amazon S3 each day during the month of March, and delete 5000 files on March 31st. In this scenario, the total number of PUT request is calculated as 1000×31=31000, whereas the total number of GET requests is calculated as 2000× 31=62000. The total number of DELETE requests is sim-ply 5000 though this is irrelevant as DELETE requests are free. At the price of one cent per 1000 PUT requests and one cent per 10000 GET requests, the total charge for the operations is calculated as 31000×(1/1000)+62000× (1/10000)= 37.2 cents.
when they try to upload a file into a non-existent bucket; whereas anInternalError code indicates that S3 is expe-riencing internal problems. Our understanding is that the consumer is charged for an operation, whether the operation succeeded or not.
To offer high availability, Amazon replicates data across multiple servers within its data centres. Replicas are kept weakly consistent and as a result, some perfectly legal operations could sometime fail or return inaccurate results (see [12], Data Consistency Model section). For example, the customer might receive a ObjectDoesNotEx-istas a response to a legal GET request or an incomplete list of objects after executing a LIST operation. Some of these problems can be corrected by re-trying the opera-tion. From Amazon accounting model, it is not clear who bears the cost of the failed operations and their retries.
We executed a number of operations including both valid and invalid ones (for example, creation of buckets with invalid names and with names that already existed). Next we examined the Usage Reports and as we expected, we found that Amazon counted both successful and failed operations. Figure 7 shows an example of the operations that we executed and the bandwidth and operation con-sumptions that it caused in accordance with the Usage Reports.
Thus, the failed operation to create that bucket con-sumed 574 bytes for DataTransfer–In and and 514 bytes for DataTransfer–Out. These figures, correspond to the size of the SOAP request and response, respectively. As shown in the figure, we also found out that the failed oper-ation incurred operoper-ation consumption and counted by the RequestTier2 parameter in the Usage Reports.
5.4 Potential causes of discrepancies
5.4.1 Storage
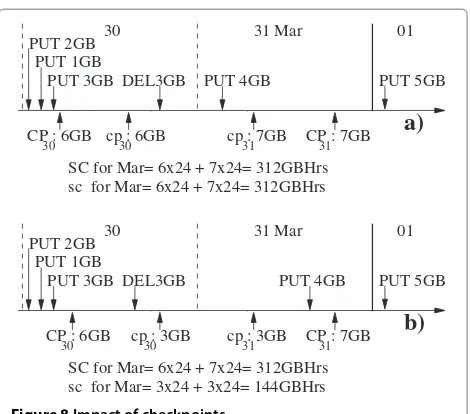
Since, for the calculation of ByteHrs, the time of the checkpoint is decided randomly by Amazon within the 00:00:00Z and 23:59:59Z time interval, the time used at the consumer’s side need not match that at the provider’s side: a potential cause for discrepancy. This is illustrated with the help of Figure 8.
Bandwidth consump. (DataTransferIn) from usage reports: 574 bytes
Bandwidth consump. (DataTransferOut) from usage reports: 514 bytes
Operation consump. (RequestTier2) from usage reports: 1
CREATE MYBUCKET
Response: Error:BucketAlreadyExists
// MYBUCKET already exists
Figure 7Bandwidth and operation consumption of failed operations.
30
CP : 6GB
30
cp : 3GB
31
cp : 3GB CP : 7GB
31
SC for Mar= 6x24 + 7x24= 312GBHrs sc for Mar= 3x24 + 3x24= 144GBHrs
30
CP : 6GB
30
cp : 6GB
31
cp : 7GB CP : 7GB
31
SC for Mar= 6x24 + 7x24= 312GBHrs sc for Mar= 6x24 + 7x24= 312GBHrs
30 PUT 2GB
PUT 1GB
DEL3GB
01
b)
PUT 5GBa)
30PUT 2GB PUT 1GB
DEL3GB
01 31 Mar
PUT 5GB
31 Mar PUT 3GB
PUT 3GB PUT 4GB
PUT 4GB
Figure 8Impact of checkpoints.
The figure shows the execution time of four PUT and one DEL operations executed by an S3 consumer during the last two days of March. The first day of April is also shown for completeness. For simplicity, the figure assumes that the earliest PUT operation is the very first executed by the consumer after opening his S3 account. The figure also shows the specific points in time when checkpoints are conducted independently by two par-ties, namely, Amazon and a consumer. Thus, CP and cp represent, respectively, Amazon’s and the consumer’s checkpoints; the Giga Bytes shown next to CP and cp indicate the storage consumption detected by the check-point. For example, on the 30th, Amazon conducted its checkpoint about five in the morning and detected that, at that time, the customer had 6 GB stored (CP30 : 6GB). On the same day, the consumer conducted his checkpoint just after midday and detected that, at that time, he had 6 GB stored (cp30 : 6GB). SC and sc represent, respec-tively, the storage consumption for the month of March, calculated by Amazon and consumer, based on their checkpoints.
The figure demonstrates that the storage consumption calculated by Amazon and consumer might differ sig-nificantly depending on the number and nature of the operations conducted within the time interval determined by the two parties’ checkpoints, for example, withinCP31 andcp31.
PUT operation is missed bycp31and counted byCP31; the result of this is that Amazon and the consumer, calculate SC and sc, respectively, as 312 GB and 144 GB.
Ideally, Amazon’s checkpoint times should be made known to consumers to prevent any such errors. Providing this information for upcoming checkpoints is perhaps not a sensible option for a storage provider, as the information could be ‘misused’ by a consumer by placing deletes and puts around the checkpoints in a manner that artificially reduces the consumption figures. An alternative would be to make the times of past checkpoints available (e.g., by releasing them the next day).
5.4.2 Impact of network and operation latencies
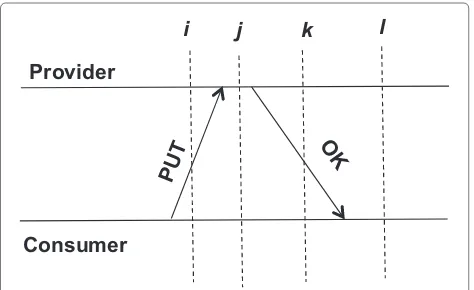
In the discussion concerning calculation of ByteHrs (illus-trated using Figure 8), we have implicitly assumed that the execution of a PUT (respectively a DELETE) operation is an atomic event whose time of occurrence is either less or greater than the checkpoint time (i.e., the operation hap-pens either before or after the checkpoint). This allowed us to say that if the checkpoint time used at the provider is known to the consumer, then the consumer can match the ByteHrs figures of the provider. However, this assump-tion is over simplifying the distributed nature of the PUT (respectively a DELETE) operation.
In Figure 9 we explicitly show network and operation execution latencies for a given operation, say PUT; also, i, j, k and lare provider side checkpoint times used for illustration. Assume that at the provider side, only the completed operations are taken into account for the cal-culation of ByteHrs; so a checkpoint taken at timeiorj will not include the PUT operation (PUT has not yet com-pleted), whereas a checkpoint taken at time k orl will. What happens at the consumer side will depend on which event (sending of the request or reception of the response) is taken to represent the occurrence of PUT. If the times-tamp of the request message (PUT) is regarded as the time of occurrence of PUT, then the consumer side ByteHrs
Provider
Consumer
i j k l
Figure 9Network and operation latencies.
calculation for a checkpoint at timeiorjwill include the PUT operation, a discrepancy since the provider did not! On the other hand, if the timestamp of the response mes-sage is regarded as the time of occurrence of PUT, then a checkpoint at timek will not include the PUT opera-tion (whereas the provider has), again a discrepancy. In short, for the operations that occur sufficiently close to the checkpoint time, there is no guarantee that they get ordered identically at both the sides with respect to the checkpoint time. Assuming checkpoint times are known to a consumer, then any discrepancies can be resolved at the consumer side by examining the storage consumption figures of the provider and working out the place of the operations that happened around the checkpoint times.
5.4.3 Operations
Earlier we stated that it is straightforward for a consumer to count the type and number of operations performed on S3. There is a potential for discrepancy caused by network latency: operations that are invoked ‘sufficiently close’ to the end of an accounting period (say i) and counted by the consumer for that period, might get counted as per-formed in the next period (say j) by the provider if due to the latency, these invocation messages arrive in period j. This will lead to the accumulated charges for the two period not being the same. This is actually not an issue, as the Amazon uses the timestamp of the invocation message for resolution, so the consumer can match the provider’s figure.
One likely source of difficulty about the charges for operations is determining the liable party for failed oper-ations. Currently, this decision is taken unilaterally by Amazon. In this regard, we anticipate two potential sources of conflicts: DNS and propagation delays. As explained by Amazon, some requests might fail and pro-duce a Temporary Redirect (HTTP code 307 error) due to temporary routing errors which are caused by the use of alternative DNS names and request redirection tech-niques [13]. Amazon’s advice is to design applications that can handle redirect errors, for example, by resending a request after receiving a 307 code (see [12], Request Rout-ing section). Strictly speakRout-ing these errors are not caused by the customer as the 307 code suggests. It is not clear to us who bears the cost of the re–tried operations.
5.5 Summary
6 CSN accounting model
A Nirvanix CSN space is organised as a collection of fold-ers that support nesting. A folder can contain zero or more subfolders and files of up to 250 GB [14]. Both folders and files are identified by names chosen by the customer. Nirvanix CSN uses accounting model concepts that are almost the same as those used by Amazon S3; however, compared to Amazon, information about pricing and the charging schema used to calculate the customers bill is sparsely documented. Of the three elementary chargeable resources identified for the abstract resource, a CSN cus-tomer is charged only for the consumption of storage and traffic (there is no charge for operation consumption). We performed resource consumption measurements for storage and network traffic using the same kinds of exper-iments as described for S3.
Like Amazon, for storage, Nirvanix uses GB/Month to calculate the bill, so a customer needs to understand: 1) how their GB consumption is measured, that is, how the data and metadata that is uploaded is mapped into consumed bytes; and 2) how Nirvanix determines the number of hours that a given piece of data was stored in CSN (how frequently and when checkpoints are taken). Concerning 1), our experiments show that the map-ping between bytes uploaded by PUT requests and bytes stored in CSN is one-to-one; secondly, user and system metadata do not impact storage consumption. Concern-ing 2), although Nirvanix does not provide any details about when their checkpoints take place, our experiments revealed that Nirvanix computes storage consumption at the start point of each 24 hour consumption interval (at 00:00:00 GMT). Concerning traffic charges, experiments revealed that only the size of the data counted and neither the metadata nor the file or folder names contributed to charges.
Thus, given the above information, a consumer can accurately measure their storage consumption figures and traffic charges; hence we consider the model strongly consumer–centric.
7 EC2 accounting model
EC2 is a computation service offered by Amazon as an IaaS [15]. The service offers raw virtual CPUs to con-sumers. A consumer is granted administrative privileges over his virtual CPU, that he can exercise by means of sending remote commands to the Amazon Cloud from his desktop computer. For example, he is expected to config-ure, launch, stop, re–launch, terminate, backup, etc. his virtual CPU. In return, the consumer is free to choose the operating system (eg Windows or Linux) and appli-cations to run. In EC2 terminology, a running virtual CPU is called a Virtual Machine Instance (VMI)or just an instance whereas the frozen bundle of software on disk that contains the libraries, applications and initial
configuration settings that are used to launch an instance is called anAmazon Machine Image (AMI).
Currently, Amazon offers six types of instances that differ from each other in four initial configuration parameters that cannot be changed at running time: amount of EC2 compute units that it delivers, size of their memory and local storage (also called ephemeral and instance storage) and the type of platform (32 or 64 bits). An EC2 compute unit is an Amazon unit and is defined as the equivalent CPU capacity of a 1.0– 1.2 GHz 2007 Opteron or 2007 Xeon processor. Thus Amazon offer small, large, extra large and other types of instances. For example, the default instance type is the Small Instance and is a 32 bit platform that deliv-ers 1 EC2 compute unit and provided with 1.7 GB of memory and 160 GB of local storage. These types of instances are offered to consumers under several billing models:on–demand instances,reserved instancesandspot instances. In our discussion we will focus on on–demand instances.
Under the on–demand billing model, Amazon defines the unit of consumption of an instance as the instance hour (instanceHr). Currently, the cost of an instance hour of a small instance running Linux or Windows, is, respectively, 8.5 and 12 cents. On top of charges for instance hours, instance consumers normally incur addi-tional charges for data tranfer that the instances gener-ates (Data Transfer–InandData Transfer–Out) and for addtional infrastructure that the instance might need such as disk storage, IP addresses, monitoring facilities and oth-ers. As these additional charges are accounted and billed separately, we will leave them out of our discussion and focus only on instance hours charges.
The figures above imply that if a consumer accrues 10 instanceHrs of a small instance consumption, running Linux, during a month, he will incur a charge of 85 cents at the end of the month.
In principle, the pricing tables publicly available from Amazon web pages should allow a consumer to indepen-dently conduct his own accounting of EC2 consumption. In the absence of a well defined accounting model this is not a trivial exercise.
instance runs continuously for 90 minutes, it will incur 2 instanceHrs.
The problem with this definition is that it does not clarify when an instance is considered to be launched and terminated. Additional information about this issue is provided in the Billing section of FAQs [17], Paying for What You Useof theAmazon Elastic Compute (Ama-zon EC2)document [15] and in theHow You’re Charged section of the User Guide [18]. For example, in [15] it is stated thatEach instance will store its actual launch time. Thereafter, each instance will charge for its hours of exe-cution at the beginning of each hour relative to the time it launched.
From information obtained from the documents cited above it is clear that Amazon starts and stops counting instance hours as the instance is driven by the consumer, through different states. Also, it is clear that Amazon instance hours are accrued from the execution of one or more individual sessions executed by the consumer during the billing period. Within this context, asessionstarts and terminates when the consumer launches and terminates, respectively, an instance.
Session–based accounting models for resources that involve several events and states that incur differ-ent consumptions, are convenidiffer-ently described by Finite State Machines (FSMs). We will use this approach to describe the EC2 accounting model. Others, for example RightScale (a broker of cloud services), have also taken this approach [19].
7.1 States of an instance session
The states that an instance can reach during a session depend on the type of memory used by the AMI to store its boot (also called root) device. Currently, Amazon sup-ports S3–backed and EBS–backed instances. EBS stands for Elastic Block Store and is a persistent storage that can be attached to an instance. The consumer chooses between S3 or EBS–backed instances at AMI creation time.
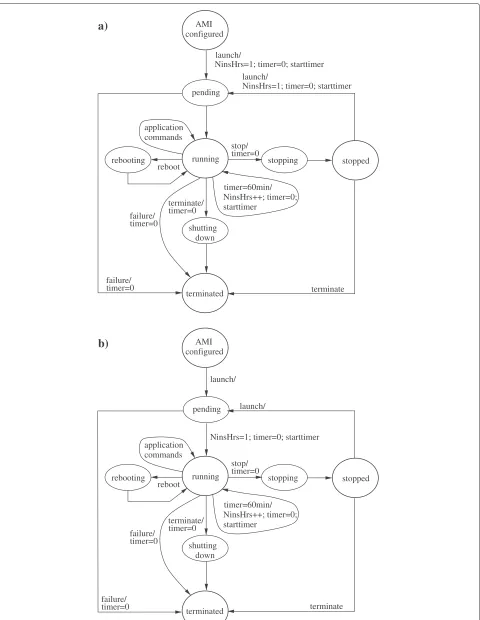
Unfortunately, the states that an instance can reach dur-ing a session are not well documented by Amazon. Yet after a careful examination of Amazon’s online documen-tation we managed to build the FSM shown in Figure 10a). The FSM of an Amazon instance includes two types of states:permanent and transient states. Permanent states (represented by large circles, e.g.running) can be remotely manipulated by commands issued by the consumer; once the FSM reaches a permanent state, it remains there until the consumers issues a command to force the FSM to progress to another state. Transient states (represented by small circles, e.g.stopping) are states that the FSM visits temporarily as it progresses from a permanent state into another. The consumer has no control over the time spent
in a transient state; this is why there are no labels on the outgoing arrows of these states.
We have labeled the transitions of the FSM with event/actionnotations. Theeventis the cause of the tran-sition whereas the action represents the set (possibly empty) of operations that Amazon executes when the event occurs, to count the numbers of instance hours consumed by the instance.
There are two types of events: consumer’s and inter-nal to the FSM events. The consumer’s events are the commands (launch, application commands, reboot, stop andterminate) that the consumers issues to operate his instance; likewise, internal events are events that occur independently from the consumer’s commands, namely, timer=60minandfailure. A discussion on all the perma-nent and some of the transient states depicted in the FSM follows.
• AMI configured:is the initial state. It is reached when the consumer successfully configures his AMI so that it is ready to be launched.
• Running:is the state where the instance can perform useful computation for the consumer, for example, it can respond to application commands issued by the consumer.
• Terminated:is the final state and represents the end of the life cycle of the instance. Once this state is reached the instance is destroyed. To perform additional computation after entering this state the consumer needs to configure another AMI. The terminated state is reached when the subscribed issues theterminate command, the instance fails when it is in running state or the instance fails to reach running state.
• Pending:is related to the instantiation of the instance within the Amazon cloud.Pending leads to running state when the instance is successfully instantiated or toterminated state when Amazon fails to instantiate the instance.
• Shuttingdown:is reached when the consumer issues
theterminate command.
• Stopped:this state is supported only EBS–backed instances (S3–backed instances cannot be stopped) and is reached when the user issuesstop command, say for example, to perform backup duties.
• Rebooting:is reached when the consumer issues the reboot command.
7.2 States and instance hours
rebooting
application commands
stopped timer=0
stop/
timer=0
failure/ timer=0 terminate/
stopping
timer=60min/ NinsHrs++; timer=0; starttimer
running
shutting down pending
timer=0 failure/
reboot
NinsHrs=1; timer=0; starttimer launch/
NinsHrs=1; timer=0; starttimer launch/
a)
terminated configured
AMI
terminate
configured AMI
rebooting
application commands
stopped
timer=0 failure/
timer=0 stop/
timer=0
failure/ timer=0 terminate/
stopping
timer=60min/ NinsHrs++; timer=0; starttimer
running
shutting down pending
reboot
NinsHrs=1; timer=0; starttimer launch/
launch/
b)
terminated terminate
timeris Amazon’s timer to count a 60 minutes interval; it can be set to zero (timer=0) and started (starttimer).
In the FSM, the charging operations are executed as sug-gested by the Amazon’s on line documentation. For exam-ple, inPaying for What You UseSection of [15], Amazon states that the beginning of an instance hour is relative to the launch time. Consequently, the FSM setsNinstHrs=1 when the consumer executes a launch command from the AMI configured state. At the same time,timer is set to zero and started.NinstHrs=1 indicates that once a con-sumer executes a launch command, he will incur at least one instance hour. If the consumer leaves his instance in the running state for 60 minutes (timer = 60min) the FSM incrementsNinstHrsby one, sets the timer to zero and starts it again. Fromrunningstate the timer is set to zero when the consumer decides to terminate his instance (terminatecommand) or when the instance fails (failure event). Although Amazon’s documentation does not dis-cuss it, we believe that the possibility of an instance not reaching therunning state cannot be ignored, therefore we have included a transition frompendingtoterminated state; the FSM sets the timer to zero when this abnormal event occurs.
As explained in Basics of Amazon EBS–Backed AMIs and InstancesandHow You’re Chargedof [18], a running EBS–backed instance can be stopped by the consumer by means of thestopcommand and drive it to thestopped state. As indicated bytimer=0 operation executed when the subscribed issues a stop command, an instance in stoppedstate incurs no instance hours. However, though it is not shown in the figure as this is a different issue, Amazon charges for EBS storage and other additional ser-vices related to the stopped instance. The consumer can drive an instance from thestoppedto theterminatedstate. Alternatively he can re–launch his instance. In fact, the consumer can launch, stop and launch his instance as many times as he needs to. However, as indicated by the NinstHrs+ +,timer= 0 andstarttimeroperations over the arrow, every transition fromstoppedtopendingstate accrues an instance hour of consumption, irrespectively of the time elapsed between each pair of consecutivelaunch commands.
7.3 Experiments with Amazon instances
To verify that the accounting model described by the FSM of Figure 10a) matches Amazon’s description, we (as consumers) conducted a series of practical experiments. In particular, our aim was to verify how the number of instance hours is counted by Amazon.
The experiments involved 1) configuration of different AMIs; 2) launch of instances; 3) execution of remote com-mands to drive the instances through the different states shown in the FSM. For example, we configured AMIs, launched and run them for periods of different lengths
and terminated them. Likewise, we launched instances and terminated them as soon as they reached therunning state.
To calculate the number of instance hours consumed by the instances, we recorded the time of execution of the remote commandslaunch,stop,terminateandreboot, and the time of reaching both transient and permanent states. For comparison, we collected data (start and end time of an instance hour, and number of instance hours consumed) from Amazon EC2 usage report.
A comparison of data collected from our experiments against Amazon’s data from their usage report reveals that currently, the beginning of an instance hour is not the execution time of the consumer’s launch command, as documented by Amazon, but the time when the instance reaches therunning state. These findings imply that the current accounting model currently in use is the one described by the FSM of Figure 10b). As shown in the figure, the NinstHrs is incremented when the instance reaches therunningstate.
7.4 Potential causes of discrepancies
The mismatch between Amazon’s documented account-ing model and the one currently in use (Figure 10a and b, respectively) might result in discrepancies between the consumer’s and Amazon’s calculations of instance hours. For example, imagine that it takes five minutes to reach the running state. Now imagine that the consumer launches an instance, leaves it running for 57 minutes and then terminates it. Assuming consumer side is using the FSM of Figure 10a), the consumer’sNinstHrswill be equal to two: NinstHrs = 1 at launch time and thenNinstHrsis incremented when timer = 60min. In contrast, to the consumer’s satisfaction, Amazon’s usage records will show only one instance hour of consumption. One can argue that this discrepancy is not of the consumer’s concern since, economically, it always favours him.
More challenging and closer to the consumer’s concern are discrepancies caused by failures. Amazon’s documen-tation does not stipulate how instances that fail accrue instance hours. For example, examine Figure 10a) and imagine that an instance suddenly crashes after spending 2 hrs and 15 min in running state. It is not clear to us whether Amazon will charge for the last 15 min of the execution as a whole instance hour. As a second example, imagine that after being launched either fromAMI config-uredorstoppedstates, an instance progresses topending state and from there, due to a failure, toterminated. It is not clear to us if Amazon will charge for the last instance hour counted byNinstHrs.
the events (launch, stopand terminate) that impact the NinstHrscounter are generated by consumer. The only exception if thetimer=60minevent, but that can be vis-ible to the consumer if he synchronises his clock to UTC time.
The accounting model that Amazon actually uses (Figure 10b) is not impacted by failures of instances to reach running state because in this model, NinsHrs is incremented when the instance reaches running state. However, this model is harder for the consumer to imple-ment since the event that causes the instance to progress frompendingtorunningstate is not under the consumer’s control.
7.5 Summary
In summary, the accounting model of EC2 is weakly consumer–centric: the traffic consumption and opera-tion consumpopera-tion models are strongly consumer–centric (operation consumption model is precisely specified – there is no charge!), but the resource consumption model is weakly consumer–centric because, as we explained with respect to Figure 10b, the event that causes a virtual machine instance to progress from pending to running state is not visible to the consumer.
8 Developing consumer–centric models
Strongly consumer–centric accounting models have the desirable property of openness and transparency, since service users are in a position to verify the charges billed to them. Our investigations revealed the causes that could lead to discrepancies between the metering data collected by the consumer not matching that of the provider. Essen-tially these causes can be classed into three categories discussed below.
1. Incompleteness and ambiguities: It is of course necessary that consumers are provided with an unambiguous resource accounting model that precisely describes all the constituent chargeable resources of a service and how billing charges are calculated from the resource usage (resource consumption) data collected on behalf of the
consumer over a given period. We pointed out several cases where an accounting model specification was ambiguous or not complete. For example, for S3, regarding bandwidth consumption, it is not clear from the available information what constitutes the size of of a message. It is only through experiments we worked out that for RESTful operations, only the size of the object is taken into account and system and user metadata is not part of the message size, whereas for SOAP operations, the total size of the message is taken into account. Failure handling is another area where there is lack of information
and/or clarity: for example, concerning EC2, it is not clear how instances that fail accrue instance hours. 2. Unobservable events: If an accounting model uses one
or more events that impact resource consumption, but these events are not observable to (or their occurrence cannot be deduced accurately by) the consumer, then the data collected at the consumer side could differ from that of the provider. Calculation of storage consumption in S3 (ByteHrs) is a good example: here, the checkpoint event is not observable. 3. Differences in the measurement process: Difference
can arise if the two sides use different techniques for data collection. Calculation of BytHrs again serves as a good example. We expect that for a checkpoint, the provider will directly measure the storage space actually occupied, whereas, for a given checkpoint time , the consumer will mimic the process by adding (for PUT) and subtracting (for DELETE) to calculate the space, and as we discussed with respect to Figure 9, discrepancies are possible.
Issues raised above can be directly addressed by the providers wishing to build consumer–centric models. They should use the abstract resource model as a basis for constructing the accounting model of a service as it will introduce much needed structure into the specifica-tion intended to describes all the constituent chargeable resources. For services that go through several state tran-sitions (like EC2), providers should explicitly give FSM based descriptions. Further, they should ensure, as much as possible, that their models do not rely on unobserv-able (to consumer) events for billing charge calculations. Finally, the provider should go through the exercise of constructing a third party measurement service to see whether the necessary metering data can be collected with ease and that it matches the provider side data with sufficient precision. Any discrepancies that get intro-duced unintentionally (e.g., due to non identical check-point times) can be resolved by consumers by careful examination of corresponding resource usage data from providers. Those that cannot be resolved would indicate errors on the side of consumers and/or providers leading to disputes.
9 Estimating and verifying billing charges
Such a tool can be used by consumers for obtaining cost– effective resource configurations before actually deploy-ing them in the cloud. The tool can be integrated with consumer side resource accounting system of the type depicted in Figure 2 for verifying billing charges during run time. Further enhancements are possible by incorpo-rating dynamic adjustment of resource capacity through-out the life cycle of the cloud based application to stay within the bounds of some pre–determined cost. We sug-gest these as directions for future work, and use the hypothetical deployment shown in Figure 11 to highlight some of the technical issues involved.
The deployment of Figure 11 involves the client’s appli-cation that is making use of three types of Amazon basic resources: S3 storage, EC2 VMIs and Elastic Block Storage (EBS) volumes.
A few words on EBSs: these are persistent block stor-age volumes frequently used for building file systems and databases. They support two interfaces: a Web ser-vice interface and a block–based input/output interface. The Web service interface can be used by the client to issue (for example, from his desktop application) admin-istration operations, such as create volume, delete vol-ume, attach volvol-ume, detach volume, etc. The block–based input/output interface can be used by EC2 VMIs and becomes available upon attaching the EBS to the VMI. A consumer of EBS is charged for operation consumption (measured as the number of input/output operations that the EC2 VMI places against the EBS) and resource con-sumption (GB-months, where the duration is determined as the time that elapses between the creation and deletion of the EBS).
EBS1
VMI1
VMI2 EBS2
VMI3 S3
region US East
application client’s
av−zoneA
av−zoneB region US West Amazon cloud
Figure 11Resource deployment.
For calculation of billing charges, some pertinent infor-mation on the physical structure of the provider’s cloud and charging policies are required. Taking Amazon as a case, their cloud is divided intoregionswhich are phys-ical locations geographphys-ically dispersed (e.g. US–East in Northern Virginia, US–West in Northern California, EU in Ireland). The EC2 cloud is divided inzoneswhich are failure–independent data centres located within Amazon regions and linked by low latency networks.
Concerning pricing, in general, Amazon charges for traffic in and out (Data Transfer–In and Data transfer– Out respectively) of the Amazon cloud and for traffic in and out of the EC2 cloud. However, Amazon does not charge for traffic between a VMI and another resource (say S3) located within the same region. Neither do they charge for traffic between two VMIs located within the same availability zone. However, Amazon charges for inter–region traffic between a VMI and another resource (for example, S3) located within a different region. In these situations, the sender of the data will be charged for Data Transfer–Out whereas the receiver will be charged for Data Transfer–In.
The deployment shown in Figure 11 involves two Ama-zon regions (US East and US West) and two availability zones (av–zoneA and av–zoneB) located within the US West region. The arrowed lines represent bi–directional communication channels. Omitted from the figure are the communication channels used by the client to issue administrative commands to the VMIs (launch, stop, reboot, etc.) and the EBS (create volume, attach volume, etc.).
We open this discussion with a study of the charges that apply to EBS1 and EBS2. Imagine for the sake of argument that they are volumes of 50 GB and 100 GB, respectively. Of concern to us here is the operation con-sumption and time concon-sumption of the EBSs. EBS1 will be charged for the number of input/output operations that theVMI1places against theEBS1interface and also for the period of time of usage of the allocated 50 GB. Being currently detached, the charges forEBS2are simpler to calculate, consisting only of the time consumption for 100 GB.
consumed by the interaction against VMI2 since VMI1 andVMI2share availability zone A. Resource consump-tion ofVMI1will be counted as the number of hours that this instance is run.
In the similar vain, the charges forVMI2will take into account traffic consumption and resource consumption. The traffic consumed will be determined by the amount of Data Transfer–Out and Data Transfer–In sent and received, respectively, along two channels: the channel that leads to the client’s application and the one that leads to VMI3. There are no charges for traffic consumed on the channel that leads toVMI1because the two instances are within the same availability zone. Again, resource con-sumption will be counted as the number of instance hours ofVMI2. The charges forVMI3can be calculated similarly toVMI2.
We can visualise that S3 will incur charges for traf-fic consumed on the channel that links it to VMI1 and on the channel that links it to the client’s application. In addition, S3 charges will account for operation con-sumption counted as the aggregation of the number of operations placed against S3 by the client’s applica-tion and VMI1. In addition, the charges will take into consideration resource consumption (storage space con-sumed) measured in storage–time units. This will be counted as the aggregated impact of the activities (put, get, delete, etc.) performed by the client’s applications and VMI1.
We anticipate that the cost–estimation tool will need a formal description language for expressing both the deployment description of the consumer’s application and the provider’s pricing policies. Deployment description will need to include information such as the constituent resources and their connectivities, geographical location of the resources, amount of input and output data, num-ber of users to support and so forth. Pricing policy description will need to take into account the particular-ities of the provider, such as for Amazon, there are no charges for VMI to VMI traffic within a single availability zone. Development of such as language is suggested as a topic for further research.
10 Concluding remarks
‘Pay only for what you use’ principle underpins the charg-ing models of widely used cloud services that are on offer. Unlike traditional utility services such as gas and electric-ity, no consumer–trusted metering services are available for cloud services, so consumers have no choice but to rely on the usage data made available by the providers. This sit-uation motivated us to propose the notion of a consumer centric resource accounting model. An accounting model is said to be weakly consumer-centric if all the data that the model requires for calculating billing charges can be
queried programmatically from the provider. An account-ing model is said to be strongly consumer-centric if all the data that the model requires for calculating billing charges can be collected independently by the consumer (or a TTP); in effect, this means that a consumer (or a TTP) should be in a position to run their own measure-ment service. We evaluated infrastructure level resource accounting models of prominent cloud service providers and found that the accounting model of SDN is strongly consumer–centric and those of S3 and EC2 are weakly consumer–centric.
Our investigations indicate that because accounting model descriptions of service providers lack clarity and completeness, collecting metering data is fraught with difficulties even for infrastructure level services that are conceptually quite simple. We suggested a systematic way of describing resource accounting models so that they can be understood and reasoned about by consumers. We presented ideas on how accounting models should be constructed so as to make them strongly consumer– centric. Direction for further research for the develop-ment of cost-effective cloud based applications were also suggested.
Service providers can learn from our evaluation study to re-examine their accounting models. In particular, we recommend that a cloud provider should go through the exercise of constructing a third party measurement ser-vice, and based on that exercise, perform any amendments to the model, remove potential sources of ambiguities in the description of the model, so that as far as pos-sible, consumers are able to collect with ease their own usage data that matches provider side data with sufficient precision.
Endnotes
a A note on terminology: ‘accountability’ refers to con-cepts such as responsibility, answerability, trustworthi-ness; not to be confused with ‘resource accounting’ that refers to the process concerned with calculating financial charges.
bThis paper combines and extends the material presented in two conference papers [21,22].
cS3 servers are synchronised to the Universal Time Coor-dinated (UTC) which is also known as the Zulu Time (Z time) and in practice equivalent to the Greenwich Mean Time (GMT).
Competing interests
The authors declare that they have no competing interests.
Authors’ contributions
Acknowledgements
The first author was funded by a grant from the Libyan Government; the second author was funded by EPSRC grant KTS-EP/H500332/1.
Received: 6 February 2013 Accepted: 6 February 2013 Published: 11 March 2013
References
1. Elmroth E, Marquez FG, Henriksson D, Ferrera DP (2009) Accounting and billing for federated cloud infrastructures. In: The Eighth Int’l Conf. on Grid and Cooperative Computing, Aug 27–28, Lanzhou, Gansu, China, pp 268–275
2. Bhushan B, Tschichholz M, Leray E, Donnelly W (2001) Federated accounting: service charging and billing in a business-to-business environment. In: Proc 2001 IEEE/IFIP Int’l Symposium on Integrated Network Management VII, pp 107–121. IEEE, Piscataway, NJ, USA 3. de Leastar E, McGibney J (2000) Flexible multi-service
telecommunications accounting system. In: Proc. Int’l Network Conf. (INC’00). University of Plymouth, School Of Computing, Communications And Electronics, Plymouth, UK
4. Sekar V, Maniatis P (2011) Verifiable resource accounting for cloud computing services. In: Proc. 3rd ACM workshop on Cloud computing security workshop (CCSW’11), pp 21–26. Association for Computing Machinery, Inc., New York, NY
5. Skene J, Raimondi F, Emmerich W (2010) Service-level agreements for electronic services. IEEE Trans Software Eng 36(2): 288–304 6. Molina-Jimenez C, Cook N, Shrivastava S (2008) On the feasibility of
bilaterally agreed accounting of resource consumption. In: 1st Int’l workshop on enabling service business ecosystems (ESBE08), Sydney, Australia. pp 170–283
7. Wang H, Jing Q, Chen R, He B, Qian Z, Zhou L (2010) Distributed systems meet economics: Pricing in the cloud. In: Proc. 2nd USENIX workshop on hot topics in cloud computing (HotCloud’10). USENIX Association, Berkeley, CA 94710
8. den Bossche RV, Vanmechelen K, Broeckhove J (2010) Cost-optimal scheduling in hybrid iaas clouds for deadline constrained workloads. In: Proc IEEE 3rd Int’l Conf. on cloud computing(Cloud’10), pp 228–235. IEEE Computer Society, Los Alamitos, CA
9. Suleiman B, Sakr S, Jeffery R, Liu A (2011) On understanding the economics and elasticity challenges of deploying business applications on public cloud infrastructure. J Internet Serv Appl 3(2): pp 173–193. doi:10.1007/s13174-011-0050-y
10. Deelman E, Singh G, Livny M, Berriman B, Good J (2008) The cost of doing science on the cloud: The montage example. In: Proc. Int’l Conf. on High Performance Computing, Networking, Storage and Analysis (SC’08). IEEE, Piscataway, NJ, USA
11. Palankar M, Iamnitchi A, Ripeanu M, Garfinkel S (2008) Amazon s3 for science grids: a viable solution? In: Intl Workshop on Data–Aware Distributed Computing (DADC’08), Jun 24, Boston, USA, pp 55–64 12. Amazon (2006) Amazon simple storage service. developer guide, API
version 2006–03–01. [Online]. Available: aws.amazon.com/ documentation/s3/
13. Murty J (2008) Programming Amazon Web Services. O’Reilly. ISBN-10: 0596515812, O’Reilly Media, Sebastopol, CA 95472
14. Nirvanix (2012) Nirvanix cloud storage network. [Online]. Available www. nirvanix.com
15. Amazon (2011) Amazon elastic compute cloud (amazon ec2). [Online] Available: aws.amazon.com/ec2/
16. Amazon ec2 pricing (2011). [Online]. Available aws.amazon.com/ec2/ pricing
17. Amazon ec2 faqs (2011). [Online]. Available aws.amazon.com/ec2/faqs 18. Amazon elastic compute cloud user guide (api version 2011–02–28)
(2011). [Online]. Available docs.amazonwebservices.com/AWSEC2/latest/ UserGuide/
19. RightScale (2011) Rightscale server management. [Online]. Available support.rightscale.com/12-Guides/Lifecycle Management 20. Amazon (2012) How aws pricing works. [Online]. Available http://
calculator.s3.amazonaws.com/calc5.html
21. Mihoob A, Molina-Jimenez C, Shrivastava S (2010) A case for consumer–centric resource accounting models. In: Proc. IEEE 3rd Int’l
Conf. on Cloud Computing (Cloud’10), IEEE Computer Society, California, pp 506–512
22. Mihoob A, Molina-Jimenez C, Shrivastava S (2011) Consumer side resource accounting in the cloud. In: Proc. 11th IFIP WG 6.11 Conf. on e-Business, e-Services, and e-Society (I3E 2011), IFIP AICT 353, Springer, Heidelberg. pp 58–72
doi:10.1186/1869-0238-4-8
Cite this article as:Mihoobet al.:Consumer-centric resource accounting in
the cloud.Journal of Internet Services and Applications20134:8.
Submit your manuscript to a
journal and benefi t from:
7Convenient online submission
7Rigorous peer review
7Immediate publication on acceptance
7Open access: articles freely available online
7High visibility within the fi eld
7Retaining the copyright to your article