http://www.sciencepublishinggroup.com/j/ijics doi:10.11648/j.ijics.20180301.12
ISSN:2575-1700(Print);ISSN:2575-1719(Online)
Bridging Communication Gap Among People with Hearing
Impairment: An Application of Image Processing and
Artificial Neural Network
Ogunsanwo Gbenga Oyewole, Goga Nicholas, Awodele Oludele, Okolie Samuel
Computer Science Department, Babcock University, Ilisan Remo, Nigeria
Email address:
To cite this article:
Ogunsanwo Gbenga Oyewole, Goga Nicholas, Awodele Oludele, Okolie Samuel. Bridging Communication Gap Among People with Hearing Impairment: An Application of Image Processing and Artificial Neural Network. International Journal of Information and Communication Sciences. Vol. 3, No. 1, 2018, pp. 11-18. doi: 10.11648/j.ijics.20180301.12
Received: February 21, 2018; Accepted: March 8, 2018; Published: March 30, 2018
Abstract:
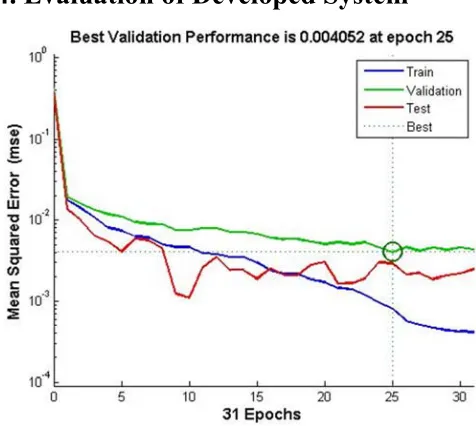
Before the present study, no sign language recognition system for the Nigeria indigenous sign language particularly Yoruba language has been developed. As a result, this research endeavors at introducing a Yoruba Sign Language recognition system using image processing and Artificial Neural Network (ANN).The proposed system (YSLRS) was implemented and tested. 600 images from 60 different signers were gathered. The images were acquired using vision based method, the different signers were asked to stand in front of a laptop’s camera make sign number from one to ten with their fingers in three different times and the images were stored in a folder. The image dataset was pre-processed for proper presentation for de-noising, segmentation and feature extraction. Thereafter, pattern recognition was done using feed forward back propagation ANN. The study revealed that Median filter with higher PSNR of 47.7 a lower MSE of 1.11, performed better than the Gaussian filter. Furthermore, the efficiency of the developed system was determined using mean square error and the best validation performance occurred at 25 epochs with a MSE of 0.004052, implying than ANN was able to adequately recognize the pattern of the Yoruba signs. Histogram was also used to determine the efficiency of the system, it can be seen that the histogram of the trained, tested and validated error bars were close to zero error, implying that the ANN and Receiver Operating Characteristic (ROC) was used to evaluate the performance of ANN in matching the features of the Yoruba Signs, which shows that ANN performed efficiently, having a high true positive rate and a minimum false positive rate. Finally, YSLRS developed in the study would reduce negative attitudes of victimizations suffered by the hearing-impaired individuals, by bridging communication gap among Nigerian PWD with hearing impairment.Keywords:
Image Processing, Machine Learning Techniques, Recognition System, Sign Language Yoruba1. Introduction
There is big communication gap between the hearing and the hearing-impaired people. Therefore, bridging this communication gap is a big task and requires technological interventions. A lot of research works have been done in the area of sign language recognition system development to provide solution to communication problems within the Deaf community. Sign language recognition system acquires data majorly through sensor based and vision based image acquisition process. Many researchers have endeavored to come-up with the optimum algorithm or solution for 100 percent recognition of signs. Until now, a large numbers of
techniques are being developed in order to recognize and classify the gestures of various sign languages; for instance, Arabic Sign Language [2] and [6], Tamil sign language [11] Chinese sign language [12], American sign language [1] Mexican sign language [10], Albanian sign language [4] and Korean sign language [7].
images acquired.
The acquired images were de-noised using Gaussian filter and Median filter algorithms. The results of the two de-noising algorithms were compared using Peak Signal to Noise Ratio (PSNR) and Mean Square Error (MSE). Median filtered images were segmented using K-means Clustering Algorithm, and the segmented features were extracted using Principal Component Analysis (PCA). The extracted features were recognized using Feed Forward Artificial Neural Network (ANN) that has high computational efficiency for extracting necessary features from sign image created in the database
2.
Methodology
2.1. Raw Data Acquisition
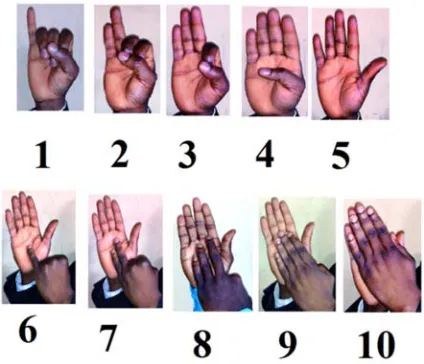
Data from 60 subjects (signers) were collected and utilized for the study. Each subject generated 10 samples of each static one to ten figures (600 total samples). The data were subsequently used to evaluate the performance of both models. In order to acquire data, the vision-based sign extraction method was used. This was achieved by fetching an input image based on a camera. Figure 1shows the samples of gestures created for the dataset. To create a gesture system database, the gestures were selected along with their connotations, in which each gesture contained various samples [5] to increase the accuracy of the system. Vision-based method was chosen because it is user friendly and popularly used in sign recognition systems. A fixed camera in front the signers were used to capture the sign gesture. Posture features of the fingers and palms were further extracted. After the data were collected, the images passed through different stages of image processing technique in order to enhance the quality of the image.
Figure 1. Samples of Dataset Used in the Research.
2.2. Image Pre-processing and De-Noising
Image pre-processing was employed in the research to enhance the gathered data. The image pre-processing procedure involved converting coloured images to grayscale,
resizing and de-noising. In order to make the image scale invariant, the pre-processed image were cropped to segment the background and concentrate only on the palms and fingers. To obtain this, the original images were converted to gray scale images using threshold method. The cropped gray scale images were further resized 50 x 80 pixels making the sign image scale independent. Thereafter, Gaussian and Median filtering techniques were used to remove noise from the image dataset, while the performance of these two filtering algorithms was evaluated using Peak Signal to Noise Ratio (PSNR) and Mean Square Error (MSE).
2.3. Segmentation and Feature Extraction
The de-noised image is subjected to segmentation process. The K-means clustering algorithm was adopted in this study. The objective of the K-means clustering algorithm is to divide an image into K segments (using K − 1 thresholds), minimizing the total within-segment variance. The variable K must be set before running the algorithm. The within-segment variance σ2w is defined by:
σ2w = ∑ (1)
where hi = ∑ ∈ is the probability that a random pixel belongs to segment i (containing the grey values in the range Si),
σ2i = ∑ ∈ is the variance of grey values
of segment i, and
= ∑ ∈ is the mean grey value in segment i. In order to execute the feature extraction process, the study adopted the Principal Component Analysis (PCA). In the Principal Component Analysis, each pixel of the image is initially considered to be a single feature, so an image with M rows and N columns image would have MN numerical features. These features form numerical features, which were adequate for use in the pattern recognition stage by ANN.
2.4. Artificial Neural Network (ANN)
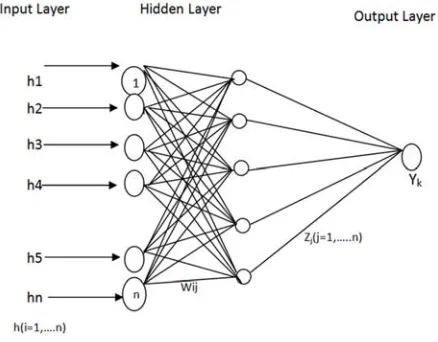
An ANN can be defined as a network of simple but interconnected processing units called neurons (or neuronal units), which are able to automatically adjust to information and learn aspects of this information by storing it in the connection strengths, represented as weights between neurons [9]as shown in Figure 1.
2. Determination of the system dynamics: this entails the weight initialization method, the activation-calculating formula, and the learning rule [9].
The number of units per layer, number of layers and the weighted connections specify the topology of a neural network. These types of layers are the Input layer, the Hidden layer (of which there may be none too many), and the Output layer [3] as shown in Figure 1. In a feed-forward network, data flows as indicated by the arrows, from the Input to the Output layer.
Figure 2. Neural network layers.
The Input layer obtains input signals or data from the outer part of the network having nodes called an Input unit. These units represent and encode the data or signal pattern presented to the network for processing [8]
The layer following the Input layer is refers to as Hidden layer, and the nodes in this layer are called Hidden units [9]. The Hidden layer usually consist of one or more layers of neurons with the next layers receiving input from predating layers in feed-forward architecture of the ANN. The Output layer is the last layer of the network; the nodes in this layer are called Output units [9]
3. Result AND Discussion
3.1. Gaussian Enhancement on the Acquired Sign Gesture Images
The acquired images had some noise, which had been introduced during capturing, the noise were introduced as a result of shadows from flash light of the digital camera used. To remove the noise, Gaussian filter was used to enhance the images, the Yoruba signs gestures were selected one after the other from the source folder. The Gaussian function was curled with the images. The output of this was a blur enhanced image that is free from noise. These processed images were stored in another folder that has been specified as the destination for the pre-processed images.
In order to enhance the images, the Gaussian radius and sigma value that was used to determine the level of enhancement was supplied. The Sigma value is an important
argument that determines the actual amount of blurring that will take place. The Radius was used to determine the size of the array which will hold the calculated Gaussian distribution. It should be an integer. The larger the Radius the slower the operations become.
Figure 3 to Figure 6 shows the filtered sign gesture images at a Gaussian radius of 20.
Figure 3. Pre-processed image of digit one at Gaussian radius of 20.
Figure 4. Pre-processed image of digit two at Gaussian radius of 20.
Figure 5. Pre-processed image of digit three at Gaussian radius of 20.
Figure 6. Pre-processed image of digit ten at Gaussian radius of 20.
Figure 7 to Figure 10 shows the result of the pre-processed sample image in figure 2 based on median filtering. It is observed that images appeared to be cleaner than the images, which had been de-noised at Radius of 20, this implies that the non linear filtering method of median filter performed better than the linear filtering method of the Gaussian.
Figure 8. Pre-processed image of digit two based on Median Filtering.
Figure 9. Pre-processed image of digit three based on Median Filtering.
Figure 10. Pre-processed image of digit ten based on Median Filtering.
3.2. Segmentation of Enhanced Yoruba Sign Gesture Images
The enhanced images were taken through the process of segmentation for partitioning of the images. Image segmentation is meant to simplify and change the representation of the Yoruba sign gesture images into a more meaningful and easier to analyze. This was expedient in order locate objects, boundaries, lines and weight bearing areas in the images.
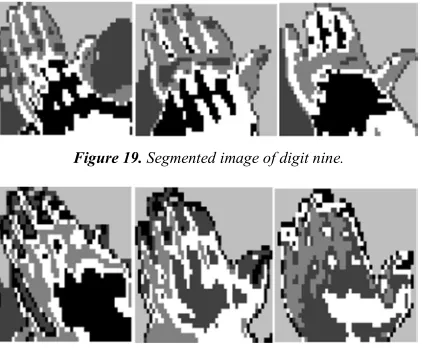
The K-means clustering algorithm was adopted for segmentation in the study. In order to achieve this process, the images were segmented into clusters, which were used to separate the weight bearing areas of the images. Different cluster counts were adopted in order to select the appropriate cluster count for the pre-processed images. Figure 11 to figure 20 shows the segmentation of the images based on Median filter.
It can be observed in figure 6 that at cluster count of 5 the images were segmented into various clusters. The part of the prints that bears the highest weight in the images had same cluster, which is represented by the dark shades. In contrast, some other parts of the images had lower weight, which is being represented by litter shades.
By increasing the cluster count of the images during segmentation, it was observed that the result became more incompetent, this increase in count made it more difficult to identify closely related weights, as a result, image segmentation based on 5 cluster count was adopted for the study.
Figure 11. Segmented image of digit one.
Figure 12. Segmented image of digit two.
Figure 13. Segmented image of digit three.
Figure 14. Segmented image of digit four.
Figure 15. Segmented image of digit five.
Figure 16. Segmented image of digit six.
Figure 17. Segmented image of digit seven.
Figure 19. Segmented image of digit nine.
Figure 20. Segmented image of digit ten.
3.3. Extracted Features Using Principal Component Analysis
In order to reduce the large dimensionality of the images to smaller dimensionality of feature, the clustered images were subjected to the principal component analysis (PCA). At this point the compact principal components of the prints which represent the feature space were acquired by projecting the eigenspace. The eigenspace was computed by recognizing the eigenvectors of the covariance matrix derived from the set of the Yoruba sign gestures. The eigenvectors derived from each image were then kept in an image database for further analysis. Figure 21 shows an example of computed eigenvectors of a segmented image.
Figure 21. Computed eigenvectors of Segmented Image (Im00042).
3.4. Pattern Matching with feed forward back propagation artificial neural network (ANN)
Using the feed forward back propagation artificial neural network (ANN) entails specifying the optimized weight which the network will use to generate output with minimum error. As a result, the ANN compares the extracted feature vectors of the test images with those that were kept in the database. From the generated output values, the image that returns the least value was reported and being the corresponding identified sign. In order to adopt ANN, the total number of images was divided into three sets for train, test and validation. After series of training, the best ANN structure was adopted for the study. The architecture of the most efficient ANN used in pattern recognition of the sign gestures is presented in figure 23. It could be seen in the
figure that 600 gestures were feed into the network, a single hidden layer with 11 nodes were selected to match the pattern of the target variable being the desired Yoruba gestures. The pattern recognition process was split into three groups, 70% of the data for training, 15% of the data was used for testing and 15 % for validation of the network (Table 1). Other information such as the algorithms, progress and plot were derived from the training of the network. Furthermore, table 1 shows the identification results of the signed gestures
Table 1. Data Set used in ANN.
DataSet Percentage
Training 70
Testing 15
Validation 15
Figure 22. Computed eigenvectors of Segmented Image (Im00042).
Figure 23. ANN training to olon MATLAB.
4. Evaluation of Developed System
Figure 24. Performance Plot of ANN based on MSE and Epochs.
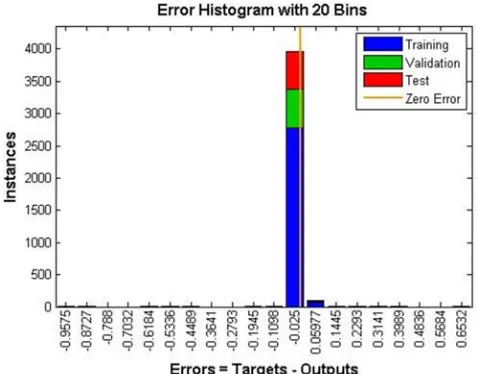
Figure 25. Error Histogram of ANN.
Figure 10 Error Histogram of ANN
Figure 26. Training ROC of ANN.
Figure 27. Test ROC of ANN.
Figure 28. Validation ROC of ANN.
The efficacy of the developed system was also determined by considering the Standard Performance Metrics, which constitutes the Receiver Operating Characteristic (ROC) being the main performance indicator. In the study, four possible records from the classification are presented. These include the True positive which was recorded when a sign gesture matches its corresponding target, False positive which was recorded when a gesture in output database could not be matched with any sign gesture captured, True negative was recorded when captured sign gesture could not be matched with any sign in the database, and False negative which was recorded when a sign image is wrongly matched with another meaning in the database. Figure 26 to figure 28 show the ROC curve of ANN. All plot shows that true positive rate was high, while the minimum false positive rate computed shows that developed ANN model was able to recognize the Yoruba Sign Language effectively .
5. Conclusion
The proposed system (YSLRS) was implemented and tested. Six hundred (600) images from ten different signers were gathered. The images were acquired using vision based method, the different signer were asked to stand in front of a laptop’s camera make sign number from one to ten with their fingers, and the images were stored in a folder. The acquired images were first resize to make the images constituent, noise were removed using Gaussian filter and median algorithm. In order to ascertain the most efficient filtering methods out of the two adopted; their performance were examined using Peak Signal to Noise Ratio (PSNR) and Mean Square Error (MSE), which unrevealed that the non-linear median filtering performed better.
Furthermore, the de-noised images based on median were prepared for segmentation process which was done using k-means clustering algorithm, feature were extracted from the segmented images using Principal component analysis (PCA). Then the extracted images were recognized using feed forward back propagation artificial neural network (ANN), which was efficient in recognizing the signs.
References
[1] Asha, T and Dixit, S. (2015) Sign Language Alphabets Recognition Using Wavelet Transform. Proceedings of Int'l Conference on Intelligent Computing, Electronics Systems and Information Technology (ICESIT-15) Aug 25-26, 2015 Kuala Lumpur (Malaysia).
[2] Assaleh. K and Al-Rousan M, (2005) Recognition of Arabic Sign Language Alphabet Using Polynomial Classifiers,ǁ EURASIP Journal on Applied Signal Processing, 2005, vol., no. 13, pp. 2136-2145.
[3] Fu, L., Neural Networks in Computer Intelligence, New York, NY: McGraw-Hill, Inc., 1994.
[4] Gani, E. and Kika, A. (2016). Albanian Sign Language (AlbSL) Number Recognition from Both Hand’s Gestures Acquired by Kinect Sensors. International Journal of Advanced Computer Science and Applications (IJACSA). 7(7): 216-220.
[5] Hasan, M.M. and P.K. Mishra, (2010). HSV brightness factor matching for gesture recognition system. QInt. J. Image Process., 4: 456-467.
[6] Khaled Assaleh, Tamer Shanableh, Mustafa Fanaswala, Harish Bajaj, and Farnaz Amin, (2008).” Vision-based system for Continuous Arabic Sign Language Recognition in user dependent mode”, Proceeding of the 5th International
Symposium on Mechatronics and its Applications (ISMA08), Amman, Jordan, May 27-29, 2008.
[7] Kim, J., Jang, W. & Bien, Z. (1996). A dynamic gesture recognition system for the Korean sign language (KSL). IEEE Trans Syst Man Cybern B Cybern. 1996;26(2):354-9
[8] Kumar, R.: Chauerjee, C.; Singh. R. D.; Lohani, A. K.; Kumar. S. 2004. GIUH based Clark and Nash Models for runoff estimation for an ungauged basin and their uncertainty analysis. International Journal of River Basin Management 2(4): 281-290.
[9] Ramapulana, N. (2011). Artificial Neural Network Modelling Of Flood Prediction and Early Warning. MS.c Dissertation submitted to the faculty of natural and agricultural science. University of Fee State Bloemfontein.
[10] Solís, F., Martínez, D., and Espinoza, O. (2016). Automatic Mexican Sign Language Recognition Using Normalized Moments and Artificial Neural Networks. Engineering. 8: 733-740.
[11] Subha Rajam P., and Balakrishnan, G. (2011). Recognition of Tamil Sign Language Alphabet using Image Processing to aid Deaf-Dumb People”, International Conference on Communication Technology and System Design.