ISSN: 2149-214X
www.jeseh.net
Analysis of Laboratory Videos of Science
Teacher Candidates with Many-Facet
Rasch Measurement Model
Ahmet Volkan Yuzuak1, Sinan Erten2, Yilmaz Kara1
1Bartın University 2
Hacettepe University
To cite this article:
Yuzuak, A.V., Erten, S. & Kara, Y. (2019). Analysis of laboratory videos of science teacher
candidates with many-facet Rasch measurement model.
Journal of Education in Science,
Environment and Health (JESEH), 5(2), 146-155.
DOI:10.21891/jeseh.568816
This article may be used for research, teaching, and private study purposes.
Any substantial or systematic reproduction, redistribution, reselling, loan, sub-licensing,
systematic supply, or distribution in any form to anyone is expressly forbidden.
Authors alone are responsible for the contents of their articles. The journal owns the
copyright of the articles.
Journal of Education in Science, Environment and Health
Volume 5, Issue 2, 2019 DOI:10.21891/jeseh.568816
Analysis of Laboratory Videos of Science Teacher Candidates with
Many-Facet Rasch Measurement Model
Ahmet Volkan Yuzuak, Sinan Erten, Yilmaz Kara
Article Info
Abstract
Article History
Received: 15 November 2018
Aim of the present study is to analyze science teacher candidates‘ laboratory videos by using Many-facet Rasch model. Survey method was used in the study. The study was conducted in 2017-2018 academic year spring semester. Rasch model‘s surfaces are respectively: 9 juries, 13 science activities and 19 criteria. FACETS program was used for data analysis. Findings reveal that laboratory video, which was coded as SA8, was found to be the most successful and SA1 coded video was found the most unsuccessful with respect to criteria. The simplest articles which science teacher candidates were subjected are ―introducing yourself‖, ―using proper costume‖, ―appropriate time‖ and the articles for which the science teacher candidates are constrained mostly ―sound-supporting effect‖, ―writing effect‖, ―warning for security precautions‖. Jury numbered 3 or coded as J3 is ―the most lenient‖ and scorer numbered 2 is ―the severest‖ when juries are sequenced from the most lenient. Moreover, it could be said that, some of the jury members were extremely severe or lenient against some science activities according to bias analysis.
Accepted: 28 May 2019
Keywords
Science activities Laboratory videos Rasch model
Introduction
Laboratory is one of the main part of and plays a central role science education (Hofstein & Lunetta, 1982; Hofstein & Mamlok-Naaman, 2007). The science laboratories have been considered as the most convenient place to teach science. Since students perform experiments to learn science in science laboratories, teaching can be more effective with respect to other learning environments such as classrooms. Laboratory activities in science education provide opportunities to develop scientific concepts, improve interest and motivation, and acquire problem solving and scientific practical skills, scientific habits of mind and understanding of nature of science (Bopegedera, 2011; Deiner et al., 2012; Roth, 2013; Walker & Sampson, 2013).
In order to make possible the provided opportunities through laboratory teaching for the science students, science teachers need to have specific field knowledge and pedagogical field knowledge (Boesdorfer & Lorsbach, 2014). First, science teachers need to have deep understanding on a specific science concept especially for the abstract ones. Then, they need to decide or design for the convenient laboratory activity with the consideration of their science laboratory opportunities, student profile, and their understanding. Later, they need to implement the laboratory activity as possible as they designed and be ready for the unexpected situations. Finally, they need to make assessment for each laboratory activity in order to be sure that their students get well from the opportunities of science laboratory. After all these efforts, the perfect achievement is not guaranteed as much as expected since science students need to be active participants of the laboratory activities. In other words, science laboratory activities can easily become science cookbook activities which mean doing somewhat scientific activity without making any sense (Herron, 2009).
educators in order to improve the performance of science education process. So, it was aimed to determine opinions of science teacher candidates on laboratory videos related to science laboratory activities.
Technology or laboratory approach was embedded in the instruction, students learn better and their attitudes increase (Oymak & Ogan-Bekiroglu, 2017). ―Video is generally thought to be a valuable medium for exploring teaching and learning because it captures much of the richness of the classroom setting‖ (Sherin, Linsenmeier, & van Es, 2009, p. 214). Laboratory videos may be evaluated with the help of Many-facet Rasch measurement model. As evaluating the measurement tools, two theories are commonly used: Classical Test Theory and Item Response Theory. Even though there are similarities between these theories it can be said that Item Response Theory has some advantages (Hambleton & Swaminathan, 1985). According to the Classical Test Theory, measurement is a matter of a certain amount of error, observing the knowledge and skills to be measured and converting the results of the observations into numbers and symbols. In Classical Test Theory an examinee‘s observed score can be expressed as; X = T + E. In the equation, X is observed score, T is true score and E is error score (Crocker & Algina, 1986). With the help of models depend on Item Response Theory a linear relationship can be obtained, loss data can be overcome, accuracy of measurement can be estimated and results that do not meet standard values can be evaluated (Elhan & Atakurt, 2005; Aziz & Masodi, 2010).
Rasch model is one parameter logistic as well as static model within Item Response Theory (IRT). With the help of Rasch model each person with a certain amount of a given latent trait specifies the probability of a response. For Rasch model which is the simplest model based on Item Response Theory, the natural logarithm of the odds ratio is modeled by the difference between person‘s trait score and item‘s difficulty. The standard Rasch model with persons and items: log (Pni / (1-Pni)) = Bn – Di. Pni is the probability that person n will succeed on item I;
person n has ability Bn and Di is the difficulty of item (Linacre, 2014; Embretson & Reise, 2000). Severity or
leniency of the juries was added to Rasch model for Many-Facet Rasch Measurement (Linacre, 1993). The simple general form of Many-facet Rasch model can be expressed as follows:
= Bn-Di-Cj-Fk
In the formula,
Pnijk is the probability of examinee n being awarded on item i by judge j a rating of k
Pnijk-1 is the probability of examinee n being awarded on item i by judge j a rating of k-1
Bn is the ability of examinee n
Di is the difficulty of item I
Cj is the severity of judge j
Fk is the extra difficulty overcome in being observed at the level of category k, relative to
category k-1 (Linacre, 1989).
Rasch model which is one parameter logistic model depends on Item Response Theory and explained in ―Some Probabilistic Models for Intelligence and Attainment Tests‖ book by George Rasch (Rasch, 1960). Rasch model and Many-facet Rasch model approach has been used in a steadily increasing number of applications in the fields of language testing (Bonk & Ockey, 2003; Eckes, 2005), educational and psychological measurement (Yılmaz & Sözer, 2018; Köse, Sözbir & Kalender, 2017; Ismail, Roslan, Adnan, 2017; Çetin & İlhan, 2017; Chang & Engelhard, 2016; Ahmad, Ali & Zainudin, 2011; Semerci, 2011a, Semerci, 2011b; Kaya Uyanık, Güler, Taşdelen Teker & Demir, 2017), health sciences (Park, Kim, Cha, Minn, Kim & Kim, 2018).
Aims of the study
The aim of the study is to make ―Analysis of laboratory videos related to science activities with Many-Facet Rasch measurement model‖. In parallel with this purpose;
1. Analysis of science activities performance, 2. Criterion hardness analysis,
148 Yuzuak, Erten & Kara
Method
In the study survey method was used. The observed data were analyzed by Many-Facet Rasch model. The facets or surfaces used laboratory videos of science teacher candidates; judge severity/ leniency and the relevancy of the used items: 9 juries, 13 science activities and 19 items or criteria. Jury was coded as J1, J2, … , J9; 13 science activities were coded as SA1, SA2, … , SA19 and criteria were coded as abbreviation.
Study group
The study was conducted in 2017-2018 academic year spring semester. 9 science teacher candidates were included in the peer assessment process. Linacre (1993) stated that in the Rasch measurement model, there is no assumption that the results of the data obtained from the sample are generalized to the universe. That‘s why ―study group‖ concept was used in the study. Teacher candidates prepared science activities under first author supervision. These science activities were coded as: SA1: Nutrient content, SA2: Force measurement, SA3: Friction, SA4: Friction and mass, SA5: Melting and freezing, SA6: From gas to liquid or vice versa, SA7: Boiling water, SA8: Pure substances, SA9: Boiling temperature of water, SA10: From ice to liquid or vice versa, SA11: Naphthalene dissolution, SA12: Water temperatures change, SA13: Expansion and contraction.
Research data
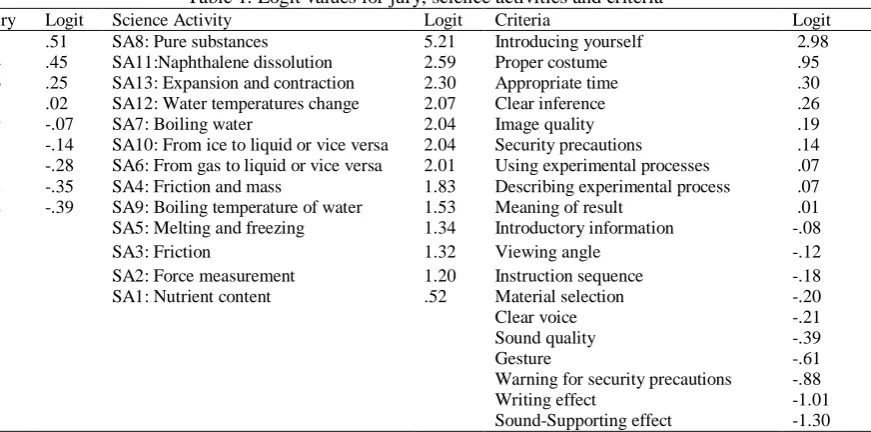
Assessment or criteria form (Kara & Bakirci, 2017) was examined and 19 items were arranged in 5-pointed Likert type between ―not appropriate‖ corresponding to 1 and ―completely appropriate‖ corresponding to 5. Criteria were indicated in Table 1. Expert opinion was obtained from one expert of measurement and evaluation and three experts of science education department. After experts approved the form in terms of usability and clarity of statements, it was used for the study. Cronbach‘s α coefficient for reliability was calculated as .89. The quantitative data obtained in the study were analyzed with Many-facet Rasch model. FACETS 3.71.4 program was used to analyze data (Linacre, 2014).
Findings
When taking into consideration the analysis of laboratory videos or science activities of the science teacher candidates with many-facet Rasch measurement model the surfaces used in study (laboratory videos, severity/leniency of the juries and criteria) and the general information concerning these surfaces are given in Figure 1. The measure on the left side of Figure 1 is the logit measurement located between (-) and (+) and same for three surfaces.
The general information concerning these surfaces are given in calibration map in Figure 1. According to Figure 1, J3, J4 and J6 scored above the intermediate level on the other hand J9, J1, J7, J8 and J2 scored science activities below the intermediate level. SA8 is the most sufficient activity with respect to criteria. Logit values and more detailed information about calibration map were indicated in Table 1.
Table 1. Logit values for jury, science activities and criteria
Jury Logit Science Activity Logit Criteria Logit
J3 .51 SA8: Pure substances 5.21 Introducing yourself 2.98
J4 .45 SA11:Naphthalene dissolution 2.59 Proper costume .95
J6 .25 SA13: Expansion and contraction 2.30 Appropriate time .30
J5 .02 SA12: Water temperatures change 2.07 Clear inference .26
J9 -.07 SA7: Boiling water 2.04 Image quality .19
J1 -.14 SA10: From ice to liquid or vice versa 2.04 Security precautions .14
J7 -.28 SA6: From gas to liquid or vice versa 2.01 Using experimental processes .07
J8 -.35 SA4: Friction and mass 1.83 Describing experimental process .07
J2 -.39 SA9: Boiling temperature of water 1.53 Meaning of result .01
SA5: Melting and freezing 1.34 Introductory information -.08
SA3: Friction 1.32 Viewing angle -.12
SA2: Force measurement 1.20 Instruction sequence -.18
SA1: Nutrient content .52 Material selection -.20
Clear voice -.21
Sound quality -.39
Gesture -.61
Warning for security precautions -.88
Writing effect -1.01
Sound-Supporting effect -1.30
According to Table 1 it can be said that laboratory video numbered as SA8 (logit= 5.21) is successful at higher level, laboratory video numbered as SA1 (logit= .52) is successful at the lowest level. The most lenient jury is number J3 (logit= .51) and the severest member of jury is number J2 (logit= -.39). It was observed that the most difficult criteria is ―Sound-supporting effect (logit= -1.30)‖ as well as ―writing effect (logit=-1.01)‖ amongst the evaluation criterions of laboratory videos. It could be said that, these criterions were met at lower level in reference to other criterions. The easiest criterion is ―introduction yourself (logit= 2.98)‖ and ―using proper costume (logit= .95)‖.
Science activities performance analysis
A detailed measurement report including laboratory videos related to science activities of the science teacher candidates are shown in Table 2 which indicates that RMSE or Root Mean Square Standard Error was found .31 and the number is lowered than critical value standard deviation was found 1.06. Reliability was calculated as .92. This reliability value shows at which reliability the laboratory videos were evaluated. This coefficient .92 shows that science teacher candidates are graded in a high reliability.
Table 2. Science activities measurement
Science Activities Nu Measure Model S.E Infit ZStd Outfit ZStd Total Score Obsvd Average
SA8 8 5.21 1.00 .98 .3 .38 .0 759 4.99
SA11 11 2.59 .24 .80 -.4 .86 -.1 745 4.90
SA13 13 2.30 .20 1.41 1.1 1.76 1.5 739 4.86
SA12 12 2.07 .17 1.05 .2 2.11 2.2 732 4.82
SA7 7 2.04 .17 1.27 .9 .67 -.8 731 4.81
SA10 10 2.04 .17 1.13 .4 .78 -.4 731 4.81
SA6 6 2.01 .16 1.57 1.7 .96 .0 730 4.80
SA4 4 1.83 .14 1.08 .3 .86 -.2 717 4.75
SA9 9 1.53 .11 1.23 1.0 1.01 .1 703 4.63
SA5 5 1.34 .10 1.26 1.3 .74 -.8 684 4.53
SA3 3 1.32 .10 1.29 1.5 1.37 1.2 685 4.51
SA2 2 1.20 .09 1.11 .7 .96 .0 702 4.42
SA1 1 .52 .07 .69 -3.1 .69 -1.8 635 3.71
150 Yuzuak, Erten & Kara
Null hypothesis was rejected when ―there is a measurable distinction amongst the laboratory videos of science teacher candidates‖ hypothesis that belongs to fixed effect with separation index 3.39 and reliability coefficient .92 was tested with chi-square test (x2=309.6, df: 12, p= .00). This conclusion shows that there are significant distinctions between the laboratory videos of science teacher candidates in terms of statistical. The qualification sequence of performance tasks is as follows: SA8, SA11, SA13, SA12, SA7, SA10, SA6, SA4, SA9, SA5, SA3, SA2 and SA1.
Criteria Difficulties Analysis
Criteria measurement report are given for the criteria used evaluation of science activities in Table 3. Separation index was found 2.93 and reliability coefficient was found .90. Null hypothesis was rejected when ―there is significant distinctions between difficulties of articles used in evaluation of science activities‖ hypothesis was tested with chi square (x2= 258.6, df: 18, p= .00). According to these results, there is a significant distinctions between articles used in evaluation of science activities statistically. According to Table 3 the simplest articles which science teacher candidates were subjected are ―introducing yourself‖, ―using proper costume‖, ―appropriate time‖ and the articles for which the science teacher candidates are constrained mostly ―sound-supporting effect‖, ―writing effect‖, ―warning for security precautions‖.
Table 3. Criteria measurement report
Criteria Meas. S.E Infit ZStd Outfit ZStd Total.score Obs. Aver.
Introducing yourself 2.98 1.00 .98 .4 .53 .4 529 4.99
Proper costume .95 .34 1.40 1.9 3.08 1.9 517 4.92
Appropriate time .30 .22 .54 -.7 .51 1.05 503 4.84
Clear inference .26 .21 .48 -.6 .57 1.04 507 4.83
Image quality .19 .20 .98 .7 1.39 .91 510 4.81
Security precautions .14 .19 1.39 .3 1.07 1.03 504 4.80
Using experimental
processes
.07 .18 .48 -.9 .51 1.05 502 4.78
Describing experimental process
.07 .18 .61 -.9 .49 1.06 502 4.78
Meaning of result .01 .18 .66 -.1 .82 .95 500 4.76
Introductory information -.08 .17 .99 -.6 .65 1.07 497 4.73
Viewing angle -.12 .16 .83 -.2 .81 1.05 500 4.72
Instruction sequence -.18 .15 .62 -.9 .56 1.02 493 4.70
Material selection -.20 .15 1.38 .0 .96 1.17 492 4.69
Clear voice -.21 .15 1.20 .2 1.07 .94 496 4.68
Sound quality -.39 .13 .76 -.3 .79 .94 487 4.59
Gesture -.61 .12 1.00 -.1 .87 .94 469 4.47
Warning for security
precautions
-.88 .10 1.04 .7 1.26 1.21 447 4.26
Writing effect -1.01 .10 1.40 1.4 1.53 .93 435 4.14
Sound-Supporting effect -1.30 .09 1.54 2.0 1.69 .67 403 3.80
Seperation: 2.93 Reliability: .90 x2= 258.6, df: 18, p= .00
Analysis of Jury
Table 4. Jury measurement report
Jury Nu Measure Model S.E Infit ZStd Outfit ZStd Total Score Obsvd Average
J3 3 .51 .14 1.06 .3 .84 .0 1193 4.83
J4 4 .45 .13 .87 -.5 .36 -1.3 1190 4.92
J6 6 .25 .12 1.85 3.2 1.81 1.4 1177 4.90
J5 5 .02 .10 .90 -.4 1.43 .9 1158 4.88
J9 9 -.07 .17 .52 -1.8 .41 -1.2 99 4.86
J1 1 -.14 .09 .98 .0 .52 -1.2 1136 4.85
J7 7 -.28 .09 1.27 1.6 1.05 .2 1120 4.83
J8 8 -.35 .08 .87 -.8 1.13 .4 1113 4.81
J2 2 -.39 .08 1.08 .5 1.00 .1 1107 4.80
Seperation: 2.74 Reliability: .88 x2=73.2, df=8, p= .00
Jury Bias Analysis
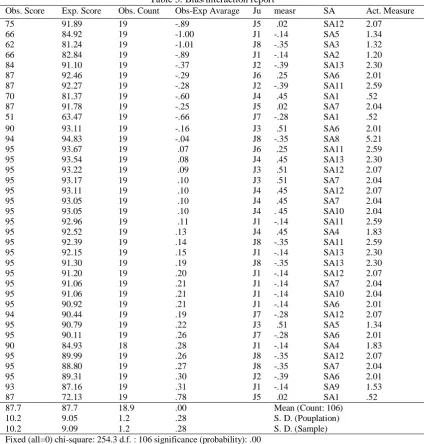
Bias/interaction graphic can concrete the situation and absolute measure of jury and science activities can be examined. The bias analysis of the jury is given in Table 5.
Table 5. Bias/interaction report
Obs. Score Exp. Score Obs. Count Obs-Exp Avarage Ju measr SA Act. Measure
75 91.89 19 -.89 J5 .02 SA12 2.07
66 84.92 19 -1.00 J1 -.14 SA5 1.34
62 81.24 19 -1.01 J8 -.35 SA3 1.32
66 82.84 19 -.89 J1 -.14 SA2 1.20
84 91.10 19 -.37 J2 -.39 SA13 2.30
87 92.46 19 -.29 J6 .25 SA6 2.01
87 92.27 19 -.28 J2 -.39 SA11 2.59
70 81.37 19 -.60 J4 .45 SA1 .52
87 91.78 19 -.25 J5 .02 SA7 2.04
51 63.47 19 -.66 J7 -.28 SA1 .52
90 93.11 19 -.16 J3 .51 SA6 2.01
94 94.83 19 -.04 J8 -.35 SA8 5.21
95 93.67 19 .07 J6 .25 SA11 2.59
95 93.54 19 .08 J4 .45 SA13 2.30
95 93.22 19 .09 J3 .51 SA12 2.07
95 93.17 19 .10 J3 .51 SA7 2.04
95 93.11 19 .10 J4 .45 SA12 2.07
95 93.05 19 .10 J4 .45 SA7 2.04
95 93.05 19 .10 J4 . 45 SA10 2.04
95 92.96 19 .11 J1 -.14 SA11 2.59
95 92.52 19 .13 J4 .45 SA4 1.83
95 92.39 19 .14 J8 -.35 SA11 2.59
95 92.15 19 .15 J1 -.14 SA13 2.30
95 91.30 19 .19 J8 -.35 SA13 2.30
95 91.20 19 .20 J1 -.14 SA12 2.07
95 91.06 19 .21 J1 -.14 SA7 2.04
95 91.06 19 .21 J1 -.14 SA10 2.04
95 90.92 19 .21 J1 -.14 SA6 2.01
94 90.44 19 .19 J7 -.28 SA12 2.07
95 90.79 19 .22 J3 .51 SA5 1.34
95 90.11 19 .26 J7 -.28 SA6 2.01
90 84.93 18 .28 J1 -.14 SA4 1.83
95 89.99 19 .26 J8 -.35 SA12 2.07
95 88.80 19 .27 J8 -.35 SA7 2.04
95 89.31 19 .30 J2 -.39 SA6 2.01
93 87.16 19 .31 J1 -.14 SA9 1.53
87 72.13 19 .78 J5 .02 SA1 .52
87.7 87.7 18.9 .00 Mean (Count: 106)
10.2 9.05 1.2 .28 S. D. (Pouplation)
152 Yuzuak, Erten & Kara
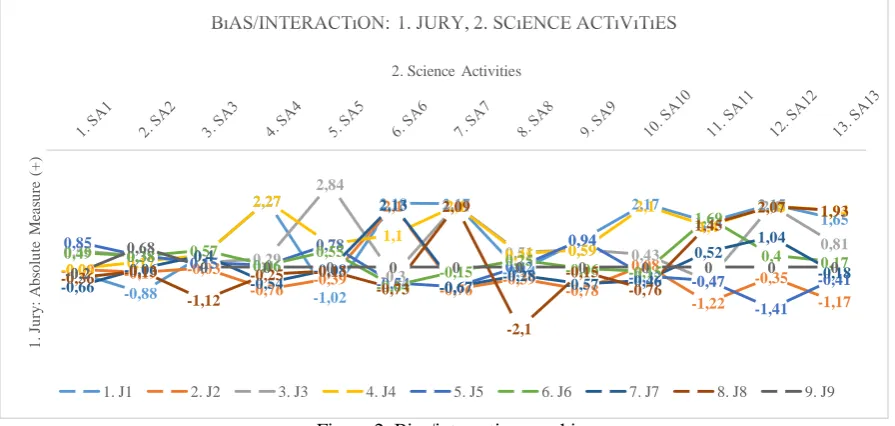
It could be said that, some of the jury members were extremely severe or lenient against some science activities according to bias analysis. For instances it was observed that, J8 made an extremely severe scoring by giving 62 point for science activities although jury was expected to give nearly 82 point in the evaluation related to science teacher candidates‘ science activity (SA3). A similar case is for J1 that J1 gave S5 66 point instead expecting to give about 85. On the other hand lenient scoring was also observed. J5 gave SA1 87 point instead expecting to give 72. 13.For more detailed information about jury bias, Table 5 may be examined. In Figure 2 bias/interaction graphic is given.
Figure 2. Bias/interaction graphic
Conclusion and Recommendations
The Rasch model has two main advantages. First one is specific objectivity and second one is that its stability although it may be used for small samples (Fischer 1997; Fischer 2005; Linacre 1994; Linacre, 2006). In this study, the analysis was performed for videos of science teacher candidates related to laboratory activities with many-facet Rasch measurement model. The surfaces of model were jury, laboratory videos and criteria. Reliability coefficient of Rasch analysis is similar to Cronbach alpha or KR-20 (Linacre, 1997). Measurement report of Many-Facet Rasch measurement model indicate reliability coefficient. In this study, reliability coefficients were calculated 0.92 for science activities performance analysis, 0.88 for jury analysis and 0.90 for criteria difficulties.
The laboratory video which was coded as SA8, was found to be the most successful and SA1 coded video was found most unsuccessful with respect to criteria. Jury numbered 3 or coded as J3 is ―the most lenient‖ and scorer numbered 2 is ―the severest‖ when juries are sequenced from the most lenient. It could be said that, some of the jury members were extremely severe or lenient against some science activities according to bias analysis. In the literature differences in rating process between raters or juries can be determined.
The videos prepared by science teacher candidates related to science experiments were subjected to performance analysis. The results of the analysis reveal that the videos of laboratory activities prepared by the science teacher candidates differ in terms of the evaluation criteria. In the reflection of the videos prepared by science teacher candidates on the performance analysis results, teacher candidates' ability to prepare different videos, their knowledge, attitude and interest, pedagogical competencies have been effective (Christ et al., 2014). In addition, the evaluation criteria used were effective to a certain extent. Although, the criteria used in the assessment were determined at the beginning of the study and shared with prospective teachers, prospective teachers showed different performance in fulfilling the expectations (Christ et al., 2012). There is also the effect of the scores of the juries independently of each other in the performance difference. The fact that juries gave points or variable scores when giving points to videos gave rise to a result that could be seen as bias (Van Es et al., 2014).
The criteria used in the evaluation of the videos prepared by science teacher candidates about science experiments were subjected to difficulty analysis. Analysis results indicate that there are differences between the
-0,2 -0,88
0,4
2,27
-1,02
2,18 2,17
-0,14 0,94 2,17 1,54 2,15 1,65
-0,09 -0,19 -0,03
-0,76 -0,39 2,1
-0,76 -0,39 -0,78
0,08
-1,22 -0,35
-1,17
0,55 0,38
0,15 0,29
2,84
-0,3 2,11
0,51 0,59 0,43
-0,47 2,1
0,81
-0,06 0,17 0,4
2,27
0,78 1,1 2,1
0,45 0,59 2,1
1,4
2,08 1,94
0,85
0,38 0,15 0,06
0,78
-0,54 -0,67 0,02
0,94
-0,32 -0,47
-1,41 -0,41
0,49 0,38 0,57
0,06 0,55
-0,64 -0,15 0,25
-0,06 -0,15 1,69
0,4 0,17
-0,66
-0,06 0,4
-0,54 -0,08 2,13
-0,67 -0,28 -0,57 -0,46
0,52 1,04 -0,18 -0,36 -0,13
-1,12
-0,25 -0,13 -0,73 2,09 -2,1 -0,15 -0,76 1,45
2,07 1,93
-0,2 0,68
0 0 0 0 0 0 0 0 0 0 0
1 . Ju ry : A b so lu te M ea su re (+ )
2. Science Activities
criteria used in the evaluation. In the videos of the science laboratory prepared by teacher candidates, it is understood that they can fulfill the narrator criteria such as ‖introducing themselves and‖ using ―proper costume‖. On the other hand, it has been revealed that the teacher candidates have difficulty in technical subjects such as using ―sound-supporting effect and ―writing effect‖. In addition, it is revealed that science teacher candidates have difficulty in covering the security issue such as laboratory safety in prepared videos. In this context, it was revealed that that science teacher candidates were not challenged in the narrator and activity process criteria when preparing videos, but they had difficulty in technical specifications and laboratory safety criteria. Even though teacher candidates have successfully completed computer course techniques including video editing techniques and laboratory safety techniques including video editing techniques, they have difficulty in gathering the competencies they acquired in different courses in order to prepare an instructional material. In the video analysis studies that focus on decision making justification (Rich et al ., 2008), reflective thinking, teaching skills (Nagro et al., 2017) and science achievements (Taylor et al., 2017) , teacher candidates are expected to they were forced to demonstrate the knowledge, skills and abilities they were expected to acquire. It is also effective that that teacher candidates work in a way to produce a product as well as having the knowledge and skills expected to show a comfortable or compelling attitude about fulfilling their expectations (Masats & Dooly, 2011).
The jury bias analysis was performed on the data obtained from the evaluation of teacher candidates' videos about science experiments. The results of the analysis indicate that there are bias among the juries that are in the evaluation. In fact, the juries that will conduct a video evaluation at the beginning of the study were briefed about the scope, importance and how to make the evaluation. However, because juries are independent of each other and they reflect the impressions they get from the evaluation videos in the direction of their knowledge, skills and abilities, they have different evaluation scores and jury biases (Semerci et al ., 2013). In addition, the juries were determined among the pre-service teachers. In other words, judges have made peer evaluation. Although it is assumed that juries will be evaluated in line with the research objectives and based on the evaluation criteria, criticism or over-criticism can be made in peer review (Şahin et al ., 2016) .
Şahin et al. (2016) analyzed peer assessment through Many-facet Rasch measurement model. The research was conducted with 91 graduate undergraduate students and with the lecturer. Semerci et al. (2013) aimed to make analysis of seminar presentation performances of postgraduate students. The study group included seven students and five juries observed their seminars. Some of the jury members were extremely severe or lenient against some post graduate students according to bias analysis. Study of European Council (2009) stated that Rasch measurement model doesn‘t reveal biases but it indicates the references of biases and to which jury does biases belong to. The biases which appeared may have various reasons such as professional experience, personality traits, attitudes, demographic characteristics workload, and assessment purpose.
The simplest articles which science teacher candidates were subjected are ―introducing yourself‖, ―using proper costume‖, ―appropriate time‖ and the articles for which the science teacher candidates are constrained mostly ―sound-supporting effect‖, ―writing effect‖, ―warning for security precautions‖. The results of the study were discussed with science teacher candidates and they were informed how they can develop their skills. It may be recommended that similar studies can be conducted with different measurement tools and raters. By this way researchers may analyze case objectively and define the educational materials.
References
Ahmad, K., Ali, N. M., & Zainudin, S. (2011). An improved course assessment measurement for analyzing learning outcomes performance using Rasch model. Procedia-Social and Behavioral Sciences, 18, 442-449.
Aziz, A. & Masodi, M.S. (2010). Workshop on Rasch analysis: a practical guide to winsteps. Retrieved from http://www.docstoc.com/docs/55062758/Rasch-Workshop-Booklet---Structu.
Boesdorfer S. & Lorsbach A. (2014). PCK in action: Examining one chemistry teacher's practice through the lens of her orientation toward science teaching, International Journal of Science Education, 36(13), 2111-2132.
Bond-Robinson, J. & Rodriques R. (2006). Catalyzing graduate teaching assistants' laboratory teaching through design research. Journal of Chemical Education, 83(2), 313-323.
Bonk, W. J., & Ockey, G. J. (2003). A many-facet Rasch analysis of the second language group oral discussion task. Language Testing, 20(1), 89-110. doi:10.1191/0265532203lt245oa
154 Yuzuak, Erten & Kara
Çetin, B., & Ilhan, M. (2017). An analysis of rater severity and leniency in open-ended mathematic questions rated through standard rubrics and rubrics based on the SOLO taxonomy. Education and Science,
42(189).
Chang, M. L., & Engelhard Jr, G. (2016). Examining the Teachers‘ Sense of Efficacy Scale at the item level with Rasch measurement model. Journal of Psychoeducational Assessment, 34(2), 177-191.
Christ, T., Arya, P., & Chiu, M. (2012). Collaborative Peer Video Analysis: Insights About Literacy Assessment and Instruction. Journal of Literacy Research, 44(2), 171-199.
Christ, T., Arya, P., & Ming Chiu, M. (2014). Teachers‘ reports of learning and application to pedagogy based on engagement in collaborative peer video analysis. Teaching Education, 25(4), 1-26.
Crocker, L. & Algina, J. (1986). Introduction to Classical and Modern Test Theory. USA: Harcourt Brace Javanovich College Publishers.
Deiner, L., Newsome, D., & Samaroo, D. (2012). Directed self-inquiry: A scaffold for teaching laboratory report writing. Journal of Chemical Education, 89(12), 1511-1514.
Donnelly J.F. (1998). The place of the laboratory in secondary science teaching, International Journal of Science Education, 20(5), 585-596.
Eckes, T. (2005). Examining rater rffects in testDaF writing and speaking performance assessments: A many-facet Rasch analysis. Language Assessment Quarterly, 2(3), 197-221. doi:10.1207/s15434311laq0203_2
Elhan A. H. & Atakurt Y. (2005). Ölçeklerin değerlendirilmesinde niçin Rasch analizi kullanılmalıdır? Ankara Üniversitesi Tıp Fakültesi Mecmuası. 58, 47-50.
Embretson, S. E. & Reise, A. P. (2000). Item response theory for psychologists. USA: Lawrance Erlbaum Associates.
Engelhard Jr, G., Wang, J., & Wind, S. A. (2018). A tale of two models: Psychometric and cognitive perspectives on rater-mediated assessments using accuracy ratings. Psychological Test and Assessment Modeling, 60(1), 33-52.
European Council, (2009). Common European Framework of Reference for Languages: learning, teaching, assessment: Cambridge University Press.
Fisher, W. P., Jr. (1997). Blind guides to measurement. Rasch measurement transactions, 11(2), 566-567. Retrieved December 1, 2009, from http://www.rasch.org/mrt/rmt112g.htm
Fisher, W. P., Jr. (2005). Meaningfulness, measurement and item response theory (IRT). Rasch Measurement
Transactions, 19 (2), 1018-1020. Retrieved December 1, 2009, from
http://www.rasch.org/mrt/rmt192d.htm
Greene J.S. (2000). A biology laboratory internship program: Improving preservice teacher education. The American Biology Teacher, 62 (2), 108-112.
Hambleton, R.K., & Swaminathan, H. (1985). Item response theory principles and applications. Kluwer-Nijhoff Publishing, USA.
Hasson, E. & Yarden, A. (2012). Separating the research question from the laboratory techniques: Advancing high-school biology teachers' ability to ask research questions. J. Res. Sci. Teach., 49(10), 1296–1320. Herron, S.S. (2009). From cookbook to collaborative: Transforming a university biology laboratory course. The
American Biology Teacher, 71(9), 548-552.
Hofstein, A. & Lunetta, V. N. (1982). The role of the laboratory in science teaching: neglected aspects of research. Review of Educational Research, 52, 201-217.
Hofstein, A. & Mamlok-Naaman. (2007). The laboratory in science education: the state of the art. Chemistry Education Research and Practice, 8, 105-107.
Ismail, A., Roslan, L., & Adnan, A. N. (2017, November). Assessment on course outcome performance using Rasch measurement model. In Engineering Education (ICEED), 2017 IEEE 9th International Conference on (pp. 110-113). IEEE.
Kara, Y., & Bakirci, H. (2017). A scale to assess science activity videos (SASAV): the study of validity and reliability. Journal of Education and Training Studies, 6(1), 43-51.
Kaya Uyanık, G., Güler, N., Taşdelen Teker, G. & Demir, S. (2017). Türkiye‘de Eğitim Alanında Yayımlanan Ölçek Geliştirme Çalışmalarının Uygunluğunun Çok Yüzeyli Rasch Modeli ile İncelenmesi. Journal of Measurement and Evaluation in Education and Psychology, 8(2), 183-199.
Köse, İ. A., Sözbir, S. A., & Kalender, C. (2017). Keman Çalma Becerilerinin Çok Yüzeyli Rasch Modeli İle İncelenmesi. Abant İzzet Baysal Üniversitesi Eğitim Fakültesi Dergisi.
Linacre, J. M. (1989). Many-Facet Rasch measurement. Chicago, IL: MESA Press.
Linacre, J. M. (1993, April). Generalizability theory and many facet Rasch measurement. Annual Meeting of the American Educational Research Association. Atlanta Georgia.
Linacre, J. M. (1997). Kr-20/Cronbach alpha or rasch person reliability: which tells the "truth"? Rasch Measurement Transactions,11(3), 580-1.
Linacre, J. M. (2006). Winsteps. Rasch measurement computer program. Chicago: Winsteps. Retrieved December 1, 2009, from http://www.winsteps.com/winman/index.htm
Linacre, M. (2014). A user’s guide to FACETS. Rasch model computer programs. Chicago, IL.
Masats, D. & Dooly, M. (2011). Rethinking the use of video in teacher education: a holistic approach. Teaching and Teacher Education: An International Journal of Research and Studies, 27(7), 1151-1162.
Nagro, Sarah A., DeBettencourt, Laurie U., Rosenberg, Michael S., Carran, Deborah T., & Weiss, Margaret P. (2017). The effects of guided video analysis on teacher candidates' reflective ability and instructional skills. Teacher Education and Special Education, 40(1), 7-25.
Oymak, O. & Ogan-Bekiroglu, F. (2017). Comparison of students ‗learning and attitudes in technology supported and laboratory based environments. The Eurasia Proceedings of Educational & Social Sciences, 6, 109-113.
Park, H., Kim, H. S., Cha, Y. J., Choi, J., Minn, Y., Kim, K. S., & Kim, S. H. (2018). The Effect of Mental Rotation on Surgical Pathological Diagnosis. Yonsei medical journal, 59(3), 445-451.
Pickering M. (1993). The teaching laboratory through history. Journal of Chemical Education, 70 (9), 699. Rasch, G. (1960). Probabilistic models for some intelligence and attainment tests. Chicago: The University of
Chicago Press.
Rich, Peter J., & Hannafin, Michael J. (2008). Decisions and reasons: examining preservice teacher decision-making through video self-analysis. Journal of Computing in Higher Education, 20(1), 62-94.
Roth, W. (2013). Data generation in the discovery sciences—learning from the practices in an advanced research laboratory. Research in Science Education, 43(4), 1617-1644.
Roth, W., Eijck, M., Hsu, P., Marshall, A., & Mazumder, A. (2009). What high school students learn during internships in biology laboratories? The American Biology Teacher, 71(8), 492-496.
Sahin, M. G., Teker, G. T., & Güler, N. (2016). An analysis of peer assessment through many facet Rasch Model. Journal of Education and Practice, 7(32), 172-181.
Semerci, Ç. (2011a). Mikro öğretim uygulamalarının çok-yüzeyli Rasch ölçme modeli ile analizi. Eğitim ve Bilim/Education and Science, 36(161), 14-25.
Semerci, Ç. (2011b). Doktora yeterlikler çerçevesinde öğretim üyesi, akran ve öz değerlendirmelerin Rasch ölçme modeliyle analizi. Eğitimde ve Psikolojide Ölçme ve Değerlendirme Dergisi, 2(2), 164-171.
Semerci, Ç., Semerci, N., & Duman, B. (2013). Analysis of seminar presentation performances of postgraduate students with many-facet rasch model. Sakarya Üniversitesi Eğitim Fakültesi Dergisi, 25, 7-22. Sherin, M. G., Linsenmeier, K. A., & van Es, E. A. (2009). Selecting video clips to promote mathematics
teachers' discussion of student thinking. Journal of Teacher Education, 60(3), 213-230.
Taylor, J., Roth, K., Wilson, C., Stuhlsatz, M., & Tipton, E. (2017). The effect of an analysis-of-practice videocase-based, teacher professional development program on elementary students' science achievement. Journal of Research on Educational Effectiveness, 10(2), 241-271.
Van Es, E. A., Tunney, J., Goldsmith, L. T., & Seago, N. (2014). A framework for the facilitation of teachers' analysis of video. Journal of Teacher Education, 65(4), 340-356.
Walker, J. P. & Sampson, V. (2013). Learning to argue and arguing to learn: Argument-driven inquiry as a way to help undergraduate chemistry students learn how to construct arguments and engage in argumentation during a laboratory course. J. Res. Sci. Teach., 50(5), 561–596.
Yılmaz, F., & Sözer, M. A. (2018). Examining the 4th
grade students‘ ability to say ―no‖ in the framework of life studies curriculum. International Journal of Assessment Tools in Education, 5(3), 443-460.
Author Information
Ahmet Volkan YuzuakBartın University
Science Education, Bartın, Turkey
Contact e-mail: [email protected]
Sinan Erten Hacettepe University
Science Education, Ankara, Turkey
Yılmaz Kara Bartın University