Feasibility of floating content service for context
aware applications
Shahzad Ali
Universidad Carlos III de Madrid Institute IMDEA Networks
Madrid, Spain Email: shahzad.ali@imdea.org
Abstract—Context aware applications encompass an ever-expanding set of applications that make use of a combination of restricted spatio-temporal locality and mobile communications to deliver a variety of services to the user. The communication requirements for such applications significantly differ from or-dinary applications and opportunistic communications can play a role for such applications because they naturally incorporate context.
In this work we chose to analyze the complex interplay between context information, communication technologies, and context aware applications, by studying the feasibility of a context aware communication service called floating content as a support for context aware mobile applications. In order to complement our performance study, we considered a specific context aware application belonging to family of ”social proximity sensing” which can be implemented via floating content.
We analyzed the suitability of the floating content technique for such an application, and analyzed the main performance bounds at the communication level by means of simulations. The analysis revealed that floating content service can be used only for the applications that are used in areas having high user density.
I. INTRODUCTION
The growth of mobile computing, and the pervasiveness of computing is progressively driving applications towards context awareness. That is, to make use of any piece of infor-mation related to conditions and circumstances of an event to which they have to respond, or of a user [1]. This enables them to improve their efficiency and utility, and to offer services that better suit the needs of users in a given situation. To do so, these apps do not operate only on the standard set of inputs, but they complement it with anything that can help giving a more satisfactory output. This complementary information can be the one made available from the great variety of sensors commonly present nowadays on mobile devices or in ”smart environments” [15], as well as potentially, from mining the huge amount of data that our notebooks or mobile devices make available about the user, its habits, its patterns of usage, its environment, etc.
These applications, which adapt their behavior according to changes in context are called ”context aware”. With prolifer-ation of mobile devices such as notebooks, PDAs, and smart phones, such applications are becoming increasingly popular, (examples: Google personalized search, foursquare, locus etc. The search results are adapted according to the current location of the user [2]. Context awareness is envisioned to play a key
role in future not only because it paves the way towards smart environments, adaptive applications, and customized response to the user, but it also allows to optimize the use of resources like user time, network bandwidth etc., by adapting it to environmental conditions and to the specific circumstances of application.
One of the best examples of context and one of the most commonly used variables for context aware applications is spatial and temporal locality. Locality plays an important role in a variety of applications. As an example, for a context aware parking finding application [13], information about a vacant parking spot may be valid for a limited time (until the space is filled) to an area in which the likelihood to find users interested in that piece of information is high. Similar context aware applications encompass an ever-expanding set of applications that make use of spatio-temporal locality and wireless communications to deliver a variety of services. By the end of 2010, there were more than100,000 applications developed for iPhone and about 10% of them employed localization technology [17]. It is expected that by year 2014 more than 1.5 billion people would be using applications based on local search (search restricted on the basis of spatio-temporal locality) [17]. It is expected that by year 2014, mobile location based services will drive revenues of more than$12.7
billion [16].
Our focus is on the communication aspect of context aware applications. Many context aware applications have commu-nication requirements that significantly differ from ordinary applications. There are a lot of location based context aware applications for which the scope of generated content itself is local. This locally relevant content may be of little concern to the rest of the world therefore moving this content from the user device to store it in a well-accessible centralized location and /or make this information available beyond its scope represents a clear waste of resources (connectivity, storage), and it may lead to the WORN (write-once, read never) problem.
the specific context information of the user. Hence the second role of context: for the same reasons that push applications towards context awareness, context information is used to adapt the communication services to the environment, in order to maximize their efficiency.
In this domain opportunistic communications play a special role. The benefit of using opportunistic communications is that they naturally incorporate context, as spatial proximity is not only associated to connectivity but also, at the application layer, to correlation at several levels between communicating peers, between their needs, interests, etc (the fact that they are in proximity of each other might be because they share interests and views: a same restaurant might mean same tastes for food, etc), and between users and the environment (this last correlation exists also in fixed networks, but there users don’t move, while mobile users do: hence the need to ”adapt” to the changing environment and to exploit information about it). Indeed, connectivity to the infrastructure is a prerequisite that is often limiting, due to its cost, capacity concerns, and especially for mobile users for whom using such applications may be problematic due to high roaming charges, unavailabil-ity of data services, or simply no network coverage.
In this work we chose to analyze the complex interplay between context information, communication technologies, and context aware applications, by studying the feasibility of a context aware communication service as a support for a context aware mobile application.
In an initial step, we categorize context aware applications from the point of view of their communication require-ments.Then we focus on a specific context aware communi-cation service, known as ”floating content” [2], conceived to support server-less distributed context aware applications. It is a fully distributed version of ephemeral content sharing, purely based on opportunistic communications. It aims at ensuring the availability of data within a certain geographic area, and for a given duration in time. This service assumes that a user (via a context aware application) issues a message that is of interest only for those users that are in a given region in space called anchor zone and within a given time interval. This message is spread using opportunistic communications. Whenever a node possessing a message comes within the transmission range of some other node not having that message, the message is replicated on that node if the two nodes are within the spatio-temporal limits of validity of the message. Otherwise, the transfer of the message does not take place: if a node possessing the message moves out of the spatio-temporal limits for that message, that node deletes the message as it is ”not anymore of interest”, at least according to the application that generated it.
Implementing such a floating content service without any fixed communication or storage infrastructure presents several challenges. As there is no fixed infrastructure available there-fore there is no guarantee that the content will always stay available within the specified geographic region. Information can disappear because may be there are not enough nodes for supporting the information to stay within that region. In
[2] some basic performance evaluation, through some models and simulations is presented. A strong open issue in the paper was the lack of a correlation between the primary performance parameters of the floating content service and the main design parameters. But there are a few interesting questions that still need to be addressed like how much anchor zone radius is enough in order to ensure that under a given density of nodes, the content would stay available with a high probability. Similarly for an application requiring a higher success rate i.e. all or a high percentage of nodes entering in the area should get the information (like emergency response); what is the impact of different parameters like node density, anchor zone radius? Selection of attributes like anchor zone radius is crucial and it is dependent upon the specific requirements of the application. The goal of our research is to see correlation between the primary performance parameters (success rate, availability) and investigate that how the main design parameters like node density and anchor zone radius etc affect the overall performance of the system in terms of lifetime, success rate, and availability. We analyze the main performance trade-offs at the communication level for this kind of service using extensive simulations.
In order to complement our performance study, we consid-ered a specific context aware application which could be implemented via floating content. Our aim is to analyze the suitability of the floating content technique for such an application, and to analyze the main performance bounds. Simulations revealed that for the baseline work on floating content, success rate and availability are dependent upon each other and for a lower density of nodes, a larger anchor zone radius is needed in order to achieve a higher success rate and availability. But when a context aware appliction was implemented on top of floating content service, it was observed that floating content mechanism can give a good performance in terms of success rate and availability only for high density of node (0.1 nodes per square meter). But for lower density of nodes, the success rate and availability remains low (below 40%) even for large anchor zone radii like 900 meters. More-over in presence of a realistic communication model, there is a tradeoff for broadcast interval. If the broadcast interval is too large then the performance starts to degrade due to not exchanging information between nodes even after coming into transmission range of each other. On the other hand if the broadcast interval is too short then the performance starts to degrade because of collisions and congestion collapse. An important conclusion that can be drawn from all these results is that floating content service can only be implemented for the applications that operate in areas having high user density like city centers, shopping malls, etc.
content service, and we analyze its performance numerically via simulations. In section 5 we discuss related work, and in section 6 we present our conclusions and propose directions for future investigation.
II. CONTEXT AWARE APPLICATIONS
Context can be any information that can be utilized in order to characterize the situation of an entity. An entity can be a person, place or an object that can be relevant between the interaction between user and the application [1]. Context aware applications are becoming the focus of application development where applications are specifically designed to react to constant changes in the environment. Location-aware applications constitute a major portion of context aware appli-cations. In near future we will see a whole different level of applications, where content will be brought to us by already knowing our location rather than we searching for content based on our location. Searching for information could also change entirely, showing us what information may be relevant to the user based on the current location of the user. Let’s have a look at a few context aware applications.
A. Examples of context aware applications
The existing context aware applications can be categorized into three groups [15]. The first group deals with intelligent
spaces in which the environment in which the user is in is
adapted according to the specific context. The second group aims at providing information to the user on the basis of current context of the user. The third category is represented by mobile context sharing applications.
1) Intelligent spaces: The work on intelligent spaces started back in early 90s. The first project was the Active Badge Project [18] which is considered as one of the first context aware systems. This system enabled people to be located in their offices by making use of active badges and on the basis of their current position calls were forwarded to the closest available phone. MIT’s Intelligent Room Project [19] aimed at improving the collaboration among people by providing a highly interactive environment. Stanford’s Inter-active Workspaces project [20] is also aimed to help people collaborate by making use of technology-rich spaces with computing and interaction devices on many different scales. The Aware Home Research Project [21] is an interdisciplinary research project at Georgia Tech whose aim is to create a smart home environment that keeps track of the activities and location of its occupants and on the basis of this information provides services for the residents to enhance their quality of life.
2) Providing information based on context: The
applica-tions belonging to this category aims at providing information to users depending upon the current context such as location. Tourist guides can be considered as a typical example of pro-viding information based on context. Cyberguide project [22] was one of the first projects that aimed at context-aware tour guide for mobile devices. Similarly, a series of such mobile tourist guides have recently been proposed, offering a wide
range of functionalities with respect to context-awareness. For a comprehensive comparison about such tourist guides the reader is referred to [23]. BlueAware [24], [25] is another interesting application that tries to match profile of users nearby through Bluetooth technology in order to push their face-to-face interaction between users who do not know each other but probably should, a concept very much similar to familiar stranger [31].
3) Mobile context sharing applications: FriendZone [26]
is an application that makes use of users current location in order to provide location-based community services like instant messenger, location-based chat, and location finder etc. In [27] a Java-based solution called iCAMS2 is proposed where the phonebook of a handheld phone shows the location of friends. The context-aware Instant Messaging System [28] focuses on communication based on context-aware messages in hospital. For example in case of a medical emergency, the nearest available doctor is sent a message to deal with it. There are a lot of other applications with a focus on localized content sharing among users [11].
B. Context aware applications and communications
Currently most of the context aware applications make use of infrastructure like cellular networks. But as discussed earlier that 3G networks are already overloaded and therefore it is important to search for communication modes that do not make use of infrastructure. Moreover, there are many location-aware applications for which relying on infrastructure may be undesirable due to following reasons [2], [6].
• Information that is spatially or geographically restricted
will be less relevant to the rest of the world; therefore storing this information to some central server may not be a very good option.
• Information that is ephemeral i.e. is valid for a short time,
then storing that information centrally leads to a well known problem called WORN, write-once, read never.
• If connection to the infrastructure becomes a prerequisite
for location aware applications then it can be sometimes limiting, particularly for traveling users who may face high roaming charges, unavailability of data services, or simply no network coverage.
• Some issues related to privacy may also arise particularly
when such information is stored centrally.
All the above requirements leads to take into consideration a fully distributed version of ephemeral content sharing that is purely based on opportunistic communications in order to ensure the availability of data within a certain geographic area. Use of pure opportunistic ad-hoc communications relieves the user from the need for using infrastructure and in this way it leads to decrease in load on infrastructure.
C. Performance evaluation of context aware applications
In the present section we analyze those features of a context aware application that impact their performance. We group these features into three classes:
• Application Specific
• Environment Specific
• Communication Specific
1) Application Specific: Application specific characteristics are dependent upon the particular functionality for which an application is built for. Such characteristics are specified at the application level.
Delay tolerance: Delay can be defined as the time
difference between the request made by some user and the response received, or the delay between the occurrence of an event, and its notification. Delay tolerance represents the amount of delay an application can tolerate without experiencing a performance degradation. Different applications have different requirements regarding delay. Applications can be categorized into either delay tolerant applications or delay sensitive.
Rate of requests:Rate of requests defines the number of times a client requests for some information from a source in the networks in a given time interval. Rate of requests is highly dependent upon the specific characteristics of the application. For instance if the information itself is not changing rapidly then it makes sense to ask for information less often as compared to the case when information is changing rapidly. Rate of requests also depend how much up to date (fresh) the information is needed.
Rate of events/updates: Rate of events/updates describes how many times a particular event or update that is to be notified to users occurs in the network. These events or updates occur at the sources of the information and it is notified to the users.
2) Environment Specific Characteristics: The following
characteristics depend on the particular environment in which an application operates.
Spatial distribution of the sources and consumers of the
information: Sources of information are the nodes having
information requested by some other nodes in the network on the other hand consumers of information are the nodes that request some information from the sources because they need that information to perform some actions. Spatial distribution of sources and consumers means that how are the sources and consumers of information distributed in the network spatially.
Rarity of information: Rarity of information describes
the density of sources of information within the network. In other words it is the ratio of the sources of the information to the total nodes in the network.
Density of Consumers: Density of consumers can be
defined as the number of users requesting particular piece of information per unit surface in the network.
3) Communication Specific characteristics: The
following characteristics depend on the way an application communicates with other nodes or infrastructure in the networks for its successful operation.
Push/Pull Mode: In Push mode, data items are sent out to the clients without explicit requests. On the contrary, with pull data items are sent in response to explicit requests received from clients. In push mode the sources of information sends information towards the requesters of information who subscribe for particular information or updates and whenever the sources of information have some information or updates to send then they forward this information to the consumers. Both of these terminologies can be better explained by set of examples. In case of pull mode we can imagine devices within the network explicitly requesting for particular information that is available within the network. An example can be a user wanting to know about the restaurants within a certain range or searching for some doctors in case of emergency etc. On the other hand in case of push mode the information is sent to the user without explicit request by the user. An example can be users updated periodically updated about the scores of a football game going on or sending the user with the information regarding trains departure times near the vicinity of the user.
Pure relaying vs processing at the node: Nodes can act
as pure relays or there can be some nodes in the network having additional processing or intelligence capabilities, which process the information they receive before deciding if and what to send. This is similar to compressed sensing, for instance, as the elaboration can be used to improve the efficiency of the communication, for instance by decreasing the delay of the response or by decreasing the number of transmissions necessary to get the information to the requesting node.
Caching/Replication: It is possible Nodes might store
information that they forward, so that subsequent requests for the same info will be satisfied directly by the caching node, globally decreasing the traffic generated into the network by a request for some information.
III. FLOATING CONTENT SERVICE
user from relying on fixed infrastructure. Such service is very handy for the applications that make use of information having a local scope. Similarly as it also enables the user to access the services without being connected to some 3G networks therefore traveling users who normally have to pay a lot of roaming charges can also benefit from applications built on top of floating content service.
When a user creates content he defines the geographic region referred to as anchor zone along with the expiration time for that content referred to as time to live. We call the creator of content as seeder. Seeder starts disseminating the content to all the nodes that come in its transmission range, and similarly this content is copied by those nodes to other nodes within the anchor zone. As long as there are enough supporting nodes within the anchor zone to replicate the content, the content stays within the anchor zone or floats. When the number of supporting nodes becomes too low then the content disappears or sinks from the anchor zone. In the sections below we will have detailed look at floating content concept.
A. Assumptions
For our analysis, these are the settings that we are consid-ering for the floating content service:
• There is no supporting infrastructure available and nodes
use pure ad hoc mode for communications and each device uses wireless interfaces (WLAN or Bluetooth);
• All the nodes in the network are mobile.
• Each content item has an anchor zone associated with it.
An anchor zone is a circular area having a center point and a radius as shown in figure 1.
• A node must be present within the anchor zone for
gener-ating a content associated with that particular geographic area (anchor zone).
• All the nodes in the system must be location aware, i.e.,
either they are equipped with GPS or they use some other techniques like triangulation based methods using Access Points or cellular base stations.
B. System operation
The basic concept behind floating content is as follows. A node generates an information item and assigns a parameters referred to as Time To Live (TTL) and an anchor zone with its current location as its center and two different radii, referred to as r and a. r is referred to as replication range and a is referred to as availability range as shown in figure figure 1. If two nodes X and Y meet within r and suppose that X has the information and Y does not, then information will be replicated on Y with a probability of 1. No replication or deletion takes place if nodes are outside anchor zone and inside availability radius. Therefore availability radius acts like a buffer zone, just in case a node moves out of anchor zone momentarily and then return. A node deletes the information if it goes outside availability radius. In the figure figure 1 the blue circles represents the nodes having content and the yellow
Fig. 1. Anchor zone and availability radius.
circles represents the nodes not having the content. The anchor zone radius is represented by a circle having a radius of r and availability radius is represented by a.
During the operation of floating content two different radii, r and a, are defined. If we consider an anchor zone centered at point P and let d be the distance of a given node from center point P. Now if a node X having the information meets some other node Y not having the information then this information is replicated according to following equation:
Pr(h) =
1 d≤r
R(h) r < d≤a
0 otherwise
(1)
For evaluating criticality condition, the authors in [6] have assumed that if the node is in availability radius i.e.r < p≤a, no replication or deletion takes place thereforeR(h) = 0 , so availability range acts as a buffer zone in which contents are neither replicated nor deleted. Content are deleted if a node moves outside the availability radius and it is reflected in the equation below.
Pd(h) =
1 d≤r
D(h) r < d≤a
0 otherwise
(2)
C. Criticality Condition
that a node spends within an anchor zone.
ην
µ >1 (3)
In the fraction aboveηis the average numbers of nodes in the anchor zone, ν is the average contact rate an ordinary node experiences during its sojourn time in an anchor zone, and
µ is the average sojourn time that a node spends within an anchor zone. The fraction on the left hand side in the above inequality is the average number of successful encounters a randomly chosen node experiences during its sojourn time. The criticality equation reveals that the average number of encounters for a node during the sojourn time should be greater than 1 in order to ensure the content to float with a high probability. If this value is less than 1 then information is very likely to be lost , and to float for very short time. The authors present an analytical model which, for the sake of tractability, rely on an set of assumptions which oversimplify the system model. And their simulations only aim at validating the model rather than assessing at the validity of the service.
In the section below, we present the simulations that we did in order to understand floating content and investigated some new parameters that can play a vital role for such a system.
D. Simulation setup
For all the simulations OMNeT++ based framework called INET is used [30]. The INET framework is an open-source communication networks simulation package for the OM-NeT++ simulation environment. Nodes are distributed in the network using uniform distribution over an area of3000×3000
meters. We indicate withλ the intensity of the point process. Moreover, at the center of the area, a special node called ”seeder” is present, which generates the message that will float.
1) Mobility model: We assume nodes move in the area
according to the Random Waypoint Mobility Model, with an average wait time of0(i.e. nodes never stop) and with speeds falling within a given range (1−21m/s in our simulations). The reason for selecting this speed range is to model pedestri-ans as well as fast moving vehicles. The reason for choosing the Random Waypoint Mobility Model is its simplicity. More realistic mobility models will be used for future evaluation.
2) Information exchange mechanism: At the beginning of
the simulation, at time t=0, the seeder is the only present at the center of anchor zone node possessing the information to exchange. That information is exchanged every time two or more nodes come in transmission range of each other. All nodes have the same transmission range. It means that whenever two nodes come in transmission range of each other, a direct and dedicated communication link is established, through which they exchange information. We initially assume infinite bandwidth, and we later analyze the effect of finite bandwidth. It is also assumed that for communication no broadcast messages are used and there is no contention scheme
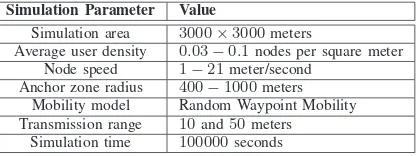
TABLE I SIMULATION PARAMETERS
Simulation Parameter Value
Simulation area 3000×3000meters
Average user density 0.03−0.1nodes per square meter Node speed 1−21meter/second
Anchor zone radius 400−1000meters
Mobility model Random Waypoint Mobility Transmission range 10and50meters
Simulation time 100000seconds
like CSMA present and there are no collisions in the system. Table I summarizes the simulation parameters.
E. Performance evaluation
The objective of such a system is to deliver the information to every node entering in the anchor zone, as soon as possible (as we imagine that in, general, the information is needed to perform some action in the considered area). For example in case of a medical emergency, if there is an accident and a doctor is needed urgently then information about accident is propagated within a certain geographic region so that a doctor that is available nearby can reach the place where accident happened.
1) Performance parameters: The following are the
perfor-mance parameters used for evaluating the global perforperfor-mance of the floating content service.
• Average Success rate: It is the average percentage of
times a node entering the anchor zone gets the content. It is dependent upon the number of nodes within the anchor zone having the information, contact rate, and the anchor zone radius. This is the primary performance parameter: the higher it is the better.
• Availability: Availability is defined as the percentage of
nodes within the anchor zone having the information at a given time. It influences the success rate and it depends upon contact rate and anchor zone radius. For some kind of applications, we would ideally like all the people in the anchor zone to possess the info, as soon as they enter it.
• Average Lifetime: It is defined as the average amount of
time for which information stays available (floats) within the anchor zone. Lifetime of the information is the time interval from the generation of the message within the anchor zone until the last node having information leaves the anchor zone.
• Mean useful contacts:It is the average number of
Moreover, there are some other parameters of the system that we observe in our simulation and which, despite not being directly tied to performance as perceived from the application using the service, help us understanding the behavior of the system.
• Mean sojourn time: It is a mean time that a node spends
in the anchor zone. Mean sojourn time depends on the anchor zone radius and characteristics of mobility model.
• Average Contact rate: Average contact rate is defined as
the frequency at which two nodes in the network come in contact with each other during the whole simulation time. It is dependent upon the characteristic of the mobility model and the intensity of the point process.
• Average number of nodes in the anchor zone: It is
the average number of nodes present in the anchor zone over the simulation time. It is dependent upon the size of anchor zone and the intensity of the point process.
• Average Contact duration:It is the average duration of
the time interval during which two nodes stay in trans-mission range of each other. It depends on characteristics of the mobility model and on the transmission range of nodes.
F. Simulation results
Figure 2 shows mean useful contacts with respect to dif-ferent node densities under difdif-ferent anchor zone radii. It is evident from the figure that the value of mean useful contacts increases with increase in both node density and anchor zone radius, as expected. Indeed, an increase in anchor zone radius increases average number of nodes within the anchor zone and mean sojourn time, resulting in increase in mean useful contacts. On the other hand increase in node density increases both encounter rate and average number of nodes within the anchor zone.
In [2] it is proven that the value of mean useful contacts greater than 1 is an indication that content will float within the anchor zone. It can be seen from the figure that for smaller anchor zone radii, a higher density of nodes is required in order to achieve a value of criticality greater than 1, but on the contrary for larger anchor zone radii, lower density of nodes yield value of mean useful contacts greater than 1. In general, content floats if the chance of meeting at least once a node with the content inside the anchor zone is ”high enough”. Therefore it can be concluded from figure 2 that for achieving a high probability for a piece of content to stay available in the anchor zone, a larger anchor zone radius is required in case of lower density of node. But on the other hand of node density is on the higher side then lower anchor zone radius can be used. Figure 2 suggests that the total surface of anchor zone and node density can be used interchangeably to bring the mean contact rate to a given target value. The impression is that the mean contact rate depends essentially on the average number of nodes in the anchor zone. Figure 3 shows the success rate with respect to anchor zone radii under different average number of nodes present in the anchor zone. The node density used was from 0.033to0.1nodes per square meter in0.017
400 500 600 700 800 900 1000
0 1 2 3 4 5 6 7 8 9 10
Anchor zone radius (meters)
M
e
a
n
u
s
e
fu
l
c
o
n
ta
c
ts
0.033 nodes per meter square 0.066 nodes per meter square 0.1 nodes per meter square
Fig. 2. Mean useful contacts with respect to different node densities.
0 20 40 60 80 100 120 140 160 180
20 30 40 50 60 70 80 90 100
Average number of nodes in anchor zone
S
u
c
c
e
s
s
r
a
te
400m 600m 800m 1000m
Fig. 3. Success rate with respect to average number of nodes in anchor zone.
0.033 0.05 0.066 0.083 0.1 10
20 30 40 50 60 70 80 90 100
Node density
S
u
c
c
e
s
s
r
a
te
400m 600m 800m 1000m
Fig. 4. Success rate with respect to different anchor zone radii.
0.033 0.05 0.066 0.083 0.1
20 30 40 50 60 70 80 90 100
Node density
S
u
c
c
e
s
s
r
a
te
400m 500m 600m 700m 800m 900m 1000m
Fig. 5. Success rate with respect to different anchor zone radii.
important to adjust the anchor zone radius accordingly because increase in anchor zone increases the replication radius that may result in degrading of system performance particularly when a realistic communication model is considered due to the increase of the traffic load. Figure 5 reveals that for a higher density of nodes like 0.083−0.1 nodes per square meter, anchor zone radius of 500mis enough for achieving a success rate of90%; therefore increase of anchor zone radius beyond 500m in case of such node density results in waste of resources without any considerable improvement in success rate and in general, an anchor zone of 600 to 800 meters is enough to get 90% of success rate for the node density considered. But when we considered the dating service and evaluated the performance using a realistic communication model (section IV), we observed that it is not possible to achieve 90% performance even for anchor zone radius upto 900 meters.
Figure 6 shows success rate with respect to different node densities under different anchor zone radii. Figure 6 reveals some interesting results because for a given density of nodes, a user can specify the anchor zone radii accordingly in order to achieve a certain success percentage. For instance if the
400 500 600 700 800 900 1000
10 20 30 40 50 60 70 80 90 100
Anchor zone radius (meters)
S
u
c
c
e
s
s
r
a
te
0.033 nodes per square meter 0.05 nodes per square meter 0.067 nodes per square meter 0.083 nodes per square meter 0.1 nodes per square meter
Fig. 6. Success rate with respect to different node densities.
400 500 600 700 800 900 1000
20 30 40 50 60 70 80 90
Anchor zone radius (meters)
A
v
a
ila
b
ili
ty
0.033 nodes per square meter 0.05 nodes per square meter 0.067 nodes per square meter 0.083 nodes per square meter 0.1 nodes per square meter
Fig. 7. Availability with respect to node densities.
density of users is low (0.05nodes per square meter) and if the user wants to have a success rate of90%, then the desirable anchor zone radius should be greater than 900 meters. On the other hand if the node density is on the higher side (0.1
nodes per square meter) then for achieving a success rate of
0.033 0.05 0.066 0.083 0.1 20
30 40 50 60 70 80 90 100
Node density
P
e
rc
e
n
ta
g
e
400m Availability 400m Success rate
Fig. 8. Availability and success rate for400m anchor zone radius
0.04 0.05 0.06 0.07 0.08 0.09 0.1
40 50 60 70 80 90 100
Node density
P
e
rc
e
n
ta
g
e
Availability 500m Availability 700m Availability 900m Success rate 500m Success rate 700m Success rate 900m
Fig. 9. Availability and success rate for different anchor zone radii
the content but as the anchor zone radius is small therefore a new node entering in the anchor zone may not be able to find a node to get the content. As a result success rate is lower than availability. But for larger anchor zone radii (figure 9), the success rate is correlated with availability and increase in availability also results in increase in success rate. The reason behind this is that the number of nodes within the anchor zone having information at any instant of time impacts directly tagging of new nodes with information entering in the anchor zone.
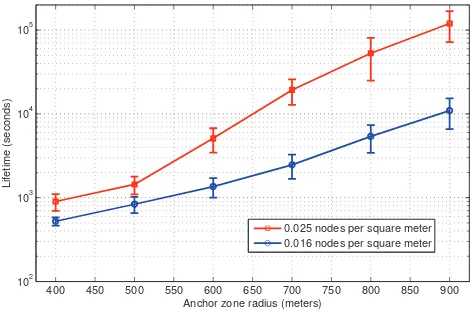
Finally, figure 10 shows lifetime with respect to different node density under different anchor zone radius. Lifetime is represented in Logarithmic scale. Increase in both anchor zone radius and node density results in increase in life time. The reason behind this is that increase in anchor zone radius increases the probability of the content to stay in the anchor zone because it improves both success rate and availability of content (see figures 6 and 7). Similarly increase in node density also improves lifetime because both success rate and availability are directly proportional to node density. The net result is that if it is desired to increase the lifetime of information for a given density of node, then anchor zone
400 450 500 550 600 650 700 750 800 850 900 102
103 104 105
Anchor zone radius (meters)
L
if
e
ti
m
e
(
s
e
c
o
n
d
s
)
0.025 nodes per square meter 0.016 nodes per square meter
Fig. 10. Lifetime with respect to node density
radius should be increased.
IV. ACONTEXT AWARE APPLICATION ON FLOATING CONTENT: SITUATED INTRODUCTIONS
In order to complement our performance study, we con-sidered a specific context aware application called situated introductions which can be implemented via floating content. Our aim is to analyze the suitability of the floating content technique for such an application, and to analyze the main performance bounds. The application we consider presents the user with a list of people who are within a given range of the user and who are interested in dating or friendship. A review of similar applications based on social proximity sensing is presented in [?], but all of these applications make use of wireless proximity rather than floating content. Range Of Interest (ROI) is defined as the range for which a user is interested in finding and meeting with people. As we consider scenarios where users move, whenever a new user arrives within the ROI of the considered user, this event is notified, and the data about the new user appears on the list in the application for the considered user. The user may use this list to contact one of the people in the list, either via phone/SMS/chatting, or by meeting them by person. The higher this value, the higher the efficiency with which the application senses the presence of potential peers around the user.
We discard in this phase of this work issues related to privacy, assuming also that all users involved agree to share information about them including the one concerning their location.
for unique identification of nodes. Maximum age specifies that how long should information about the node should stay in the network. Current position is used for calculating the distance among nodes in order to avoid the information of a node go outside its anchor zone radius. Birth time is defined as the time at which information about a particular node was generated. The major difference between anchor zone radius and ROI is that ROI helps to filter the results displayed to the user at application level. On the other hand, anchor zone radius plays an important role in determining the survivability of information about a user because it is the range over which information about a particular uses is disseminated and as the application is using pure opportunistic communication therefore for lower density of nodes it may be possible that information about a certain node does not survive because anchor zone radius is too small and there are not enough nodes around to carry and forward that information. When a node receives a peer list, it checks to see what entries should be added or updated. If the list contains an entry for which the distance between the current node and the node position in that entry is greater than anchor zone radius then that entry is not entered into the peer list. Similarly entries for which the maximum age has expired are also deleted. As perceived from the description of the service, two important aspects of the information displayed to users are:
• ROI: it is the maximum distance from the user that a
peer in the list can be. In any case, it is short enough for peers to consider meeting in person without significantly deviating from their path.
• Freshness of the information:the list of people within
the ROI of a user is updated (ideally) as soon as someone gets in ROI or entry get too old. In practice, we assume that there is a maximum age for each entry in the list, computed from the time the information has been gener-ated. Every time an entry gets older than the maximum age, it expires and it is deleted from the list, unless it is updated with more recent information about that same person. For this specific service, in our implementation we assume that the maximum age of messages is equal to 20 minutes (the average amount of time we expect users to be in a given neighborhood).
We assume that users move at a speed between 0.1 and 1.5 meters per second. This is because we assume users who are moving by cars or other fast means are not suitable users for the considered service. The wireless communication technology used is IEEE 802.11. The ROI is 300 meters for all the nodes.
The open issues for implementing such a service are: 1. How does success rate depend on: (1) Node density, (2) Anchor zone radius, and (3) Broadcast interval?
2. How many users per unit area can be supported by such an application, with a given minimum success rate? How does this maximum node density depends on anchor zone radius and broadcast interval.
3. For a given message ROI, what is the optimal anchor zone radius? That is, how does success rate (application level), for
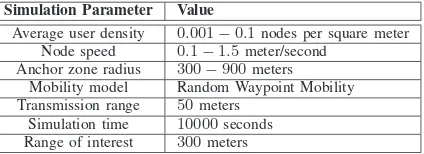
TABLE II SIMULATION PARAMETERS
Simulation Parameter Value
Average user density 0.001−0.1nodes per square meter
Node speed 0.1−1.5meter/second Anchor zone radius 300−900meters
Mobility model Random Waypoint Mobility Transmission range 50meters
Simulation time 10000seconds
Range of interest 300meters
a given range, increase with anchor zone radius and broadcast interval.
A. Simulation setup
For all the simulations OMNeT++ based framework called INET is used [30]. For implementation of dating service based on floating content the following model is used. Nodes are distributed in the network using uniform distribution. INET framework provides an implementation of 802.11b MAC and Physical layer and we have used both of these layers for evaluating the performance of the proposed service. At the 802.11 MAC layer, contention scheme CSMA/CA without RTS and CTS is used and at the physical layer parameters like path loss, fading, interference and noise have been taken into account. For more details about 802.11 MAC and Phys-ical layer implementation for INET framework the reader is referred to [29].
1) Information exchange mechanism: This considered
ap-plication is purely based on opportunistic ad hoc communi-cations therefore nodes can only exchange information when they are in transmission range of each other. Each node main-tains a list called peer list containing information about all the nodes that it knows that are present within its ROI. Each node periodically sends broadcast messages containing the peer list and the peer lists are exchanged and updated according to the received peer lists from other nodes. Anchor zone radius is used to restrict the replication range for users. It means that when a node receives a list containing an entry for a node and realizes that it is out of anchor zone radius, so that node simply discards that entry. If a node has an entry in its list, it uses the age attribute for deleting that entry. So in this way old entries are deleted from peer list. As the communication medium is shared therefore there are possibilities for packet loss due to congestion and collisions. In the absence of any infrastructure we are interested in evaluating the performance of dating service, and for evaluating the performance we have used the following simulation parameters as explained in table II.
2) Mobility model: We assume nodes move in the area
B. Performance Evaluation
The objective of such an application is to display to the user information about (ideally, all) users that enter in his/her ROI. As this application is based on pure opportunistic com-munications therefore there is no guarantee that the new user entering in ROI will be updated in the peer list.
1) Performance parameters: We evaluate the performance
of such an application in terms of following performance parameters.
• Average Success rate:One of the main performance
pa-rameters at the application level is the average percentage of times that a user within the ROI of a node is inserted in the list.
• Availability: Availability is defined as the average
per-centage of nodes within the ROI of a given node having recent information about that node in their peer lists. It influences the success rate and it depends upon node density, ROI, and anchor zone radius.
C. Simulation results
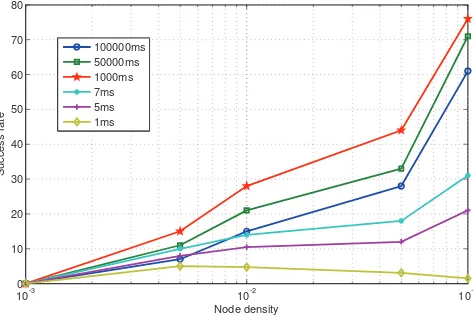
For all the simulation results below, we have run the simulations long enough to to achieve confidence interval of 95% and remove transients. We also kept border effects out of our results by excluding the results from border areas. Figure 11 shows success rate with respect to different broad-cast intervals under different node densities. It is evident from the figure that the success rate increases as the node density increases. An interesting thing to note is that highest values for success rate are achieved for broadcast interval of 1 second. But if broadcast interval is increased to 50 seconds and 100 seconds respectively, a decrease in success rate is observed. The major reason behind this is that for higher values of broadcast interval, the probability of two nodes coming in range of each other and not sending broadcast message increases because the duration of the encounter is comparable with broadcast period. Figure 13 gives a good indication about the contact duration for nodes. So for a broadcast interval of 50 seconds, for the contacts having a duration of less than 50 second would not be useful because the chances that this exchange will take place between the nodes are low. And this results in decrease in success rate because some of the nodes entering within a node‘s ROI will not be detected. For lower broadcast intervals like 7 to 1 milliseconds, increase of frame collisions for Wi-Fi leading to congestion collapse is the main reason for low success rate.
Figure 12 shows the success rate with respect to different broadcast intervals. The node density is 0.1 nodes per square meter. It can be seen from the figure that success rate remains the same for broadcast interval between 10 milliseconds and 1000 milliseconds. The reason behind this is that during this broadcast interval, neither congestion collapse nor misses due to no broadcast messages during contact time are present. For broadcast interval of less than 10 milliseconds, packet loss due to collisions and congestion collapse starts to degrade the performance in terms of success rate. On the other hand
10-3 10-2 10-1
0 10 20 30 40 50 60 70 80
Node density
S
u
c
c
e
s
s
r
a
te
100000ms 50000ms 1000ms 7ms 5ms 1ms
Fig. 11. Success rate with respect to different broadcast intervals.
100 101 102 103 104 105
0 10 20 30 40 50 60 70 80
Broadcast interval (milliseconds)
S
u
c
c
e
s
s
r
a
te
0.1 nodes per square meter
Fig. 12. Success rate with respect to 0.1 nodes per square meter.
for broadcast interval greater than 50 seconds, nodes failing to exchange broadcast messages during contact duration due to large broadcast interval are the major reason for reduction in success rate. During our evaluation, it was assumed that the exchanged information among nodes was small and the transmission time was about half a millisecond and the optimal broadcast period was about 1 second. Now for exchange of larger information which can be 1000 times larger than the ones considered, we should start to see success rate decrease even at optimal broadcast rate, as collisions and misses would be present at the same time. This means that for a service which sends large objects with list entries (like a profile picture and some text) the performance in terms of success rate will decrease.
Figure 13 shows a histogram about the contact durations. The average contact duration is 94 seconds with a standard deviation of 25. This figure gives us an indication that how can broadcast interval be set in order to avoid the situations in which two nodes come in transmission range of each other but do not exchange any information because the broadcast interval is too high.
50 60 70 80 90 100 110 120 130 140 150 160 170 0
10 20 30 40 50 60
Contact duration (seconds)
F
re
q
u
e
n
c
y
Fig. 13. Contact durations.
zone radii for different node densities. The anchor zone radius and ROI for this case were kept the same. It can be seen from the figure that there is a gradual decrease in success rate when the anchor zone radius is increased. The major reason behind this is that increase in anchor zone radius also increases the area of interest, and as a result the probability for detecting a node entering in the ROI decreases. As the result the average percentage of nodes detected while entering within a nodes ROI decreases.
300 400 500 600 700 800 900 1000
0 10 20 30 40 50 60 70 80
Anchor zone radii (meters)
S
u
c
c
e
s
s
r
a
te
0.1 nodes per square meter 0.05 nodes per square meter 0.01 nodes per square meter
Fig. 14. Success rate with respect to different anchor zone radii with ROI=anchor zone radius.
Figure 15 shows success rate with respect to different anchor zone radii under different node densities with a broadcast interval of 1 second. The ROI for this graph was set to 300 meters and the anchor zone radius was varied from 300 to 900 meters in order to investigate the effect on success rate. Increase in anchor zone radius improves success rate, particularly for lower density of nodes. But on the downside, increase in anchor zone results in increase in network traffic. The reason behind this is increase in anchor zone radius also increases the replication radius and every node in this radius will be required to copy and further propagate that information leading to congestion and congestion collapse.
10-3 10-2 10-1
0 10 20 30 40 50 60 70 80 90
Node density
S
u
c
c
e
s
s
r
a
te
300m 500m 700m 900m
Fig. 15. Success rate with respect to different anchor zone radii.
Still it is evident from the figure that the success rate remains low for lower densities of nodes. So one thing that can be concluded is that the considered dating service can give reasonable success rate only in the areas having high node densities like city centers, famous tourist spots etc.
10-3 10-2 10-1
0 10 20 30 40 50 60
Node density
A
v
a
ila
b
ili
ty
300m 500m 700m 900m
Fig. 16. Availability with respect to different anchor zone radii.
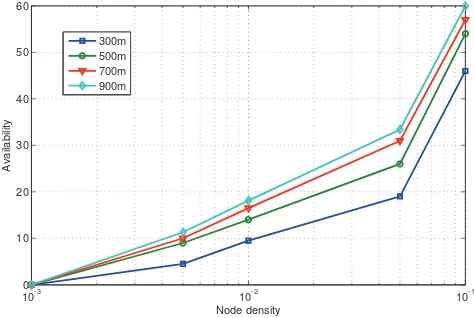
Figure 16 shows availability with respect to different anchor zone radii under different node densities. The ROI for this graph was set to 300 meters and the anchor zone radius was varied from 300 to 900 meters. Increase in anchor zone radius improves availability. The major reason behind this is increase in anchor zone radius increases the chances of information to stay longer in the network and therefore increases the chances for the nodes entering in the ROI of a node to know about that node.
10-3 10-2 10-1 0
5 10 15 20 25 30 35 40 45 50
Node density
A
v
a
ila
b
ili
ty
100000ms 50000ms 1000ms 7ms 5ms 1ms
Fig. 17. Availability with respect to different broadcast intervals.
interval is increased to 50 seconds and 100 seconds, a decrease in availability is observed. The major reason behind this is that for higher values of broadcast interval the probability of two nodes coming in range of each other and not receiving broadcast message increases. therefore this results in decrease in availability because some of the nodes entering within a node‘s ROI will not be able to know all the nodes in ROI. For lower broadcast intervals like 7 to 1 milliseconds, congestion collapse is the main reason for low availability.
From these simulation results, we observed that the success rate and availability achieved while considering a particular application under a realistic communication model are lower in comparison to the evaluations of the baseline work in section III. Even if we keep the effects of using a realistic communication model out of the picture, reasonable success rate (around 90%) can only be achieved for very high density of nodes (0.1 nodes per square meter) under larger anchor zone radius (900 meters). For a lower density of nodes (between 0.01-0.05 nodes per square meter), even if we use larger anchor zone radii, the performance of the considered application in terms of success rate is poor (below 35%). If we consider applications that need to exchange information having large size, then the performance in terms of success rate will be worse due to nature of shared medium (collisions and congestion) and contact duration being not enough for whole information exchange.
V. RELATED WORK
Popular content sharing websites like Facebook, Youtube, Twitter etc have experienced phenomenal growth over past few years and therefore they constitute a major portion of internet traffic [2]. Mostly people use their mobile/smart phones to access such social networking sites and connect with people. Moreover devices like smart-phones and PDAs have enabled users to dynamically produce content like pictures and videos resulting in generation of unprecedented amounts of data. Therefore a side effect of it is that cellular networks are currently overloaded leading to deteriorating 3G quality. Ac-cording to AT&T’s media newsroom, its network experienced
a5,000percent increase of mobile data traffic in the past three years [3]. In big cities users are experiencing deteriorating 3G quality because the network cannot cope with the high demand [3]. As a result, cellular network operators like AT&T, T-Mobile, Vodafone, and Orange are already using several data offloading solutions to Wi-Fi networks. A few other efforts to reduce traffic from cellular networks include the Line2 iPhone application that can be used to initiate voice calls over Wi-Fi networks. Recently in [4] authors have proposed a scheme called Wiffler. In this approach the authors tried to exploit the delay tolerance of the applications and use Wi-Fi for the applications that can tolerate delay leading to reducing load from 3G networks. Most of the wireless providers using different methods like imposing a data limit per month [5] or offloading data traffic to Wi-Fi networks are a clear indication that existing network operators cannot cope with high demand of the user therefore there is a need to explore other modes of communication like ad hoc opportunistic communications. The concept of floating content is not new and concepts similar to it have appeared in the literature with different names. In [7] concept called wireless ad-hoc podcasting is proposed. It uses a combination of fixed infrastructure (access points) and mobile nodes using ad hoc mode. In the first step each access point fetches content from podcast servers across the Internet and forwards them to mobile nodes within its transmission range. In the second step, a mobile node that has contents to share might provide data to another mobile node when they pass within radio range of one another by using opportunistic communication. The difference in concept as compared to floating content is that for floating content concept, the fixed infrastructure is not present at all and it relies on pure opportunistic communications for spreading of information. In the floating content concept content is restricted geographically. Moreover the content itself has an expiration time referred to as Time to Live, after which content is removed from the network.
In [8] an opportunistic spatio-temporal dissemination system for vehicular networks is proposed. The major innovation was introducing the publish/subscribe communication paradigms to opportunistically disseminate restricted spatio-temporal infor-mation in vehicular networks. The subscription inforinfor-mation is used to filter and disseminate the events to only the interested nodes. They also utilized the specific characteristics of vehicular networks in order to disseminate information more efficiently. But this work was purely based on vehicular networks.
hovering information in a geographical area. But this work focuses on algorithmic perspective in order to ensure the information availability while our focus is to evaluate the floating content concept so that efficient algorithms can be developed in order to ensure a certain level of availability of content within a certain geographic area.
In [12] the authors have proposed a middleware architecture that makes use of access points and opportunistic communi-cations for distribution of content. They have also proposed a method to structure the contents in order to facilitate efficient lookup matching particularly suitable for delay tolerant net-works having disruptive node connectivity. They also proposed a solicitation protocol by using which a node can use content meta-information in order to discover contents in its vicinity and can download content entries from multiple disjoint nodes. In the end they provide an API that can be used to access the system services through a publish/subscribe interface. In [13], authors investigated the storage capability, a concept very much similar to floating content in VANETs by consider-ing real traffic traces of San Francisco Yellow Cabs. Authors defined storage lifetime as the amount of time for which information stays available within the network and concluded that for one way highway traffic, the transmission range has a high impact on storage lifetime. On the other hand for two way highway traffic, the size of geographic region in which we want to disseminate information plays a key role in information lifetime. In [14], authors have introduced a system called as Locus. Locus also makes use of concept similar to floating content but the difference is the mechanism to access this information. Locus allows remote nodes to query for certain data and the querying node does not need to be present in the anchor zone. So this property makes it different as compared to our focus.
In [6], authors introduced the concept of floating content and provided an analytical model for analyzing the feasibility of floating content concept. The authors in [6] came up with a condition called as criticality condition that can guarantee the availability of information within the anchor zone with a high probability and a notion of information not getting lost. In order to evaluate criticality condition required for the feasibility of content to float, three key parameters are identified. The average numbers of nodes in the anchor zone, average contact rate an ordinary node experiences during its sojourn time in an anchor zone, and the average sojourn time that a node spends within an anchor zone.
In [2] authors validated the analytical results presented in [6] by doing extensive simulations and showed that criticality con-dition behaves well and floating content is feasible even when there are modest number of nodes available in the network. The three identified parameters play a vital role in determining the feasibility of floating content but there are some other factors too that should be taken into account. In an ideal setting the criticality condition can determine the feasibility of the content to float but if a realistic communication model is considered then it is possible that the content does not float even if the above condition is satisfied. For example higher
density of nodes means a higher value of criticality, but as opportunistic communications are based on a shared medium therefore if we increase the node density may cause some performance problems like packet loss, collisions etc, so it is very important to explore such a system by considering a realistic communication model. Particularly in the case when there are multiple data objects present in the network then by considering a realistic communication model it may be possible that two nodes come in range of each other but they are not able to fully exchange content. So the criticality condition would not hold in presence of multiple data objects. Moreover the most recent work [6] focus on the lifetime and floating probability of a floating content system but they do not answer the questions that if we intend to design such a system then how can different system parameters be adjusted in order to get the desired performance like success rate, availability, success rate etc.
VI. CONCLUSIONS
Floating content provides interesting opportunities for many location aware applications but it also exhibit notable chal-lenges due to lack of infrastructure support. During the initial phase of our research, our aim was to explore the floating content further and investigate some parameters that can affect the information availability in a geographic region using pure opportunistic communications. We explored that how different system parameters like anchor zone radius, node density affect the performance of the system in terms of success rate, availability, and lifetime. We showed via extensive set of simulations how these parameters are correlated to each other and how they can be adjusted in order to get desired performance targets? Simulations have revealed that we can tune parameters like anchor zone radius in order to achieve high success rate (arbitrarily close to 100%).
During the second phase of our research, we analyzed the suitability of the floating content mechanism to implement the situated introductions service. A realistic communication model (802.11b) was used for evaluating the performance of floating content mechanism for such a service. It was observed that for such a service, floating content mechanism can give a good performance in terms of success rate and availability for high density of node (0.1 nodes per square meter). But for lower density of nodes, the success rate and availability remains low (below 40%) even for large anchor zone radii like 900 meters. Moreover in presence of a realistic communication model, there is a tradeoff for broadcast interval. If the broad-cast interval is too large then the performance starts to degrade due to not exchanging information between nodes even after coming into transmission range of each other. On the other hand if the broad cast interval is too short then the performance starts to degrade because of collisions and congestion collapse. An important conclusion that can be drawn from all these results is that floating content service can be implemented for the applications that operate in areas having high user density like city centers, shopping malls, etc.
model for base lining work on floating content and see that how this affects the performance of floating content service. We also intend to include different sizes of information like pictures, videos that need to be exchanged among users for the considered situated introductions application. Adding size into the picture makes a lot of things to change particularly for high density of nodes. For example it may be possible that two nodes came in transmission range of each other but the contact duration was not enough for the whole information to be exchanged completely. Similarly congestion and collisions in presence of a shared medium also increases, resulting in affecting the performance of the application. Another possible direction can be considering some other realistic mobility models and real traffic traces. Another direction can be ex-ploring techniques for removing security and privacy issues for such applications. We also intend to build a systematic analytical approach in order to build an analytical model for the floating content service.
REFERENCES
[1] A.K. Dey, ”Understanding and Using Context” Personal Ubiquitous Comput, vol.5, pp. 4–7, 2001.
[2] J. Ott, E. Hyyti, P. Lassila, T. Vaegs and J. Kangasharju, ”Floating Content: Information Sharing in Urban Areas”Proceedings of Pervasive Computing and Communications (PerCom), 2010, pp. 136–146, 2011. [3] J. Wortham. Customers Angered as iPhones Overload 3G.
http://www.nytimes.com/2009/09/03/
[4] A. Balasubramanian, R. Mahajan and A. Venkataramani, ”Augmenting mobile 3G using WiFi”Proceedings of the 8th international conference on Mobile systems, applications, and services (MobiSys ’10), pp. 209– 222, 2010.
[5] C. Ziegler. Sprint Falls in Line, Caps ”Unlimited” Data at 5GB. http://www.engadgetmobile.com/2008/05/19/ sprint-falls-in-line-caps-unlimited-data-at-5gb/, 2008.
[6] E. Hyytia, J. Virtamo, P. Lassila, J. Kangasharju, and J. Ott, ”When does content float? characterizing availability of anchored information in opportunistic content sharing”Proceedings of IEEE INFOCOM, pp. 3137–3145 , 2010.
[7] V. Lenders, M. May, G. Karlsson, and C. Wacha, ”Wireless ad hoc podcasting”SIGMOBILE Mob. Comput. Commun. Rev.,vol.12, pp. 65–67, 2008.
[8] I. Leontiadis and C. Mascolo, ”Opportunistic spatio-temporal dissemina-tion system for vehicular networks”Proceedings of the 1st international MobiSys workshop on Mobile opportunistic networking, pp. 39–46, 2007. [9] W. Gao, Q. Li, B. Zhao, and G. Cao, ”Multicasting in delay tolerant networks: a social network perspective”Proceedings of the tenth ACM international symposium on Mobile ad hoc networking and computing, pp. 299–308, 2009.
[10] P. Hui, J. Crowcroft, and E. Yoneki, ”Bubble rap: Social based forward-ing in delay tolerant networks”in Proc. ACM MobiHoc, pp. 241–250, 2008.
[11] A. Villalba Castro, G. Di Marzo Serugendo, and D. Konstantas, ”Hov-ering information: Self-organizing information that finds its own storage”
Proceedings of the 2008 IEEE International Conference on Sensor Networks, Ubiquitous, and Trustworthy Computing (sutc 2008), pp. 193– 200, 2008.
[12] O. R. Helgason, E. A. Yavuz, S. T. Kouyoumdjieva, L. Pajevic, and G. Karlsson, ”A mobile peer-to-peer system for opportunistic content-centric networking”Proceedings of the second ACM SIGCOMM workshop on Networking, systems, and applications on mobile handhelds, pp. 21–26, 2010.
[13] B. Liu, B. Khorashadi, D. Ghosal, C.-N. Chuah, and M. Zhang, ”As-sessing the VANET’s local information storage capability under different traffic mobility”in Proc. of IEEE INFOCOM 2010, pp. 1–5, 2010. [14] N. Thompson, R. Crepaldi, and R. Kravets, ”Locus: A location-based
data overlay for disruption-tolerant networks” Proceedings of the 5th ACM workshop on Challenged networks, pp. 47–54, 2010.
[15] Li Han; Jyri, S.; Jian Ma; Kuifei Yu; , ”Research on Context-Aware Mobile Computing,”Proceedings of 22nd International Conference on Advanced Information Networking and Applications - AINAW 2008. , vol., no., pp.24-30, 25-28 March 2008
[16] http://techcrunch.com/2010/02/23/location-based-services-revenue/ [17] http://www.wpi.edu/news/20101/2010wireless.html
[18] Active Badge Location System”, ACM Transactions on Information System, 10(1),1992, pp.91-102.
[19] MIT Oxygen Project, http://oxygen.csail.mit.edu/index.html [20] Standford iRoom http://iwork.stanford.edu/
[21] The Aware Home: http://www.awarehome.gatech.edu/
[22] Long S., et al, ”Rapid Prototyping of Mobile Contextaware Applications: The Cyberguide Case Study”,The 2nd ACM International Conference on Mobile Computing and Networking, November, 1996, pp.10-12. [23] Schwinger W., Grun Ch., Proll B., Retschitzegger W., Schauerhuber
A., ”Context-Awareness in Mobile Tourism Guide - A Comprehensive Survey”,Technical Report, Johannes Kepler University Linz, IFS/TK, July, 2005.
[24] Eagle N. and Pentland A. ”Social serendipity: mobilizing social soft-ware”, IEEE Pervasive Computing, Special Issue: The Smart phone, April-June 2005, pp.28-34.
[25] Eagle N. and Pentland A, ”Reality mining: sensing complex social systems”. Journal of Personal and Ubiquitous Computing, December 2005, pp.1-14.
[26] Burak A. and Sharon T., ”Analyzing usage of location based services”,
In CHI’03 Extended Abstracts on Human factors on computing systems, ACM Press, Florida, USA, 2003, pp.970-971.
[27] Nakanishi Y., Kumazawa S.,Tsuji T. and Hakozaki K., ”ICAMS2: developing a mobile communication tool using location information and schedule information with J2ME”,In Proceeding of the 5th International Symposium on Human Computer Interaction with Mobile Devices and Services. (MobileHCI’03), Udine, Italy,September 2003, pp.400-404. [28] M.A.Munoz, M.Rodriguez, J.F.Center, A.I.Martinez-Garcia and
V.M.Gonzalez. ”Context-Aware Mobile Communication in Hospitals”,
IEEE Computer, 36(9), September 2003, pp.38-46.
[29] M. Bredel and M. Bergner. ”On the accuracy of IEEE 802.11g wireless LAN simulations using OMNeT++”,In Proceedings of the 2nd Interna-tional Conference on Simulation Tools and Techniques(Simutools ’09). [30] A. Varga. ”The OMNeT++ discrete event simulation system”,in
Pro-ceedings of the European Simulation Multiconference (ESM01), Prague, Czech Republic, Jun.2001.