World Maritime University World Maritime University
The Maritime Commons: Digital Repository of the World Maritime
The Maritime Commons: Digital Repository of the World Maritime
University
University
World Maritime University Dissertations Dissertations
11-5-2017
Ensuring the effective implementation of the monitoring, reporting
Ensuring the effective implementation of the monitoring, reporting
and verification (MRV) system in shipping: a step towards making
and verification (MRV) system in shipping: a step towards making
energy-efficiency happen
energy-efficiency happen
Abu Hasan Rony
Follow this and additional works at: https://commons.wmu.se/all_dissertations
Part of the Energy Policy Commons, and the Transportation Commons
Recommended Citation Recommended Citation
Rony, Abu Hasan, "Ensuring the effective implementation of the monitoring, reporting and verification (MRV) system in shipping: a step towards making energy-efficiency happen" (2017). World Maritime University Dissertations. 546.
https://commons.wmu.se/all_dissertations/546
non-WORLD MARITIME UNIVERSITY
Malmö, Sweden
ENSURING THE EFFECTIVE IMPLEMENTATION
OF THE MONITORING, REPORTING AND
VERIFICATION (MRV) SYSTEM IN SHIPPING: A
STEP TOWARDS MAKING ENERGY-EFFICIENCY
HAPPEN
By
ABU HASAN RONY
BangladeshA dissertation submitted to the World Maritime University in partial fulfilment of the requirements for award of the degree of
MASTER OF SCIENCE
IN
MARITIME AFFAIRS
(SPECIALIZATION IN MARITIME ENERGY MANAGEMENT)
2017
DISSERTATION DECLARATION
Supervised by:
Dr. Momoko Kitada
Assistant Professor, World Maritime University
Co-Supervisor: Dr. Aykut Ölcer
Professor, World Maritime University
ACKNOWLEDGEMENT
Within the given time for the dissertation, it would have been extremely difficult without the profound support from the below individuals.
First of all, I wish to extend my deepest gratitude to my supervisor Professor Dr. Momoko Kitada for her overwhelming support, guidance, and motivation which were extended to me during my thesis. Her exemplary support and constant guidance have kept me on the track when I felt lost.
Also, special thanks to my co-supervisor Prof. Dr. Aykut Olcer for creating the specialization of Maritime Energy Management. If this specialization was not created I would not be here at WMU today and I would have missed this unique opportunity to meet world’s greatest professors in the maritime arena. It’s been an amazing experience that I will always cherish.
I would like to acknowledge the support and ever-willing assistance from Miss. Anna Volkova and Mr. Chris Hoebeke for the technical issues and extending required IT support for the research what made my work easy and timesaving.
A very special thanks to my beloved wife, Merina Hasan, my son Auritro and daughter Anumeha for being my true inspiration, strength and constant encouragement. Many thanks go to my wife for taking all hardship in my absence and always supporting me to make this mission possible.
ABSTRACT
Title of Dissertation:
Ensuring the Effective Implementation of the Monitoring, Reporting and Verification (MRV) System in Shipping: A Step Towards Making Energy-Efficiency Happen
Degree: Master of Science in Maritime Affairs
Monitoring, Reporting and Verification (MRV) is an important element for the assessment of GHG emissions. It is necessary to understand the maritime industry’s standpoint and future trend of a GHG emissions scenario to facilitate regulatory developments in regional and global level. MRV is mandatory for ships of specific sizes under IMO (from 1 January 2019) and EU (from 1 January, 2018). Measurement of emissions from maritime transport is also crucial to initiate stricter control and development of the new regulatory regime, as shipping emissions in a Business-As-Usual Scenario will increase between 50% to 250% by 2050. The research presented herein investigates the gaps and barriers for implementing the MRV onboard vessels. Vessel’s existing data collection regime and data collected were studied via an online survey. Different perspectives on gaps and barriers to the MRV were analyzed such as administrative, technological, human elements and data quality. This research employs the Multiple Attribute Decision Making (MADM) tool (Technique for Order of Preference to Ideal Solution-TOPSIS) for selecting the best applicable fuel consumption monitoring method which potentially facilitate the implementation process of the MRV and maintenance of data accuracy and robustness. The holistic and enhanced understanding on gaps, barriers and use of appropriate data collection method will help policymakers to adopt better strategic decisions for energy efficiency enhancement and smooth implementation of a MRV system in the IMO and EU.
TABLE OF CONTENTS
DISSERTATION DECLARATION ii
ACKNOWLEDGEMENT iii
ABSTRACT iv
TABLE OF CONTENTS v
LIST OF TABLES ix
LIST OF FIGURES x
LIST OF ABBREVIATIONS xii
Chapter I
Introduction 15
1.1 Background 15
1.2 Literature Review 17
1.3 Objective 21
1.4 Methodology 21
1.5 Expected outcomes 23
1.6 Structure of the dissertation 23
Chapter II
MRV in Other Sectors 25
2.1 Overview 25
2.2 The MRV for National GHG Measurement 25
2.3 The MRV Process for Forestry 26
2.4 The MRV for Various Emission Trading Scheme (ETS) 26
2.5: Summary 27
Chapter III
MRV in Low-Carbon Shipping 28
3.1 Overview 28
3.2 MRV as a Market Based Measure for Maritime Transport 28
3.3 The Framework and Pathways of MRV in Maritime Transport 29
3.3.2 The European Union (EU) MRV 33 3.3.3 Comparison of Data Requirement for the IMO-DCS and EU-MRV system 36
3.3.4 Data Collection Plan or Monitoring Plan 37
3.3.5 Fuel Consumption Monitoring and Interpretation 37
3.3.5.1 Method-A: Bunker Delivery Note (BDN) and Periodic Stock Taking in Fuel
Tanks 38
3.3.5.2 Method-B: Regular stocktaking of bunker tanks 39
3.3.5.3 Method-C: Reading from Flowmeters 39
3.3.5.4 Method-D: Direct Measurement from Exhaust Gas Outlet 40
3.3.5.5 Emission Factor 41
3.3.5.6 Determination of losses on quantity measurement of fuel 41
3.3.6 Emission Report 42
3.4 Comparison Between SEEMP and MRV Processes on the Data Reporting Requirements 43
3.5 Summary 44
Chapter IV
Existence of Potential Data Error 45
4.1 Overview 45
4.2 Bunker Delivery Note 45
4.3 Shortage of supply to ship during bunkering 47
4.4 Error with Measurement of Bunker Tank 47
4.5 Flowmeter as a Source of Error 48
4.6 Error with Exhaust Gas Uptake Measurement Devices: 49
4.7 Documentation for Recording Fuel Consumption 50
4.7.1 Engine Room Log book 51
4.7.2 Chief Engineer’s Log Abstract 51
4.8 Summary 52
Chapter V
An Evaluation of the Shipping Industry’s Readiness to the MRV 53
5.1 Overview 53
5.2.1 Group A: General 53
5.2.2 Group B: Policy Perspective 54
5.2.3 Group C: Technological Standpoint 59
5.2.4 Group D: Human Element 64
5.2.5 Group E: Ensuring Data Quality 69
5.3 Summary 73
Chapter VI
Employing TOPSIS Method- Ranking of FC Monitoring Methods 74
6.1 Overview 74
6.2 Estimation of Data Error with FC Monitoring Methods 74
6.3 Estimation of Cost of technology for FC Monitoring Methods 75
6.4 Estimation of Operational and Maintenance (O&M) Cost for FC Monitoring Methods 76 6.5 Rating point based on respondents’ preferences of the survey questionnaire 78
6.6 Data input to the TOPSIS model 78
6.7 Weighing the Attributes 79
6.8 Ranking phase of fuel Consumption monitoring methods 80
6.9 Summary 80
Chapter VII
Effective Implementation of MRV- Barriers and How to Deal with Them 81
7.1 Overview 81
7.2 Associated barriers to the MRV process from the vessel’s perspective 81
7.3 Addressing Prevailing Barriers 82
7.4 Elimination of barriers through Data Quality Management (DQM) 84 7.5 Role of stakeholders on removal of barriers for the MRV regime 85
7.5.1 The role of IMO Member States 86
7.5.2 Recognized Organization/ Accredited Verifier 87
7.5.3 The Company’s role on eliminating barriers of MRV system 88
7.5.4 Vessel’s role on eliminating barriers of MRV system 88
7.6 Summary 89
Chapter VIII
8.1 Conclusion 90
8.2 Recommendations 92
8.2.1 Limitations and Suggestions 93
Bibliography 94
Appendix 1: Survey Questionnaire 98
Appendix 2: Review of the Engine Room Log Book 104 Appendix 3: Review of a Chief Engineer’s Log Abstract 110
LIST OF TABLES
Table 1: Comparison of IMO-DCS and EU-MRV Process 36
Table 2: Fuel consumption monitoring methods 40
Table 3: Emission factors marine fuels 41
Table 4: Standardized Data Reporting Format for DCS 42
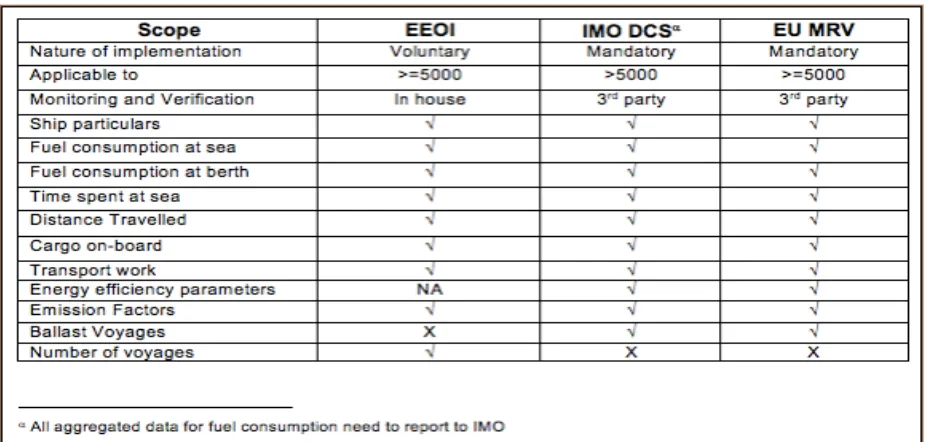
Table 5: Emission sources under EEOI, IMO-DCS and EU-MRV System 43
Table 6: Comparison of SEEMP, IMO DCS and MRV data 44
Table 7: ISO8217 Fuel specification 46
Table 8: Survey Outcome of Question 15 63
Table 9: Survey outcome of Question 16 64
Table 10: Survey Outcome of Question 19 66
Table 11: Survey Outcome Question 22 69
Table 12: Potential Data Error for FC Monitoring Method 75
Table 13: CAPEX of FC Monitoring Methods 76
Table 14: O&M Costs for FC Monitoring Methods 77
Table 15: Rating point from the survey for FC Monitoring Methods 78
Table 16 Data Inputs for TOPSIS Model 79
Table 17 Assigning weights to the attributes 79
Table 18: TOPSIS ranking 80
LIST OF FIGURES
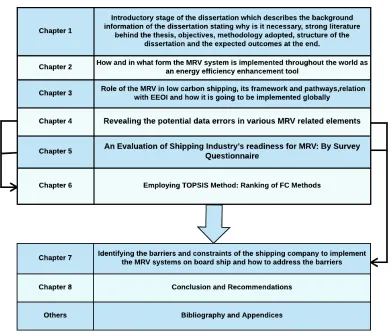
Figure 1: Structure of the dissertation 24
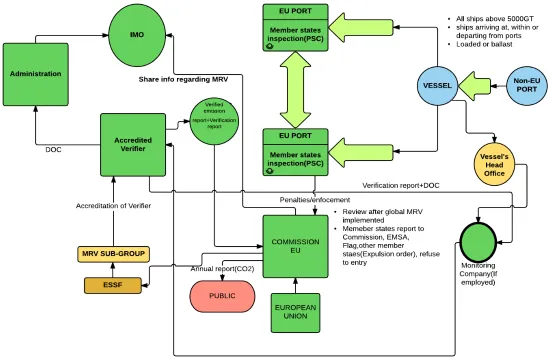
Figure 2: MRV System, Source: Author 29
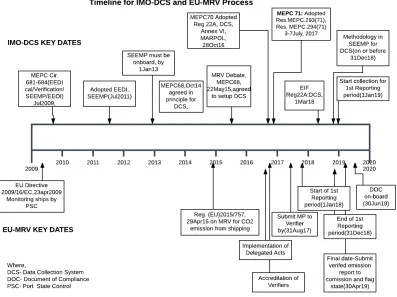
Figure 3: Key dates and timeline for IMO-DCS and EU-MRV System 30
Figure 4: IMO-DCS, Data flow 31
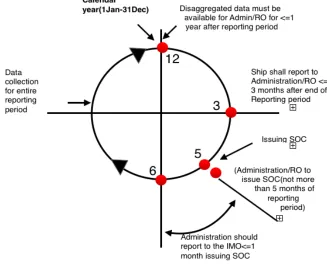
Figure 5: IMO-DCS Cycle 32
Figure 6: Staged approach of EU-MRV 33
Figure 7: EU-MRV Process 35
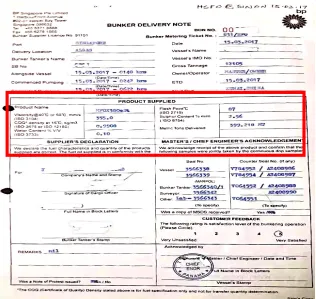
Figure 8: Sample of BDN 45
Figure 9: Marine Fuel Oil Flow meter 49
Figure 10: Data exchange process for Exhaust Gas Monitoring Device 50
Figure 11: Use of international Standard in a company 55
Figure 12: Inclusion of Energy Efficiency Measures 56
Figure 13: Existence of Energy Management Team 57
Figure 14: Applicability of EU-MRV System 58
Figure 15: Impact of MRV on SEEMP 59
Figure 16: Fuel consumption monitoring system 60
Figure 17: Evaluation of Fuel Consumption Monitoring Method 61
Figure 18: Ship’s daily dynamic data 62
Figure 19: Awareness of EU-MRV 65
Figure 20: Responsibilities under SEEMP 66
Figure 21: Training for Robust MRV System 67
Figure 22: Removing administrative burden from crew 68
Figure 23: Issues with manual data collection 70
Figure 24: Cause for Misreporting 71
Figure 25: Type of IT system Use 72
Figure 26: Problem associated with data collection 73
Figure 27: Data flow between parties in EU-MRV process 86
Figure 28: Scope of a Verifier 87
Figure 30: Engineers Log Book, Page 1 104
Figure 31: Engineer's Log Book, Page 2A 105
Figure 32: Engineer's Log Book, Page 2B 106
Figure 33: Engineer's Log Book, Page 2C 107
Figure 34: Part of Engineer's Log Book Page 2D 108
Figure 35: Contents of Chief Engineer's Log Abstract-1 110
Figure 36:Contents of Chief Engineer's Log Abstract-2 110
Figure 37:Contents of Chief Engineer's Log Abstract-3 111
Figure 38:Contents of Chief Engineer's Log Abstract-4 111
Figure 39:Contents of Chief Engineer's Log Abstract-5 112
Figure 40:Contents of Chief Engineer's Log Abstract-6 112
Figure 41: TOPSIS Model- Part 1 113
LIST OF ABBREVIATIONS
ARP Acid Rain Program BAU Business-As-Usual BDN Bunker Delivery Note CAPEX Capital Expenditure
CDM Clean Development Mechanism CELA Chief Engineer’s Log Abstract
CMMS Computerized Maintenance Management System COP21 Conference of Parties 21
CO2 Carbon Dioxide COQ Certificate of Quality DCS Data Collection System DCP Data Collection Plan DF Distillate FAME
DQM Data Quality Management EEDI Energy efficiency Design Index EEOI Energy efficiency Operational Index EPA Environment Protection Agency EU European Union
EU-ETS European Union Emission Trading Scheme
EU-MRV European Union-Monitoring, Reporting and Verification FAO Food and Agricultural Organization
FC Fuel Consumption
FCDCS Fuel Consumption Data Collection System FO Fuel Oil
GHG Green House Gas
IMO-DCS International Maritime Organization- Data Collection System INDC’s Intended Nationally Determined Contributions
IPCC International Panel for Climate Change ISM CODE International Safety Management CODE ISO International Standardization Organization JI Joint Implementation
LEDS Low-Emission Development Strategies MARPOL Marine Pollution
MADM Multi Attribute Decision Making MBM Market-Based-Measures
MEPC Marine Environment Protection Committee MP Monitoring Plan
MRV Monitoring, Reporting and Verification NAMAs Nationally Appropriate Mitigation Actions NBTP Nox Budget Trading Program
NDCs Nationally Determined Contributions NOx Nitrogen Oxides
OPEX Operating Expenditure O&M Operational and Maintenance
REDD+ Reducing Emissions from Deforestation and Forest Degradation+ RO Recognized Organization
SEEMP Shipboard Energy Efficiency Management Plan SO2 Sulphur Oxides
SOC Statement of Compliance
TOPSIS Technique for Order of Preference to Ideal Solution UN United Nations
Chapter I
Introduction
1.1 Background
Climate change has discernible effect on earth ecosystem and threat to human existence. Recent studies on climate systems suggests that human elements are the cause for the climate anomaly (IPCC, 2013). The continued emission is causing irreversible change in the climate system, and the change in global and regional climate is more significant than ever before. The IPCC fourth assessment report (AR4) stated that 1983-2012 was the warmest 30-year period in the last 1400 years. The magnitude of the damage can only be minimized by stricter control over Greenhouse Gas (GHG) emissions globally. Realizing the adverse impact, global communities have initiated actions to achieve stricter control over GHG emissions and have established policies under the United Nations (UN) and International Maritime Organization (IMO) to retain the world’s existence for future generations. However, shipping and aviation industry have been excluded from the Paris Agreement, because of their international nature and being controlled by specialized body of UN (IPCC, 2013).
efficiency improvement technologies to ships. Since 2009, IMO has developed significant energy efficiency improvement regulations towards sustainable shipping by adopting many measures such as, SEEMP1, EEDI2, and EEOI3. Therefore, developing a global fuel oil consumption database for the shipping industry is another significant step towards green shipping.
In promoting energy efficiency in the shipping industry, IMO’s Data Collection System (DCS), proposed on 28 October 2016 at the Marine Environment Protection Committee 70 (MEPC70), a substantial step towards achieving green shipping which is expected to make other energy efficiency measures more transparent, effective and measurable. Measuring is the most important activity of energy efficiency, if it cannot be measured, it cannot be controlled. A detailed inventory will thus allow policy makers to determine the magnitude of pollution and pace of the decision making and adopt global regulations regarding shipping emission. The Monitoring, Reporting and Verification (MRV)4 system is the key element for good governance. Similarly, the MRV system is the core of Energy Management, without MRV other energy efficiency measures may not be effectively implemented. A system’s performance, operational parameters, indicating measurements and status quo need to be studied, evaluated and analyzed for a certain period of time before any policy is taken into consideration for Energy efficiency improvement.
In the case of the European Union (EU), all transport modes, including the maritime sector, to a certain extent emissions are measured and controlled under strict mandatory regulations and participation in the EU climate initiative (EU-ETS). As such, the integration of MRV into EU policy to reduce emission from the shipping industry is the
1 Shipboard Energy Efficiency Management Plan 2 Energy Efficiency Design Index
3 Energy Efficiency Operational Index
4 IMO-DCS and EU-MRV have minor differences and are considered as synonymous in this paper. In many places, both of these
primary reason for the adaptation of such a system. In the EU, maritime transportation has increased by 48% between 1990 to 2007 (EUR-Lex, n. d.). The EU Regulation (EU) 2015/757 considers that EEDI, EEOI and SEEMP alone may not be sufficient to reduce greenhouse gas emission, therefore, it is essential to adopt a more stringent policy framework. In EU Regulation (EU) 2015/757 the introduction of MRV is justified as a benchmarking tool for shipping Energy efficiency measurement. In 2030 the framework of EU (Regulation EU 2015/757) target for reducing GHG pollution from domestic sources is to be reduced by at least 40% compared to the 1990 level. The intension of the implementation of EU-MRV is that it could serve as a model which will facilitate the smooth global adoption of such system.
From a shipping company’s perspective, the effective implementation of MRV not only gives competitive advantages in the market, but keeps it upfront in the race. Moreover, energy saved from energy efficiency enhancement measures could compensate a system implementation cost. IMO adopted EEOI and SEEMP in 2013, however, some ambiguity still exists on the reporting format, the development of a comprehensive monitoring plan and monitoring procedures for fuel consumption. The MRV system is mandatory and will be requiring verification at each step by authorized verifiers. The organizational capabilities such as technical, financial and human aspects to ensure the effective implementation of such regulations is equally essential at an organizational level in any shipping company. To bridge this gap and ensure a smooth transition from a conventional system to a modern MRV system, research is required focusing on specific areas of concern.
1.2 Literature Review
MRV systems, therefore, the literature on maritime MRV is limited. However, available literature and resource material have been reviewed as much as possible from multiple sources and dimensions in the maritime industry. In addition, literature concerning MRV in other sectors were visited in order to better understand the maritime industry for benchmarking and gap analyses. There are emerging issues in the context of the maritime MRV process as highlighted below.
Successful MRV regimes Schakenbach, Vollaro and Forte (2012) describe the fundamentals of effective and fruitful implementation of the MRV system and MBM such as the Cap-And-Trade system for monitoring Acid Rain Program (ARP) and Nox Budget Trading Program (NBTP) in the United States. The paper stresses the MRV elements which basically support and include strong compliance, quality assurance, accuracy and completeness of data, centralized monitoring, level playing field, and emission reduction incentives. Reviewing the successful MRV regimes could facilitate the identification of barriers and actions towards effective elimination. Paulsen and Johnson (2015) describe the current best practices and challenges of implementing the MRV system in the maritime field. This paper also explains the policy makers and different stakeholder’s roles in adopting energy efficiency practices which could also ensure effective participation in the MRV process.
[Res.MEPC282(70)] are all sources of the regulatory directions and procedures for GHG emission reductions. The Regulation (EU) 2015/757 of the European Parliament and of the IMO Council of 29 April 2015, are the main guidelines for the EU-MRV as it sets the procedures for the different stakeholders in the MRV regime for ships over 5000GT. The regulation emphasizes the reduction of uncertainty, maintaining accuracy, removing data gaps and barriers for a robust MRV system. In MEPC71, July 2017, various resolutions and guidelines were adopted for the MRV system, such as guidelines for maintaining fuel consumption database, using GISIS as information platform for the DCS, and policy on proxy for transport work.
Technological issues Fan, Yan, and Yin (2016) discusses the multisource information system for the effective monitoring technology to allow real time seamless data collection, monitoring and identifying potential for technological improvement for Energy efficiency. The paper illustrates how technology could be incorporated into a vessel’s monitoring and data transmission system for improving the management of shipboard dynamic and static data.
The effective implementation of MRV will only come true when all the data uncertainty has been identified and resolved. Insel (2008) describes the uncertainty of speed and power measurements which occur in changing sea states and other changes affecting the measurement readings. As such, applying similar process for removing of data uncertainty from the MRV related source of data should be examined to facilitate the robust, credible, accurate and reliable MRV process.
IMO or EU will also boost technological improvement in the instrumentation and data collection system. The accurate data acquired by the new data collection system will also help IMO to develop a vision for the shipping sector (IMO, 2017). An assessment of the technological gap, trend, development, preferences, and procedures followed by the shipping sector is a necessary prior implementation of the new data collection system and this is the focus of this research.
TOPSIS Model The selection of the monitoring method is vital for the MRV system. According to Olcer, 2008, multi-objective combinatorial optimization for multi conflicting objectives is really a complicated decision-making process. These Multiple Attributes Decision Making (MADM) techniques are used in the ship design process. The Technique for Order of Preference to Ideal Solution (TOPSIS) method could be employed and achieve the best and worst solution ranking of the alternatives while the effective implementation of the MRV process could be ensured by better decision making at the outset. For the ship design process this method is used for determining the best design feature for a MADM problem. Therefore, this a new approach to apply TOPSIS model for selecting best fuel consumption monitoring.
Barriers to energy efficiency in shipping Jafarzadeh & Utne, (2014) identify the barriers to energy efficiency in the shipping industry from multiple perspectives, such as information, economic, intra-organizational, inter-organizational, technological, policy and geographical barriers. Many barriers identified in this study is relevant to the potential barriers for the MRV process. However, the MRV related barriers are more oriented to the policy, technology, human and data quality. In-depth study on vessel’s documentations, fuel consumption monitoring methods and analyzing the shipping industry’s standpoint is essential for identification of the barriers to the MRV process.
1.3 Objective
The main focus of the research is to find out the barriers and constraints of the implementation of the MRV system in the shipping industry. In doing so, the research focuses on:
• the efficiency of the current energy efficiency regime (SEEMP and EEOI) and gaps with the MRV system,
• the identification of barriers in different dimensions, such as policy, technological, human factor, and maintaining data quality,
• the identification and recommendation on how data accuracy and robustness can be maintained for the effective implementation of the MRV system.
1.4 Methodology
revealing the barriers of organization, human elements and the data gap. Taking into account the short timeframe and complexity of the research, the survey has to be carried out online, as this can give wider access to the maritime community in the quickest time to get feedback. Scarcity of resources and time make it difficult to visit places and interview face-to-face. Thus, surveying online has been decided to be more effective in this regard. The questionnaire on required technological status onboard ship for the improvement of data quality was also incorporated.
Developing a survey questionnaire is challenging as multiple factors have to be looked into to make it effective and successful. A survey questionnaire is considered as a conversation with the respondents regarding the subject matter. The internet survey questions need to be so constructed that it has to be simple and easy to understand. It has to be clear to avoid misunderstanding, misinterpretation and can be skipped if the reader does not want to answer. Again, the appearance of individual pages, question’s order and format could be influencing factors for the decision and responses (Dillman, 2007). Therefore, the careful construction of a questionnaire could deliver better responses and successful survey. The survey questionnaire of this research will be targeted to the whole maritime cluster including Navigational officers, Masters, Ship’s Engineers, Ship Managers, Surveyors, and people working in maritime administration in the government organizations. The addition of excessive technical matters to the survey questionnaire have been avoided to retain the simplicity of the questionnaire.
Finally, after achieving the results from the evaluation of the vessel perspective and outcome of the online survey questionnaire, the significant barriers to the uptake of MRV will be identified. A TOPSIS model will be created to assess the fuel consumption data collection methodologies of a vessel to compare under different attributes such as data error, Capital Expenses (CAPEX), Operational Expenses (OPEX) and the respondent’s rating of fuel consumption methodologies from the online survey. The most preferable method for data collection could be forecasted with the employment of the MADM method. The analysis of the TOPSIS model will display a factual picture on maintaining data accuracy and quality.
1.5 Expected outcomes
This research will identify the constraints and barriers for effective implementation of the MRV systems and enable to mitigate in an efficient way. This research will suggest the suitable best steps to consider for the fuel consumption monitoring and guide to develop strategic instruments for MRV implementation.
1.6 Structure of the dissertation
Figure 1: Structure of the dissertation
Chapter II
MRV in Other Sectors
2.1 Overview
The MRV process is successful in many areas having a wide range of positive impact on emission reduction including the protection of forestry and agriculture and improving human health. MRV is also considered as the precursor for Clean Development Mechanism (CDM) and Joint Implementation (JI) under the United Nation Framework Convention for Climate Change (UNFCCC). The inventory of GHG emissions, evaluating, monitoring and sharing information with all parties are necessary to implement the CDM and JI for taking required actions (UNFCCC, 2017). The following sections provide an overview of recent successful MRV practices in various domains.
2.2 The MRV for National GHG Measurement
Low-Emission Development Strategies (LEDS), Nationally Appropriate Mitigation Actions (NAMAs) and MRV systems in their countries of jurisdiction (Pang et al., 2014).
2.3 The MRV Process for Forestry
As the national GHG measurement program of MRV under UNFCCC, the UN’s Reduction of Emission from Deforestation and Forest Degradation (REDD+) program, was launched in 2008. It is a cooperative approach to help developing countries adopt expertise and technical knowledge on REDD+ issues with the help of the Food and Agricultural Organization (FAO) and United Nations Development Program (UNDP). The program helps national authorities to implement the REDD+ program involving all stakeholders at the national and international levels. Under the UNFCCC, the REDD+ countries require to establish robust and transparent forest MRV systems. The MRV system is required to cover all types of forests to minimize double counting and leakage. The key principles for good governance for MRV is transparency, accountability and participation (Ochieng, Visseren-Hamakers, Arts, Brockhaus, & Herold, 2016) .
2.4 The MRV for Various Emission Trading Scheme (ETS)
is an extraordinary example for a Market-Based-Measure (MBM) which is effective in 31 countries and controlling 45% of the EU’s GHG emission. EU-ETS shows effectiveness in the reduction of emission as a GHG emission having been reduced by 5% in 2015 compared to 2013. Within the EU-ETS Cap-and-Trade system, a company may receive or sell “Emission Allowances” and they can also buy “International emission reduction credits” for emission reduction projects around the world (European Commission, 2017). The effectiveness of the ETS largely depends on the effective implementation of MRV systems across all industries.
2.5: Summary
Chapter III
MRV in Low-Carbon Shipping
3.1 Overview
The shipping MRV will increase the efficiency of the global maritime emissions reduction initiatives. None of the emission reduction ideas could be effectively implemented without a MRV system; the MRV would act as a precursor for any MBM. A clear understanding of the MRV process is necessary for the effective implementation of the system. This chapter discusses the entire shipping MRV process including the regulatory procedures in the IMO and EU and a comparative study with the other existing energy efficiency measures. A discussion on the fuel consumption monitoring methods and issues related to each method have been reviewed concisely.
3.2 MRV as a Market Based Measure for Maritime Transport
According to the MEPC 61 information paper (IMO, 2010), the Experts Group’s feasibility study was undertaken to reduce GHG emission from ships. The study represents proposals for different MBM’s by various countries in the meeting, such as GHG Fund for Ship, Leveraged Incentive Scheme (part of GHG fund goes for good ships), Port states levy (award to green and efficient ship), Ship’s Efficiency and Credit Trading, Vessel Efficiency System, Global Emission Trading Scheme for international Shipping, and Emission Trading Scheme. These abatement proposals could be effectively enforced when emissions from maritime transport is inventoried and under the continuous monitoring regime. The stringent regulations and economic incentives on energy efficiency are the driving forces, which will influence a company to invest in GHG abatement technologies and achieve significant reduction of GHG in maritime transport (IMO, 2010).
MBM’s in the shipping industry actually leads to further developments in the legal instruments and the adoption of DCS by IMO.
3.3 The Framework and Pathways of MRV in Maritime Transport
Bellassen et al., (2015) provide definition for a MRV process:
“Monitoring” covers the scientific part of the MRV process. It involves getting a number for each variable part of the equation that results in the emissions estimate. This range of direct measurement of gas concentration using gas meters to the recording of proxies such as fuel consumption based on the bills of a given entity.
“Reporting” covers the administrative part of the process. It involves aggregating and recording the numbers, explaining how you came up with them in the requested format, and communicating the results to the relevant authority such as the regulator or the top management of the company.
“The purpose of Verification” is to detect errors resulting from either innocent mistakes or fraudulent reporting. It is usually conducted by the party not involved in the monitoring and reporting, who checks that these two steps were conducted in compliance with the relevant guidelines.
The Maritime-MRV can be defined as a process of continuously measuring any fuel consumption of ships aiming to form a centralized global database with standardized data collection and reporting mechanisms according to a structured and verified monitoring plan developed under the IMO guidelines.
A simplistic process flow chart of the MRV regime under IMO and EU is represented in Figure 2 where different stake holders, such as, the vessel, verifier, administration and IMO/EU’s relations and links on MRV process are established.
In Figure 3, the key dates and timeline of IMO-DCS and the EU-MRV System are presented which portrays the international efforts and regulatory developments in the IMO and EU.
3.3.1 IMO- Data Collection System
The goal of the IMO-DCS is to establish a global fuel consumption database which requires a robust uninterrupted data flow and undisturbed link between all the stakeholders involved in the process. Maintaining data quality and the effective participation of all stakeholders are a matter of concern.
Figure 4: IMO-DCS, Data flow, Source: Based on Res. MEPC.278(70)
secured access. A circular on the submission of data to the IMO data collection system of fuel oil consumption data from a ship that is not entitled to fly the flag of a Party to MARPOL Annex VI was also published in the session. Additionally, some proposals have been made for the proxy of transport work for offshore and contracting vessels and ice class ships (IMO, 2017).
Important issues regarding the data collection system were addressed by MEPC 70 in November, 2016. The definitions and clarifications of various terms such as distance travelled, the company, and cargo have been described in detail. The year of construction is not included to maintain anonymity of a ship. At MEPC 70, the committee agreed that the voluntary implementation of data collection system could be considered by a company prior to the regulation kicking off, however, it will not be forming part of the database. The company can also start voluntary reporting for the familiarization of staff who will take part in the collection process.
According to MARPOL, Annex VI, Reg. 22A, the methodology for data collection should be included in the SEEMP and verified by the Administration or Recognized Organizations (RO) on behalf of the Administration. The above representation, in Figure 5, better displays how the whole process of the MRV system will incessantly run in the future.
3.3.2 The European Union (EU) MRV
The EU MRV is the part of the Union-wide emission reduction scheme which is 40% reduction of emission of 1990 levels in 2030. The EU expect that the Implementation of MRV will cause 2% of the reduction of shipping emission in the EU region compared to the BAU scenario in the future (EU Commission). The staged approach of the EU MRV for the future emission abatement techniques will be subjected to various barriers and benefits on implementation.
Figure 6: Staged approach of EU-MRV5, Adopted from Regulation (EU) 2015/757.
5
The EU-MRV system will act as a model system for the global MRV system as companies operating their vessel in the EU region will have to comply with the EU-MRV regulation prior to the IMO-DCS coming into effect. Moreover, the outcome of the EU-MRV and information and experience learnt from the EU-MRV system, establishing a CO2 emission database, will be shared with the IMO for member states to take the necessary steps for the adoption of IMO-DCS (EUR-Lex, n. d.).
Developing a monitoring plan verified by an accredited verifier for a MRV system is vital. It requires a series of assessments involving a complete data collection, storage and transmission processes. A monitoring plan is considered as a backbone of the MRV system which should be reviewed regularly, at least once in a year (EUR-Lex, n. d.). According to the EU-MRV (EUR-Lex, n. d.), several procedures have to be included in its Monitoring Plan, such as, the measurement of fuel uplift and fuel in the bunker tanks, ensuring the uncertainty of fuel measurement consistent with the requirement in the regulation and fuel suppliers accuracy standard, recording and determining the distance travelled, cargo carried, time spent at sea and detecting surrogate data and eliminating data gaps.
3.3.3 Comparison of Data Requirement for the IMO-DCS and EU-MRV system
IMO-DCS and EU-MRV are similar in many areas, however, some differences exist in the reporting requirements, for example level of uncertainty, average energy efficiency of vessel and emission factor. The full comparison between the IMO-DCS and EU-MRV is illustrated in Table 1 below.
Table 1: Comparison of IMO-DCS and EU-MRV Process
(Based on Appendix IX, Res. MEPC.278(70) and EU Regulation (EU) 2015/757)
Type IMO-DCS EU-MRV SYSTEM
Data anonymity ensured All vessels emission data will be broadcasted
VARI
AB
L
E
Total Fuel Consumption for all systems Total Fuel Consumption and CO2 Emitted
-Aggregated CO2 and fuel consumption for all voyage, in EU, arrival/Departure from EU port
-including laden voyage, cargo heating consumption (voluntary) Method for Fuel Consumption Measurement:
3 Methods
• Using Bunker Delivery Notes (BDN) and periodic stocktaking • Using Flowmeter (FM)
• Bunker FOT Monitoring on board
Method for Fuel Consumption Measurement: 4 Methods
• Using Bunker Delivery Notes (BDN) and periodic stocktaking • Using Flowmeter (FM)
• Bunker FOT Monitoring on board
• Direct Measurement Method (From Exhaust Gas Uptake)
Part C:
• Emission source, Monitoring method and related level of uncertainty
(% per monitoring method use) Distance Travelled over ground Total Distance travelled (Nm) over ground. Hours underway (under own Propulsion) Hours under way (Time spent at sea) Type of Fuel Used (Different fuel collected
separately)
Type of Fuel Used (Different fuel collected separately), Emission Factor for each fuel used.
Report End Date (dd/mm/yyyy) Date and Time of Arrival (To be recorded for per voyage monitoring) Report start Date (dd/mm/yyyy) Date and Time of Departure (To be recorded for per voyage monitoring)
Transport work and total transport work
Average Density of cargo carried in reporting period
Average Energy efficiency1:
FC/Distance (kg/Nm), FC/Transport work, CO2/Distance, CO2/Transport work, Average EE/Transport work, Differentiated Average EE for laden voyage (FC and CO2 emitted-kg/T-m, gmCO2/T-m), Average EEOI (voluntary)
FI
X
E
D
Rated Power Output: • Main Engine (KW) • Aux. Engine (KW)
Ship Name/ IMO No./Port of Registry or Home port/Ship owner, Company, Contact person and Verifier: Name, Address and details of contact, Verifier’s Accreditation no. and Statement of Verifier
EEDI Value (If applicable) EEDI of EIV (gm-CO2/T-M)
Vessel DWT
Vessel Net Tonnage (NT), If applicable
Gross Tonnage (GT) Port of registry or Home port
Ship Type Ship Type
IMO Number IMO Number
3.3.4 Data Collection Plan or Monitoring Plan
SEEMP specifies that ships of 5000GT and above need to have a Data Collection Plan which has to be included in the SEEMP with the specific methodology used for data collection in resolution Res.MEPC.282(70). According to resolution Res.MEPC.282(70), to ensure no data gap the correction procedures and steps to take in case of flowmeter malfunction and addressing the missing data necessary for the Data Collection Plan. The MARPOL Annex VI Regulation 22A suggests that the data needs to be submitted electronically in prescribed the format. Some regulatory ambiguities have been defined in the regulations 22A, MARPOL Annex VI and EC Reg. (EU) 2015/757, such as, Port of call, Distance travelled, Hours underway and Voyage. Port
of call is where ship stops6 for loading or unloading cargo and/or embarking/disembarking
passengers. Distance travelled, while the ship is underway7 using its own power, should be calculated as “Distance over ground” (MARPOL Annex VI, Reg.2). Hours underway should be calculated while the ship is using its own propulsion. Voyage is for the purpose of loading or unloading cargo and/or embarking and/or disembarking passengers between the port of calls.
3.3.5 Fuel Consumption Monitoring and Interpretation
Each type of fuel consumption must be calculated separately and all the inventory is to be recorded. The consistency, accuracy, completeness and transparency of the fuel consumption monitoring methods should be maintained throughout the process. The company may select different types of fuel consumption monitoring methods, however, detailed procedures, fuel systems of various use and the responsibilities of each person involved in the process must be described in detail in the SEEMP or MP wherever it is applicable (Res.MEPC.282(70)). Any change must be reflected in the plan and notified to the Administration or verifier if the plan is reviewed. The SEEMP should be reviewed on a regular basis and at least annually. A company may select any one of the fuel consumption monitoring methods:
a) Method-A: Bunker Delivery Note (BDN) and Periodic stock taking in fuel tanks
6
b) Method-B: Regular Stocktaking of the bunker tanks c) Method-C: Reading from Flowmeters
d) Method-D: Direct measurement from the exhaust gas outlet
3.3.5.1 Method-A: Bunker Delivery Note (BDN) and Periodic Stock Taking in Fuel Tanks
Fuel consumption in a reporting period can be calculated as below: Fuel at the beginning of the reporting period = QA
Bunkered quantity as per BDN= QB Fuel oil available at the end of reporting period = QE Debunker quantity of fuel= QD
So, Fuel Consumption for the reporting period, FC= (QA+ QB)- (QE+ QD)
eliminating data gap or differences has to be recorded and supported with documentary evidence. All losses have to be taken into consideration.
Periodic stock taking is not exactly the same as described in the Method-B, as regulation demands for FO tanks stocktaking which needs to be taken at the beginning and at the end of the reporting period. In the case of EU-MRV, the periodic stocktaking has to be regularly recorded and every beginning or end of voyage and also for the entire reporting period. The error in the periodic stock taking could be minimized, in some cases eliminated, by automated tank gauging devices fitted in the bunker tank to obtain the readings remotely. The accuracy and reliability must be ensured by the regular calibration of the gauge and ensuring certified equipment by the administration if fitted. The manual dip sounding process is more accurate when the vessel is at calm weather condition with no rolling or pitching which gives an error in reading. At sea when the vessel is in motion sometimes erratic readings may give an inconsistency in the fuel tank gauge readings and the CO2 emission data may be affected. Similarly, this could be applicable to the Method-B which entirely depends on the stocktaking of the bunker tanks.
3.3.5.2 Method-B: Regular stocktaking of bunker tanks
Vessels carry out daily Fuel Oil (FO) stocktaking of the bunker tanks usually by the manual dip sounding process or remote gauge monitoring. As discussed in section 3.2.5.1, the error in the manual dip soundings process is larger than in the automated system if precision equipment is fitted for the automated tank gauging system. Miscalculation, erroneous dip soundings of tanks, misreporting, equipment with high errors and losses in the system can end up as wrong FO Consumption. The Res MEPC.282(70) guidelines suggest to take tank reading by three methods namely- the automated system, soundings and dip tapes and tank measuring which should take place daily.
3.3.5.3 Method-C: Reading from Flowmeters
meters are calibrated on a regular basis and specification satisfying MARPOL NOx Technical Code. The necessary equipment’s calibration report should be available on board the vessel.
Annual Fuel Oil Consumption= Summation of Flowmeter reading in a calendar year
According to Res MEPC.282(70) guidelines, other methods could be considered as backup measurement methods in the case of the breakdown of flow meters, however, any methods undertaken for bunker tank monitoring must be described in the SEEMP part II in detail including the calibration method of the flowmeter stating accuracy.
3.3.5.4 Method-D: Direct Measurement from Exhaust Gas Outlet
In this method, applicable to the EU-MRV, data is obtained from the readings of the direct flow measurement of gases in the funnel exhaust stake which is then relayed as quantity of CO2 emission or fuel consumption as required by the operator. Many types of exhaust gas analyzers with high precision, approved by international standards, are available in the market. In terms of the data collection, transfer and processing of this equipment it could be considered convenient for the vessel’s crew. However, reliability and maintenance considering the harsh marine environment could be an issue. According to expert opinions the following can be agreed, as presented in the Table 2, regarding the many factors of fuel consumption monitoring methods.
Table 2: Fuel consumption monitoring methods
Criteria Method A Method B Method C Method D
Process BDN+ Periodic stock
taking Regular stock taking of bunker tanks Flowmeters reading Exhaust measurement gas flow
Applicability IMO and EU IMO and EU IMO and EU EU
Effect of external
factors on accuracy Low Moderate Moderate Low
Obtaining reading
from remote location No To a certain extent To a certain extent Yes Technological
3.3.5.5 Emission Factor
Marine fuels specifications are regulated by the ISO8217: 2017 standard as amended in 2017. Sometimes, the emission factors for conventional factors are not up to date with the industry trend, ISO8217: 2017 which has included properties of biofuels blend and Distillate FAME (DF) grades such as DFA, DFZ and DFB that contains fatty acid up to 7%. With the use of more generic values of the emission factor, this increases the uncertainty in emission measurement calculation (Einemo, 2017). The value of the emission factor has to be taken to convert to the CO2 emission as per IMO recommended value in the Nox Technical Code, whereas, EU-MRV Regulation (EU) 2015/757 takes the International Panel for Climate Change (IPCC) recommended values for the latest Emission factors.
Table 3: Emission factors marine fuels
(Source: MEPC Resolutions / 66th Session / Res.MEPC.245(66))
For a duel fuel engine, different conditions apply. As stated in Res MEPC 282(70), if the correction factor is not available for any particular fuel, such as hybrid fuel, the supplier must provide a particular correction factor with sufficient evidence.
3.3.5.6 Determination of losses on quantity measurement of fuel
vessel movements need to be considered when measuring the tank contents and estimating the fuel consumption.
To ensure the robustness, according to Res MEPC.282(70), of DCS and all losses are taken into consideration, the administration or the verifier must ensure the following:
• To ensure loses during transfer, separation and filtration have been taken into account and included in the SEEMP/MP,
• To ensure that accuracy factors for the fitted equipment in the fuel oil system is high and satisfies the administration,
• To eliminate data loss, standby equipment is available for quick replacement, and
• To carry out regular surveys on FO equipment on board.
3.3.6 Emission Report
The uniformed reporting can only be ensured by using the standardized template with no alteration of the fields (IMO, 2017). The electronic transfer of data from thousands of vessels have to be aligned and streamlined to a defined format.
Table 4: Standardized Data Reporting Format for DCS
(Source: Appendix 3: Res MEPC.282(70))
Me th od used to m easur e FO c ons umpt ion Me th od u se d to me as ur e fu el o il consum pt ion Ot he r (… ) Et ha nol (C f: 1 .9 13 ) Me th an ol (C f: 1 .3 75 ) LN G (C f: 2 .7 50 ) LPG (But ane ) (C f: 3 .0 30 ) LPG ( Pr opa ne ) HF O (C f: 3 .1 14 ) LFO (C f: 3 .1 51 ) Di es el /Ga s Oi l (C f: 3 .2 06 ) Ho ur s un de rwa y (h ) Di st an ce T ra ve ll ed ( nm) Au xi li ar y Engi ne (s) Ma in P ro pu ls io n Pow er
Ice Class
(if ap p licab le) EEDI (if ap p licab le)6 (g C O 2/t. nm ) DW T 5 NT 4 Gr o ss t o n n ag e 3 Ship type 2 IM O n u m b er 1 End da te ( dd/ mm/ yy yy ) Star t date (dd/m m /yyyy)
Fuel oil consumption (t)
Pow er out put (r at ed pow er ) (kW ) 8
In 2016 in Brussels, the EC published draft annexes, pursuant to regulation (EU) 2015/757 of the European parliament and of the Council on the monitoring, reporting and verification of carbon dioxide emissions from maritime transport consisting two parts which are:
efficiency (Fuel consumption, Average energy efficiency, voluntary second parameter of average, and differentiated energy efficiency for a laden voyage).
3.4 Comparison Between SEEMP and MRV Processes on the Data Reporting Requirements
The SEEMP will actually set the ground for IMO-DCS to be easily implemented on board ship. Both processes require continuous monitoring of the energy consumption. The IMO-DCS process gives responsibility to the Administration to verify the Monitoring Plan and ensure robust data being reported to the IMO’s fuel consumption database for global stock taking. Additionally, the various data required for the calculation of EEOI are similarly applicable to the data collection process. The SEEMP and MRV processes both require dedicated responsible persons with specific duties in the monitoring plan. In the case of SEEMP, the EEOI is used as the primary monitoring tools where quantitative measurement for EEOI calculations is necessary (Regulation 22A of the MARPOL, Annex VI).
In Table 5 below, emission sources for monitoring fuel consumption are presented for comparison under the SEEMP, IMO-DCS and EU-MRV system.
Table 5: Emission sources under EEOI, IMO-DCS and EU-MRV System8
The organization should establish an Internationally recognized method for quantitative measurement of EEOI for the vessel and/or for the fleet. EEOI could be considered as the primary step for a vessel’s energy efficiency monitoring (MEPC.213(63): SEEMP Guidelines). The tools, concepts and methods of monitoring the energy efficiency data should be decided in the planning stage and mentioned in the SEEMP (Korean Register of Shipping, n.d.).
Table 6: Comparison of SEEMP, IMO DCS and MRV data
The SEEMP and MRV processes go hand-in-hand as the goals and a significant part of the SEEMP coincide with the MRV process on maintaining data for fuel consumption to monitor the EEOI.
3.5 Summary
Chapter IV
Existence of Potential Data Error
4.1 Overview
This chapter highlights the source of potential data errors in some of the elements of the fuel consumption monitoring methods, equipment and documentations. Each element has been analyzed and specific errors within these elements are identified and discussed.
4.2 Bunker Delivery Note
A Bunker Delivery Note (BDN), in Figure 8, includes the information regarding fuel bunkered with the BDN, such Product name, the viscosity at 400C or 500C (mm/S), Certificate of Quality (COQ), the density at 150C (Kg/m3), the water content 0.10% (v/v), Flash Point 870C, Sulphur Content 2.56% and the metric tons delivered.
In this particular example, Figure 8, the fuel contains 0.10% of water at delivery which is treated and removed by the purifier in a later stage. The total quantity supplied is about 400 metric tons; therefore, the total water content of the fuel oil is 400 liters. In accordance with the ISO 8217 standard, water content can be up to 0.5% v/v for this type of fuel. For all marine residual fuel, water content can differ from 0.3 to 0.5% v/v and for distillate fuel as high as 0.3% (ISO, 2017). Other impurities in fuel oil are not mentioned in the BDN and will only be revealed through the laboratory analysis report.
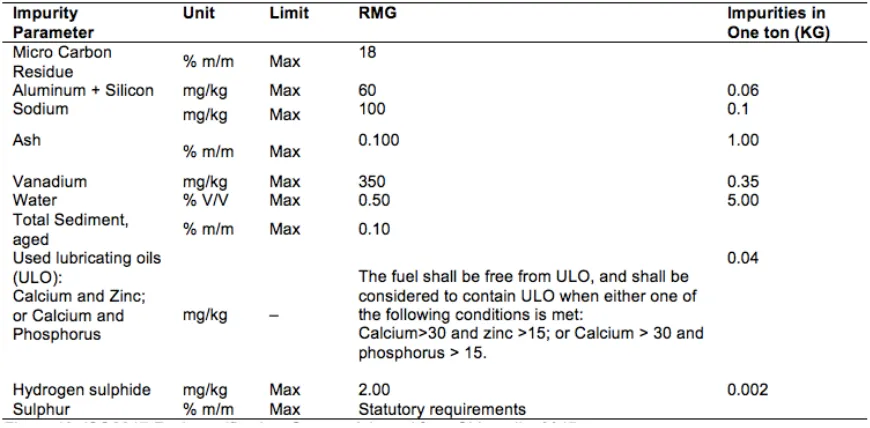
According to the above BDN the specified fuel is of MFO380cst. Limits of impurities of the fuel oil are defined as per ISO 8217 for the above type of oil as represented in Table 7.
Table 7: ISO8217 Fuel specification
(Source: Adopted from Shippedia, 2017)
the capacity of purifier bowl. FO purifiers are normally set for sludge discharging at every 2-hour cycle (according to manufacturer manuals or Chief Engineers instructions). Thus, estimating as less as 2 liters of oil is discharged during each desludging operation, considering the throughput of a FO purifier is 3000 Liters/hours, approximately 0.033% oil is lost through the separation process. Therefore, in this case, a total quantity of 0.69% of FO deduction from the bunker quantity due to impurities in the FO (quality of RMG) may be considered for the calculation of FO loses. Again, a certain quantity of FO is lost with the filtration and draining of the fuel oil system which is considered negligible here.
4.3 Shortage of supply to ship during bunkering
To ensure exact quantity received during bunkering is a challenging task for ship’s crew. In reality, the supplier’s quantity may be claimed higher than the vessel’s measured quantity. Declaring FO temperature less than the correct temperature, higher density, the cappuccino effect, injecting excessive water, falsifying soundings, delivering excessive quantity of solid sludge, are among many ways of how the bunkered fuel amount can be “cheated” during the bunkering operation. Ship’s crews often discover the shortage later when the BDN is signed. By that time, it is too late to recover the shortage. Sometimes, the entire process is so complicated that ship’s crew is tempted to adjust the short quantity by declaring more consumption during the part of their voyage or adjust from a previously undeclared quantity in hand. Occasionally, a significant amount of BDN quantity is lost due to fraudulent act of supplier to the vessel. From the expert’s opinions on the bunkering operation, it can be estimated that a 5 ton of FO quantity mismatch is common for a 500 tons FO bunkering. Therefore, according to the above about 1% of oil from the BDN quantity falls short due to misconduct in the bunkering process. However, this it varies from country to country and port to port. Therefore, from expert’s opinion, it is suggested that the quantity mismatch or data error in this case will be about 1.69% (Source: Estimation from the content of impurities in oil according to ISO8217 and short supply during bunkering).
4.4 Error with Measurement of Bunker Tank
consumption and stock assessment everyday (Marine insight, 2017). Manual soundings of the fuel tanks are the most common for assessing the tank content. The accuracy of the measurement by manual soundings is considered erroneous as it depends on various factors such as the stability condition of ship, shape of tanks and trueness of sounding pipe, measuring tape, knowledge of the person performing the task as well as state of sea, as a vessel’s movement can cause erratic and wrong readings. Looking at the technology use, the bubbler type of level gauges is widely used for the measurement of bunker tanks. In many ships, the capacitance-type level gauges and electrically-powered servo operated gauges are also used. However, a certain degree of error exists with all these devices used for tank level measurements. Regular calibration and testing of the tank monitoring devices is necessary for reducing the error margin. Moreover, during the storage and treatment of various processes such as evaporation, filtration and purification of the fuel oil, this could produce a mismatch of the quantity which actually gets consumed in the engine and poses about 0.69% (as described in section 4.1) of the fuel oil loss in the process. Two or more gauging systems are employed simultaneously to ensure accuracy and reduce wrong soundings.
4.5 Flowmeter as a Source of Error
Figure 9: Marine Fuel Oil Flow meter, Source: KRAL
In accordance with the IMO, NOx technical code fuel consumption monitoring devices permissible deviation could be +2% of the engine’s maximum value (IMO, 2017). To ensure data accuracy and efficient collection and storage of data, vessel operators need to ensure installations, regular calibrations and maintenance of the flowmeter to be carried out as per the regulations.
4.6 Error with Exhaust Gas Uptake Measurement Devices:
The exhaust gas emission of the CO2 measurement is applicable to the EU-MRV system where probes fitted on the exhaust uptake of engine directly measure the quantity of CO2 emissions for a particular time period. Some manufacturers for this instrument provides a real time online monitoring system which gives the operator one stop solution for data collection, storage and reporting software and multiple communication options.
Figure 10: Data exchange process for Exhaust Gas Monitoring Device, Source: Consilium
According to the NOx technical code, the exhaust gas flow measuring monitoring instrument permissible deviation could be +2.5% of the engine’s maximum value (IMO, 2017).
4.7 Documentation for Recording Fuel Consumption
is extremely necessary. Thus, eliminating the errors from the use of conventional Engine room log book and Chief engineer’s log abstract could aid the implementation of MRV process.
4.7.1 Engine Room Log book
The Engine Log Book is an important legal document which is maintained on board ship with utmost care as daily activities are recorded in a log book. As per the International Safety Management Code (ISM), a log book needs to be stored for five years. A responsible marine engineer watch-keeper needs to fill up the log book diligently in his/her watch to record machinery operational parameters, fuel oil and lubricating oil flowmeters readings, various tanks’ daily soundings and the instructions and maintenance are entered in-brief on daily basis. Snapshots of all the activities onboard a ship are available in the Log book which is a great tool for the assessment of the engine performance. It is necessary to analyze the contents of the log book for data related to the MRV for the further integration of the collection of relevant data for effective implementation and analysis of the gap in data collection. The accuracy of the data depends on the person involved, however, it remains as a source of inaccurate and fraudulent data. The highlighted portion of the log book pages and parameters in Appendix 2 represent relevant parameters which are used for the calculation of fuel consumption for the MRV process. The main and auxiliary engine running hours, FO temperature, FO consumption, FO tanks’ sounding for quantity retaining on board, include distance travelled and time under way, for the ‘’cargo quantity carried’’ which is not entered in the engine log book.
4.7.2 Chief Engineer’s Log Abstract
dynamic and stationary data in every occasion as they occur. A recent copy of the vessel’s CELA, maintained by an anonymous company, is added in Appendix 3 of this paper. Reading the provided information in Appendix 3, it is evident that the data required for MRV could be extracted from this document. It is also apparent that the ship’s crew has to insert the same data in several places on every occasion; as noted that Engine Room Log Book and CELA contains exactly the same information in many cases, especially regarding the data related to MRV. This repetition can be eliminated by introducing efficient processes of data collection. However, the vessel’s owner has to prove to the verifier the authenticity and reliability of data what will be reported to the MRV database. The manual input of data and transmission in the company’s specified non-standard format poses the risk of fraudulent tampering and manipulation of the data.
4.8 Summary
Chapter V
An Evaluation of the Shipping Industry’s Readiness to the MRV
5.1 Overview
A survey question describes more as it is not a general inquiry. The attitude, attributes, behavior, and belief of each respondent could be determined by the sample of survey questions by the surveyor which also serves as a tool for the surveyor (Dillman, 2007). Answers of the questions in the questionnaire help to diagnose or reach in a decision on the basis of the outcome. The principle motivation of the survey was to reveal the potential barriers, gap and industry’s standpoint with regards to the implementation of the upcoming shipping MRV regulations of the IMO and EU. As such, the survey was divided into five groups: General, Policy, Technological Standpoint, Human
Perspective and Ensuring Data Quality. Each section was customized with a limited number of
questions, maintaining simplicity, cohesiveness, focus, and depth of the question towards finding the situation of the industry without compromising the quality of the questionnaire. This survey’s questions were carefully constructed to understand the present status of the shipping industry with respect to energy efficiency, determining the barriers for the implementation of the MRV.
5.2 Discussion on Questions of the Survey Questionnaire
5.2.1 Group A: General
In this section recipients were asked some general questions about themselves to assess the credibility, validity, reliability and weight of the answers provided by them. The questions were asked to reveal their position in shipping sectors, age, gender and academic qualifications.
providers (n=2, 2.74%), Classification society surveyors (n=2, 2.74%), Pilots (n=1, 1.37%), Marine Surveyors (n-1, 1.37%), Flag administrators (n=1, 1.37%) etc. The demographic profile of the participants displays that all participants are in middle or later stage of their career, which a degree of reliability, validity, and credibility of the responses is reasonably guaranteed. None of the participants were below 25 years of age; 50% are between 35 and 45 years; over 66% of them are more than 35 years; and 16% are more than 45 years of age. Moreover, it was evident that many participants possess high educational qualifications as 40% are with Masters’ or above, 47% Bachelor’s degrees, and the rest was either Master mariner or Certificate of competency (Class 1) holders.
5.2.2 Group B: Policy Perspective
(How are the shipping companies getting ready, setting up policy and strategy, prior kicking off IMO’s Data Collection System (MARPOL ANNEX-VI, Reg-22A) and EU MRV (Reg. 2015/757) System?)
Operational and compliance issues ISO (International Organization for Standardization) is a global organization for standardization which sets standard for various discipline. ISO 9001, ISO14001 and ISO50001 are very important for shipping companies to operate with excellence and reputation. Recently many shipping company subscribe to the standards for goodwill, reputation and profitability. Any company subscribing to these standards will have better system in place and will face less hindrance implementing MRV regulation.
Figure 11: Use of international Standard in a company
About 49% of the respondents’ organizations meet the ISO14001: 2015 (Environmental management) standard; the organizations activities are monitored, controlled and environmental impacts are minimized by complying this standard. Energy Management System standards, ISO 50001:2011 is still making way into the industry as 34% of respondents’ organization are meeting this standard. Others are involved with IMO regulation or ISM regulations, where none of these International standards are followed which constitutes about 4% of the population.
ISO50001 requires organizations to monitor, measure and analyze their energy performance at planned interval (ISO, 2017) which could be a perfect platform for easy implementation of MRV system. Therefore, we could see that energy management system still need to be adopted in a great extent by the shipping sectors.
Recently, many reputed companies have prioritized Energy efficiency and importance has given to energy management system, it is even Energy efficiency as their corporate goals and objectives beside health, safety security and environment equally. These organizations are frontrunner and will have easy adoption of MRV system. In this question, it was possible to select multiple answers and respondents given their opinion as below.
Institutional issues Energy efficiency became a matter of great importance in the maritime industry, as about 55% of the respondents have stated that Energy efficiency is included in their
54 36 25 3 72.97 48.65 33.78 4.05
0 10 20 30 40 50 60 70 80
ISO 9001: 2015 (Quality) ISO 14001: 2015 (Environment) ISO 50001: 2011 (Energy) Others
Q7: Does your company operate according to the requirements and guidelines of the International Standards, such as-?
quality management system. A step ahead, about 35% of the respondents’ organizations have incorporated in corporate goals and objectives.
Figure 12: Inclusion of Energy Efficiency Measures
About 7% of the population mentioned that the Energy efficiency measures exist in their organizations as SEEMP as cost effective measures. However, a significant number, about 22%, mentioned that the Energy efficiency is not included in their organization in any form. These organizations will face as they will lack in policy, organization structure and developing framework for implementation of Energy efficiency measures as well as MRV system.
Management Issues Having a dedicated Energy Management Team will ensure companies all energy related issues to control efficiently with better monitoring capability. The ability of data collection, storage and analysis will be enhanced which will also create a smooth pathway for adoption of MRV system.
In this study, it is observed that about 44% of the respondents mentioned that dedicated energy management team exist in their organizations where 55% mentioned that no separate energy management team exists in their company.
26
41 16
5
35.14
55.41 21.62
6.76
0 10 20 30 40 50 60
The company’s corporate goals and objectives
Quality Management System Not included at all. Other
Q8: Is Energy Efficiency included in any of the followings in your company?