RESEARCH ARTICLE
QUALITATIVE ANALYSIS OF HUMAN EMOTIONS AND ITS PERFORMANCE EVALUATION
Sayantani Ghosh and *Prof. Samir Kumar Bandyopadhyay
Department of Computer Science and Engineering, University of Calcutta, India
ARTICLE INFO
ABSTRACT
Human Emotion Detection based on facial expression is a task that can be effortlessly and consistently fulfilled by humans given a set of human images. However recent study has revealed the fact that computers are equally capable of accomplishing the same task with notable accuracy. In this paper an attempt has been made to detect various Human Emotions based on the facial expressions, analyse and classify them with the support of the well-known classifiers like Support Vector Machine Classifier and Neural Network Classifier. The main objective is to perform a comparative analysis of the performance of the above specified classifiers in accomplishing the task of emotion detection and its classification. The human emotions that has been studied for the analysis and classification are (1) Neutral Expression (2) Happy Expression (3) Sad Expression (4) Sleepy Expression (5) Surprised Expression and (6) Winked Expression.
Copyright © 2016Sayantani Ghosh and Prof. Samir Kumar Bandyopadhyay. This is an open access article distributed under the Creative Commons Attribution License, which permits unrestricted use, distribution, and reproduction in any medium, provided the original work is properly cited.
INTRODUCTION
Emotion can be stated as a mental state which arises spontaneously without any conscious effort and is often accompanied by physiological changes. Human beings possesses variety of emotions which is expressed effortlessly through different course of actions like the emotions of joy, sorrow or anger. Emotions are also expressed in face, voice or in different parts of body gesture. Therefore one of key mechanism to identify human emotion is by the realization of the changes of the facial expression in human faces when he/she goes through an emotional phase. A recent study on this field has proved that verbal speech contributes to 7% to the effect of the message as a whole, the vocal part contribution is 38%, while facial expressions contributes for 55% to the effect of the speaker’s message. Although it is difficult to provide a concrete definition of human emotion, yet it is undeniable that emotions are an integral part of our existence. In this paper an attempt has been made to detect the various human emotions as stated above. The identified emotions are then classified into one of the six predefined class labels. In this case, the classifiers used are Support Vector Machine Classifier and Neural Network. The main objective is to perform a comparative analysis of the performance of the above mentioned classifiers in achieving the goal of human emotions detection and their classification into different class labels.
Neural Network
A neural network is a parallel distributed processor made up of simple processing units which has the capability of storing experiential knowledge. Artificial neural network (ANN) is a type of Artificial Intelligence technique that can be used to simulate the behaviour of the human brain.
Artificial Neural Network can be classified into two major categories:
(1) Feed-Forward Network - A network with no loops. One such network is the Layered network in which neurons are organized
into layers with connections strictly in one direction from one layer to another.
The most common form of Feed- Forward Network is the Multi- Layered Perceptron Network.
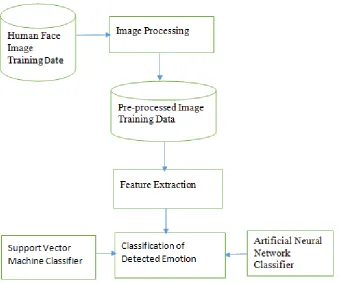
The diagrammatic representation of the primitive steps involved in Emotion Detection and its classification has been depicted in the following flow diagram:
*Corresponding author: Prof. Samir Kumar Bandyopadhyay,
Department of Computer Science and Engineering, University of Calcutta, India.
ISSN: 0976-3376
Vol.07, Issue, 03, pp.2606-2617, March,Asian Journal of Science and Technology 2016Available Online at http://www.journalajst.com
ASIAN JOURNAL OF
SCIENCE AND TECHNOLOGY
Article History:
Received xxxxxx, 2015 Received in revised form xxxxxxxxxxxxx, 2015
Accepted xxxxxxxxxxxxxxx, 2015 Published online xxxxxxxxxxx, 2016
Article History:
Received 21st December, 2015
Received in revised form
16th January, 2016
Accepted 20th February, 2016
Published online 31st March, 2016
Key words:
Fig. 1. Steps involved in Emotion Classification
A brief review of the above mentioned classifiers have been discussed in the following section:
In this type of network neurons in input layer act as buffers for distributing the input signals xi (i=1, 2 ...n) to neurons in the hidden layer. Each neuron j as in Fig 1. in the hidden layer sums up its input signals xi after weighting them with the strengths of the respective connections wji from the input layer and computes its output yj as a function f of the sum.
yi=∑
f can be a simple threshold function or a sigmoidal, hyperbolic tangent or radial basis.
Finally, the output of neurons in the output layer is computed.
One of the well-known and widely used MLP training algorithm is the Back propagation Algorithm. (http://www. tutorialspoint.com/artificial_intelligence/artificial_intelligence_neural_networks.htm)
It is a training or learning algorithm. This algorithm has the capability to change weight Wji between neurons i and j so that the desired output can be obtained for the given set of input.
Here,
η denotes the parameter called the learning rate
j denotes a factor which determines whether neuron j is a input neuron or a hidden neuron
For the output neuron
where,
netj denotes the total weighted sum of input signals to neuron j avd
yj (t)
denotes the target output for neuron j.
(2) Feedback / Recurrent Network-
artificial_intelligence/artificial_intelligence_neural_networks.htm
Design of Artificial Neural Network Model
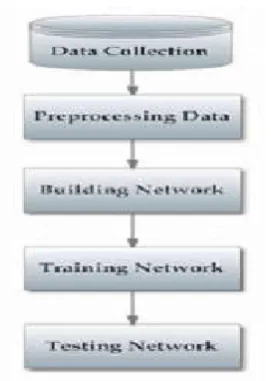
The procedures involved in designing an Artificial Neural Network is specified in the following Flow diagram:
1. Data Collection - In the first step, the data collection procedure is performed where data are collected and prepared according to the problem specification.
2. Pre-processing Data - Data Pre-processing requires following missing data. (2) Normalize data. (3) Lastly Randomize data.
3. Building Network - In order to build the network, the designer is required to
(1) The number of hidden layers, (2) Neurons bias learning function, and (6) Performance
4. Training Network - During the training process, the weights are adjusted to make the difference of the actual (predicted) output to the target (measured) outputs of the network negligibly small.
5. Testing Network- At the final stage the performance of the unknown data set.
2608 Asian Journal of Science and Technology
η denotes the parameter called the learning rate
denotes a factor which determines whether neuron j is a input neuron or a hidden neuron
denotes the total weighted sum of input signals to neuron j avd
A network where one or more loop exist. artificial_intelligence/artificial_intelligence_neural_networks.htm)
work Model
The procedures involved in designing an Artificial Neural Network is specified in the following Flow diagram:
In the first step, the data collection procedure is performed where data are collected and ng to the problem specification.
processing requires following procedures to be implemented diligently. (1) Replacement of missing data. (2) Normalize data. (3) Lastly Randomize data.
d the network, the designer is required to specify the information which includes mentioning
Neurons in each layer, (3) Transfer function in each layer, (4) Performance function.
During the training process, the weights are adjusted to make the difference of the actual (predicted) output to the target (measured) outputs of the network negligibly small.
At the final stage the performance of the developed model is tested by causing the model to operate on the Asian Journal of Science and Technology Vol.07, Issue, 03, pp.2606-2617, March,2016
(http://www.tutorialspoint.com/
The procedures involved in designing an Artificial Neural Network is specified in the following Flow diagram:
In the first step, the data collection procedure is performed where data are collected and
procedures to be implemented diligently. (1) Replacement of
specify the information which includes mentioning
function in each layer, (4) Training function, (5)Weight/
During the training process, the weights are adjusted to make the difference of the actual (predicted) output
Fig.
Support Vector Machine
A Support Vector Machine is a learning algorithm for pattern classification and regression. The basic training principle behi SVMs is finding the optimal linear hyper plane such that the expected classification error for unseen test samples is minimiz i.e., good generalization performance. (http://www.cs.utexas.edu/~grauman/courses/378/handouts/moghaddam2000.pdf
an algorithm for maximizing a particular mathematical function with respect to a given collection of data. The basic SVM takes a set of input data and predicts, for each given input, which of two possible classes forms the output, making it a non
binary linear classifier. A support vector machine constructs a hyperplane in a high dimensional space, which can be used for classification and regression. A good separation is achieved by the hyperplane that has the largest distance to the nearest t data set. SVM separates the dataset into training and testing data sets, where each sample in the training set contains one target value and observed features. SVM classifiers generate a decision boundary based on the training data set, which
predicting the target value of the testing dataset.
Fig. 3.
The black circles points and the white circle points represent class +1 and and maximizes the margin.
Literature review
I Human Facial Emotion Recognition Based on Neural Network
The identification ofemotions from a human facial image provides a way of recognizing several crucial physical features of a like wrinkles on the forehead, size of eyebrows, colour of the skin, etc., and the corresponding sizing and location.
researchgate.net/profile/Javier_Francisco_Razuri/publication/261448510_Automatic_Emotion_Recognition_through_Facial_Expr ession_Analysis_in_Merged_Images_Based_on
research work have been performed on this field, on the basis of which it has been considered that the neural network is accu for the acquisition of nonlinear mapping between dif
features of a face and its impression. The potential of the Neural classification into a single basic emotion ca
2609 Asian Journal of Science and Technology
2. Phases of artificial neural network classifier
A Support Vector Machine is a learning algorithm for pattern classification and regression. The basic training principle behi SVMs is finding the optimal linear hyper plane such that the expected classification error for unseen test samples is minimiz
http://www.cs.utexas.edu/~grauman/courses/378/handouts/moghaddam2000.pdf
mathematical function with respect to a given collection of data. The basic SVM takes a set of input data and predicts, for each given input, which of two possible classes forms the output, making it a non
vector machine constructs a hyperplane in a high dimensional space, which can be used for classification and regression. A good separation is achieved by the hyperplane that has the largest distance to the nearest t
taset into training and testing data sets, where each sample in the training set contains one target SVM classifiers generate a decision boundary based on the training data set, which
testing dataset. (Chandra Kamal Sinha)
Fig. 3. The optimal hyper plane separating two classes
The black circles points and the white circle points represent class +1 and -1. A hyper plane separates the data class of +1 and
Human Facial Emotion Recognition Based on Neural Network
The identification ofemotions from a human facial image provides a way of recognizing several crucial physical features of a of eyebrows, colour of the skin, etc., and the corresponding sizing and location.
researchgate.net/profile/Javier_Francisco_Razuri/publication/261448510_Automatic_Emotion_Recognition_through_Facial_Expr ession_Analysis_in_Merged_Images_Based_on_an_Artificial_Neural_Network/links/54b7869a0cf2bd04be339d2c.pdf
research work have been performed on this field, on the basis of which it has been considered that the neural network is accu for the acquisition of nonlinear mapping between different sets of data, as it allows to decode the relationship between the physical features of a face and its impression. The potential of the Neural-network-based methods is the performance of facial expression classification into a single basic emotion category. The sort of selection in six basic emotions using Neural
rnal of Science and Technology Vol.07, Issue, 03, pp.2606-2617, March,2016
A Support Vector Machine is a learning algorithm for pattern classification and regression. The basic training principle behind SVMs is finding the optimal linear hyper plane such that the expected classification error for unseen test samples is minimized — http://www.cs.utexas.edu/~grauman/courses/378/handouts/moghaddam2000.pdf) SVM is mathematical function with respect to a given collection of data. The basic SVM takes a set of input data and predicts, for each given input, which of two possible classes forms the output, making it a non-probabilistic vector machine constructs a hyperplane in a high dimensional space, which can be used for classification and regression. A good separation is achieved by the hyperplane that has the largest distance to the nearest training taset into training and testing data sets, where each sample in the training set contains one target SVM classifiers generate a decision boundary based on the training data set, which helps in
1. A hyper plane separates the data class of +1 and -1
The identification ofemotions from a human facial image provides a way of recognizing several crucial physical features of a face of eyebrows, colour of the skin, etc., and the corresponding sizing and location. (http://www. researchgate.net/profile/Javier_Francisco_Razuri/publication/261448510_Automatic_Emotion_Recognition_through_Facial_Expr
_an_Artificial_Neural_Network/links/54b7869a0cf2bd04be339d2c.pdf) Several
research work have been performed on this field, on the basis of which it has been considered that the neural network is accurate ferent sets of data, as it allows to decode the relationship between the physical based methods is the performance of facial expression tegory. The sort of selection in six basic emotions using Neural-network-based
methods was proposed in the work of (Kobayashi and Hara, 1997), where, the units of the input to the ANN correspond to the brightness distribution data extracted from an input static image. The average recognition rate was 85 percent in a group of 90 tested images. This methodology was later enhanced by integrating the ANN with a hybrid approach, (Hu et al., 2002) where the ANN was combined with Hidden Markov Models (HMMs) , was employed in facial emotion and finally the classified result was obtained. This analysis used an ANN to estimate the posterior for the discriminant HMM, and it achieved positive results on the recognition of emotion in the upper and lower parts of an image separately. It used the Principal Component Analysis to analyse the principal facial regions, then the neural network classifiers were built in a group of fifteen neural networks. (Filko and Martinovic, 2013) Amongst fifteen neural network, one ANN was used for region detection and the other fourteen were used to recognize seven universal emotions over eyes and mouth regions. This experimentation yielded an accuracy result of upto 46 % to 80% rate. Moreover, a similar research work was percolated with the use of Multilayer Feed-forward Neural Networks and a
Radial Basis Function Networks, commonly used in nonlinear mapping approximation and pattern recognition. (Gargesha et al.,
2002) The objective of the research was to classify seven primitive type of emotions: Neutral, Happiness, Sadness, Anger, Fear, Surprise and Disgust. The Euclidean distances from the contour point in the static image was calculated which along with the geometric coordinates from facial characteristics points represented the set of data input into the neural network. This approach was then tested with the set of images from the JAFFE database and it reached 73% of accuracy. Projections of feature regions on a fixed filterset of images was proposed in this model, in which the inputs were grouped based on the features of the facial expressions. (Padgett et al., 1996) The network model consisted of11 feed-forward networks, it consisted of 105 inputs per network and each network included hidden layers consisting of 10 nodes. Each network was trained with online back propagation. The outputs of each network were combined to produce a percentage value for the classification of each emotion.
II Human Facial Emotion Recognition based on Support Vector Machine Classifier
Human Facial Emotion Recognition (HFER) can be defined as a response of the human to the change in the environment that has eventually resulted in the change of human state of mind. (http://www.ijcttjournal.org/Volume17/number-4/IJCTT-V17P131.pdf) Automatic Emotion Recognition has proved to be an assertive task and has therefore attained substantial amount of attention in recent years. Mehrabian et al. have shown that facial expression contributes 55% to the total communication. While vocal and verbal contributes 38% and 7% respectively. (Mehrabian, 1968) Ekman and Frisen have also contributed in this field of research work. They have identified the six primitive human emotions as specified above (Ekman and Friesen, 1978). The goal of the research was to develop an automated and interactive computer vision system for the recognition of human facial expressions. Besides this, according to Anastasios et al. Facial Expression Detection approach (Anastasios et al., ?) three primephase which includes pre-processing, facial feature extraction and classification of the detected emotions into predefined set of class labels.
Proposed methodology for emotion detection / classification using neural network and support vector machine
In this section we shall altercate on the technique being adapted and the procedures that has been followed to attain the objective of evaluating the performance of the stated classifiers in classifying the detected emotions into predefined class labels.
Generalized Flow Diagram of the Proposed Methodology
Step 2: Generate Grey Scale version of the Individual Image. Step 3: Perform Histogram Equalizationon each facial image.
Step 4: Using ROI principle perform the feature extraction from the discrete image Step 4.1: For each image in the image set perform the following steps:
Step 4.1.1: Extract the Left Eye, Right Eye and Lip Region.
Step 4.1.2: Compute the Euclidian distance between the mid- point of the left eye and the lip and the mid –point of the right eye and the lip.
Step 4.1.3: Reshape discrete extracted image from 2D to 1D.
Step 4.1.4: Associate a class label with each extracted image based on the emotion type (i.e. if there are six variety of emotions, class labels will vary from 1 to 6).
Step 4.1.5: Generate a Feature Vector containing the extracted images along with the Class labels. End
Step 5: Shuffle the Feature Vector Matrix.
Step 6: Cross Validate the Resultant Matrix to generate the train data set and the test data set. Step 7: Generate a train vector by training the train data set using a suitable classifier. Step 8: Implement testing on the unexplored test data set.
Step 9: Retrieve the resultant classified data set. Step 10: End.
Implementation
The proposed model has been implemented using the MATLAB routine of the libSVM 3.18 toolbox. (http://www.csie. ntu.edu.tw/~cjlin/libsvm)
A set of 90 JPEG images has been chosen as the Input Data Set which comprises of a subset of 15 images for each emotion i.e neutral, happy, sad, surprised, winked and sleepy. The image set is composed of the facial images of both male and female. The individual image is of capacity 128 * 115.
The Input Data Set is subjected to primitive phases of Image Processing i.e (1) Pre- Processing. (2) Feature Extraction and Emotion Identification. (3) Data Classification. Each of these phases has been discussed as follows:
(1)Pre- Processing: The image set is pre-processed to eliminate noise in order to enhance the visual appearances of images. In
this case we have performed Histogram Equalization. This technique adjusts the intensities of an image to enhance the contrast of the image.
(2)Feature Extraction and Emotion Identification:As features of an image critically defines the behaviour of an image,
therefore feature extraction play a crucial role in recognition and classification of images. Depending on the problem definition, different feature(s) can be extracted from an image.
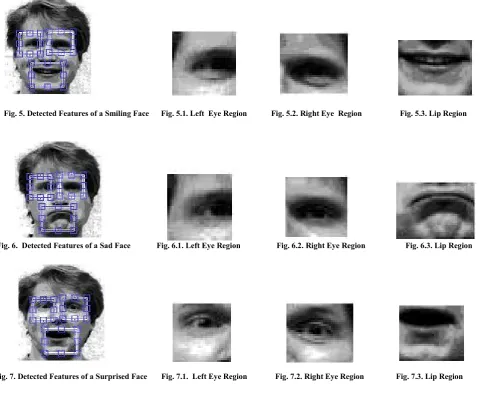
In this case, the ROI principle has been used to extract ‘lip’, ‘left eye’ and ‘right eye’ from a facial image. A specific window dimension is selected to identify the location of the desired feature.
Once the feature has been detected, it is extracted using the Matlab function imcrop().
The Euclidian distance is then computed between the mid-point of the two eye region and the lip region. Each extracted feature from individual image is then resized to one dimensional vector.
A matrix is generated which comprises of the features of the training images in its columns along with the class labels which is associated with each image. A distinct class label between 1 to 6 is assigned to each image to distinguish between the different emotions.
Fig. 5. Detected Features of a Smiling Face Fig. 5.1. Left Eye Region Fig. 5.2. Right Eye Region Fig. 5.3. Lip Region
Fig. 6. Detected Features of a Sad Face Fig. 6.1. Left Eye Region Fig. 6.2. Right Eye Region Fig. 6.3. Lip Region
Fig. 7. Detected Features of a Surprised Face Fig. 7.1. Left Eye Region Fig. 7.2. Right Eye Region Fig. 7.3. Lip Region
Fig. 8. Computation of Euclidian Distance between the Eyes and the Lip Region
Shuffling
The Feature Vector comprising of the feature of the image along with the class label is shuffled. The resultant matrix is then subjected for further processing. The objective of Shuffling is to raise the accuracy percentage of the final result.
Cross Validation: In order to generate an appropriate train data set and test data set dynamically, cross validation technique is
employed. The utility of this technique depend on its ability to identify a good value of (C,ϒ) so as to predictthe unknown data set (i.e the test set). (http://www.csie.ntu.edu.tw/~cjlin/papers/guide/guide.pdf)
Besides this, the over fitting problem of an image is also overcome by employing a suitable cross- validation technique.
The different methods of this technique is discussed in the table mentioned below:
Table 1. Listing of Cross Validation Techniques
S.No Cross Validation Technique Explication Advantages Disadvantages
1. Hold Out It divides the data set into two equal subsets
i.e train set and test set. The function approximation fits a function using the training set.
Low Computation Time The evaluation result and its accuracy
is critically dependent on the division of data points.
2. K- fold The data set is divided into ‘K’ subsets. At
each iteration one set is chosen as the test set and the remaining ‘K-1’ set is chosen as the train set.
The evaluation result is not directly dependent on the division of the data points. The variance of the
resulting estimate is
reduced as ‘k’ is
increased.
Computation Time is high as the, as the training algorithm has to be run ‘k-1’ times for ‘k-‘k-1’ train set.
3. Leave one out Here, the ‘K’ of K- fold cross validation
technique, K equals N, where ‘N’ is the no of data points. Thus at N separate times, the function approximation is trained on all the data except for one point and a prediction is made for that point.
The evaluation error is good.
It is computationally expensive.
(http://www.cs.cmu.edu/~schneide/tut5
/node42.html)
In the proposed methodology, the shuffled matrix has been cross- validated to choose appropriate data points for train set and test set. Among the discussed techniques, Hold-Out Cross- Validation has been implemented on the shuffled feature vector. The accuracy percentage varied with these two technique.
(3)Data Classification: In this phase the classified data set is generated by implementing a suitable classifier on the cross
validated data (i.e train set) which is further utilized to predict the accuracy percentage of the unknown data points.
Data Classification using Neural Network
At first create a feed- forward Multilayer Perceptron (MLP) by invoking the Matlab routine newff(). This routine will read as input the train set and the number of neurons to be present in the hidden layer. On the created network Back propagation Algorithm is implemented to obtain the final classified data points. To attain the final result, the spawned network is first trained using the function train(). The outcome of this function is a trained record and a new trained network. The trained network is then simulated and the unknown data points are tested using the Matlab routine sim(). This routine will return the final classified data set as the final result.
Data Classification using Support Vector Machine
The train set is trained by invoking the ‘svmtrain ()’ routine, of the libSVM toolbox (http://www.csie.ntu.edu.tw/~cjlin/libsvm). The unknown data points with the trained model are then passed as parameters to the svmclassify ()’ routine of the libSVM toolbox () (http://www.csie.ntu.edu.tw/~cjlin/libsvm). The outcome of this MATLAB routine is the class labels of the tested data points. Based on the output labels, the accuracypercentageof the defined methodology is determined.
RESULTS
This section validates the implementation of the proffered methodology as conferred in the previous sections. The input image seton which the proposed algorithm has been implemented are JPEG images read from different websites. This input sethave been converted into Gray Scale version, the designed algorithm is then evaluated on this image set. The experiment is performed using the MATLAB routine of lib SVM 3.18 (http://www.csie.ntu.edu.tw/~cjlin/libsvm) toolbox with an objective of classifying the various human emotions. The Experimental Result includes the computation of (a) ACCURACY (b) SENSITIVITY and (c) SPECIFICITY ofthe input set. These calculations have been performed in the following way:
Accuracy= (TP+TN)/ (TP+TN+FP+FN). Sensitivity= (TP)/ (TP+FN).
Specificity = (TN)/ (TN+FP).
The results obtained from the experiment are discussed below:
Specifications:
Total Input Images: 90 (Gender Unspecified) Images with Emotion Type i.e Happy: 15 Images with Emotion Type i.e Neutral: 15 Images with Emotion Type i.e Sad: 15 Images with Emotion Type i.e Sleepy: 15 Images with Emotion Type i.e Surprised:15 Images with Emotion Type i.e Winked: 15
Image Type: Frontal Facial Images (JPEG Images). Extracted features: Left Eye, Right Eye, Lip.
Emotion Classification Parameter: Euclidian Distance between Lip and Eyes Region.
Result of Computation of Euclidian Distance between Eyes and Lip Region
Table 2. Confusion Matrix depicting the Euclidian Distance between the Lip and the Eye Region
S.No Type of Emotion Euclidian Distance between Left Eye and Lip Euclidian Distance between Right Eye and Lip
1. Happy 28.6356 36.8782
2. Sad 28.2312 36.7696
3. Sleepy 26.4622 35.4683
4. Surprised 29.6816 38.2099
5. Neutral 27.2029 32.8024
6. Winked 26.5707 36.7696
Result of Emotion Classification using Support Vector Machine Classifier
Table 3. Confusion Matrix depicting the output class labels of the Classified Emotions using SVM.
S.No. Cross Validation
Technique Train Set Test Set
Emotion
Type Output Class Labels
1. Hold Out 46 44 Happy 0,0,0,0,0,0,0,0,0,0,1,0,1,0,0,0,0,0,0,0,0,0,1,0,0,0,0,0,0,0,0,1,0,0,0,1,1,0,0,0,0,0,0,0
1.1. Hold Out 45 45 Happy 0,0,0,0,0,0,1,0,0,0,0,0,0,0,0,0,0,0,0,1,0,0,1,0,0,1,0,0,1,0,1,0,0,0,0,0,0,0,0,0,0,0,0,0,0
2. Hold Out 46 44 Neutral 0,0,0,0,0,0,0,0,0,0,0,0,0,1,1,0,0,0,0,0,0,0,0,1,0,0,0,0,1,0,0,0,0,1,1,0,0,0,0,0,0,0,0,0
2.1 Hold Out 45 45 Neutral 1,0,0,0,0,0,0,0,0,0,0,1,0,0,0,0,0,0,0,0,0,0,0,0,0,0,0,0,0,0,0,1,1,0,0,0,0,1,0,1,0,0,0,1,0
3 Hold Out 46 44 Sad 0,0,1,0,0,0,0,1,0,0,0,0,0,0,0,1,0,0,0,0,0,0,0,0,0,0,0,0,0,1,0,0,0,0,0,0,0,0,0,1,0,0,0,0
3.1 Hold Out 45 45 Sad 0,1,1,0,0,0,0,0,0,0,0,0,0,0,0,0,1,0,0,0,0,1,0,0,0,0,1,0,0,0,0,0,0,0,0,0,0,0,0,0,0,0,0,0,0
4 Hold Out 46 44 Sleepy 0,1,0,0,0,0,1,0,0,0,0,0,0,0,0,0,0,0,0,1,0,0,0,0,0,1,0,0,0,0,1,0,1,0,0,0,0,0,0,0,0,0,0,0
4.1 Hold Out 45 45 Sleepy 0,0,0,0,0,1,0,1,0,0,0,0,1,0,0,1,0,1,1,0,0,0,0,0,1,0,0,0,0,0,0,0,0,0,0,0,0,0,0,0,0,0,0,0,0
5 Hold Out 46 44 Surprised 1,0,0,1,0,1,0,0,1,0,0,0,0,0,0,0,0,0,0,0,0,0,0,0,1,0,0,0,0,0,0,0,0,0,0,0,0,1,0,0,1,0,0,0
5.1 Hold Out 45 45 Surprised 0,0,0,1,0,0,0,0,1,0,0,0,0,0,0,0,0,0,0,0,1,0,0,1,0,0,0,0,0,1,0,0,0,0,0,0,1,0,0,0,0,0,0,0,0
6 Hold Out 46 44 Winked 0,0,0,0,0,0,0,0,0,1,0,1,0,0,0,0,0,0,0,0,0,1,0,0,0,0,1,1,0,0,0,0,0,0,0,0,0,0,0,0,0,1,1,0
6.1 Hold Out 45 45 Winked 0,0,0,0,0,0,0,0,0,1,1,0,0,0,0,0,0,0,0,0,0,0,0,0,0,0,0,1,0,0,0,0,0,0,0,0,0,0,1,0,0,1,0,0,1
Table 4. Confusion Matrix depicting the performance of SVM in Emotion Classification
S.No. Emotion Type True Positive
(TP) True Negative (TN) False Positive (FP) False Negative
(FN) Accuracy Sensitivity Specificity
1. Happy 6 37 1 0 97.7273 100 97.3684
1.1. Happy 6 38 1 0 97.7778 100 97.4359
2. Neutral 6 35 0 3 93.1818 66.6667 100
2.1. Neutral 6 38 1 0 97.7778 100 97.4359
3. Sad 5 38 0 1 97.7273 83.3333 100
3.1 Sad 5 36 0 4 91.1111 55.5556 100
4. Sleepy 6 37 0 1 97.7273 85.7143 100
4.1. Sleepy 7 37 0 1 97.7778 87.5000 100
5. Surprised 7 37 0 0 100 100 100
5.1 Surprised 6 39 0 0 100 100 100
6. Winked 7 36 0 1 97.7273 87.5000 100
6.1 Winked 6 36 0 3 93.3333 66.6667 100
Result of Emotion Classification using Neural Network Classifier
Table 5. Confusion Matrix depicting the output class labels of the Classified Emotions using ANN.
S. No. Cross Validation
Technique Train Set Test Set
Emotion
Type Output Class Labels
1. Hold Out 46 44 Happy 0,0,0,0,0,0,1,1,1,1,0,0,0,0,0,0,0,0,1,1,1,1,1,1,0,0,0,0,0,0,1,1,1,1,1,1,1,1,1,1,1,1,1,1
1.1. Hold Out 46 44 Happy 0,0,0,0,0,0,1,1,1,1,0,0,0,0,0,0,0,0,0,1,1,1,1,1,1,1,1,1,1,1,0,1,1,1,1,1,0,0,1,1,1,1,0,0
2. Hold Out 46 44 Neutral 0,1,1,1,1,1,1,1,1,1,0,0,1,1,1,1,0,1,1,1,1,1,1,1,0,0,0,0,0,0,0,0,1,1,1,1,0,0,0,1,1,1,1,0
2.1 Hold Out 46 44 Neutral 0,0,0,0,0,1,1,1,1,1,1,1,0,0,0,0,0,0,0,0,0,0,0,0,1,1,1,1,1,1,1,1,1,1,1,0,0,0,0,0,0,1,1,1
3 Hold Out 46 44 Sad 1,1,1,1,0,0,0,0,0,0,0,1,1,1,1,1,1,1,1,1,0,0,1,1,1,1,1,1,1,1,0,0,0,0,0,0,0,0,0,0,0,0,1,1
3.1 Hold Out 46 44 Sad 0,0,0,0,0,0,1,1,1,1,1,1,0,0,1,1,1,1,1,1,1,1,1,1,1,0,0,0,0,0,0,0,0,0,0,0,0,0,0,0,0,0,1,1
4 Hold Out 46 44 Sleepy 0,0,0,0,0,1,1,1,1,1,1,0,0,0,0,0,0,0,0,0,0,0,0,0,0,0,0,1,1,1,1,1,1,1,1,1,1,1,1,0,1,1,1,1
4.1 Hold Out 46 44 Sleepy 0,0,0,0,0,1,1,1,1,0,0,0,0,0,0,0,1,1,1,1,1,1,1,1,1,1,1,0,0,0,0,0,0,1,1,1,1,1,1,1,1,1,1,1
5 Hold Out 46 44 Surprised 0,0,0,0,0,0,0,0,0,0,0,0,0,0,0,0,0,0,0,0,0,1,1,1,1,1,1,1,0,1,1,1,1,1,1,1,0,0,0,0,0,1,1,1
5.1 Hold Out 46 44 Surprised 0,0,0,0,0,0,0,0,1,1,1,1,1,1,1,0,0,0,0,0,0,0,0,0,0,0,0,0,0,0,0,0,0,0,1,1,1,1,1,1,1,0,0,0
6 Hold Out 46 44 Winked 1,1,1,0,1,1,1,1,0,0,0,0,0,0,0,0,0,0,0,0,1,1,1,1,0,0,0,0,0,1,1,1,1,0,0,0,0,1,1,1,1,1,1,0
6.1 Hold Out 46 44 Winked 0,0,0,0,0,0,0,0,1,1,1,1,1,1,1,0,0,0,0,0,0,0,0,1,1,1,1,0,0,0,0,0,0,0,0,1,1,1,1,1,1,0,0,0
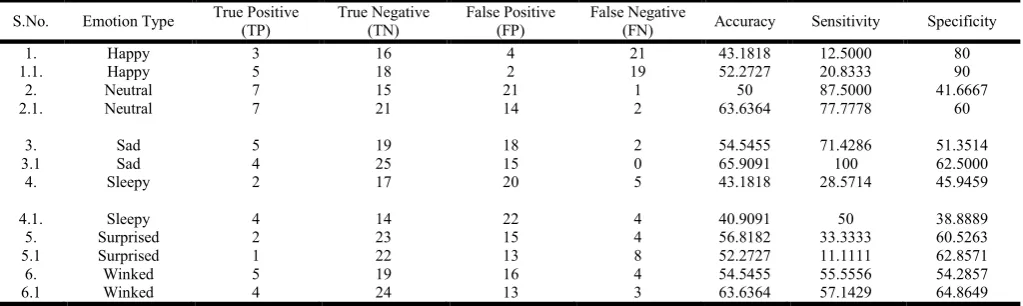
Table 6. Confusion Matrix depicting the performance of ANN in Emotion Classification
S.No. Emotion Type True Positive
(TP) True Negative (TN) False Positive (FP) False Negative
(FN) Accuracy Sensitivity Specificity
1. Happy 3 16 4 21 43.1818 12.5000 80
1.1. Happy 5 18 2 19 52.2727 20.8333 90
2. Neutral 7 15 21 1 50 87.5000 41.6667
2.1. Neutral 7 21 14 2 63.6364 77.7778 60
3. Sad 5 19 18 2 54.5455 71.4286 51.3514
3.1 Sad 4 25 15 0 65.9091 100 62.5000
4. Sleepy 2 17 20 5 43.1818 28.5714 45.9459
4.1. Sleepy 4 14 22 4 40.9091 50 38.8889
5. Surprised 2 23 15 4 56.8182 33.3333 60.5263
5.1 Surprised 1 22 13 8 52.2727 11.1111 62.8571
6. Winked 5 19 16 4 54.5455 55.5556 54.2857
6.1 Winked 4 24 13 3 63.6364 57.1429 64.8649
Performance analysis of support vector machine classifier and neural network classifier
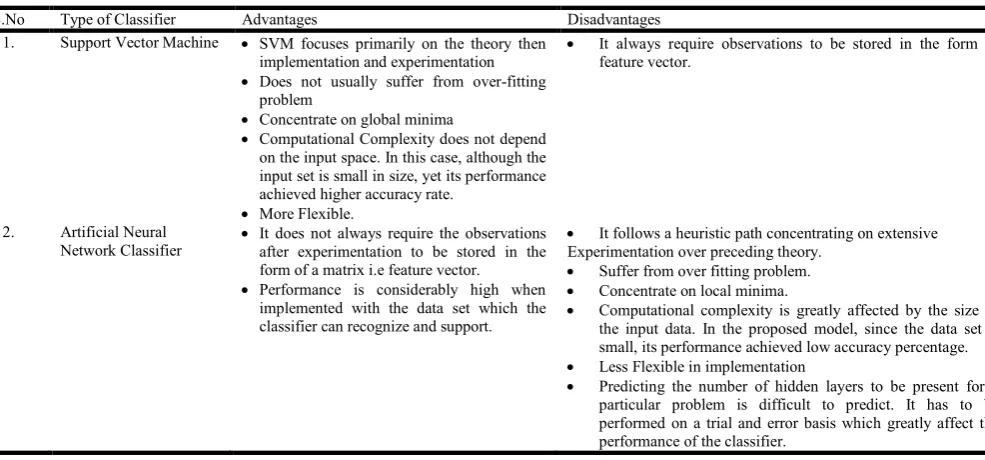
In the proposed model, the two well-known classifiers in supervised learning technique have been utilized to accomplish the task of Human Emotion detection and its classification into predefined classes. Although both the classifiers are extremely efficient in attaining the classified data, yet it has been experimentally proved that the performance of the Support Vector Machine Classifier is superior to the Artificial Neural Network Classifier for this particular methodology.
However it cannot be denied that these two classifiers have played climactic role in Classification Problem, their relevance and irrelevance has been discussed in the below mentioned table:
Table 7. Comparative Analysis of the performance of SVM and ANN
S.No Type of Classifier Advantages Disadvantages
1. Support Vector Machine SVM focuses primarily on the theory then
implementation and experimentation
Does not usually suffer from over-fitting
problem
Concentrate on global minima
Computational Complexity does not depend
on the input space. In this case, although the input set is small in size, yet its performance achieved higher accuracy rate.
More Flexible.
It always require observations to be stored in the form of
feature vector.
2. Artificial Neural
Network Classifier
It does not always require the observations
after experimentation to be stored in the form of a matrix i.e feature vector.
Performance is considerably high when
implemented with the data set which the classifier can recognize and support.
It follows a heuristic path concentrating on extensive
Experimentation over preceding theory.
Suffer from over fitting problem.
Concentrate on local minima.
Computational complexity is greatly affected by the size of
the input data. In the proposed model, since the data set is small, its performance achieved low accuracy percentage.
Less Flexible in implementation
Predicting the number of hidden layers to be present for a
particular problem is difficult to predict. It has to be performed on a trial and error basis which greatly affect the performance of the classifier.
Conclusion
With the advent of time, Artificial Intelligence with its major contribution in the field of machine learning has played a pivotal role in inculcating diligence and intelligence in machines to amplify its performance virtually in every domain of our lives. In human life, emotion play a crucial role in determining thoughts, behaviour, and interaction with other human being. The present scenario therefore vogue that machines should be equally capable of detecting and realizing human emotions. The facial features and the variety of its expressions can be considered as the primary components through which humans express emotions, and are critical to daily communication. A superlative understanding of the human emotions by the machines would generate greater expectations about our own behaviour and would enhance the need s to adopt other people’s behaviour. In the present article, we have addressed the problem of detecting and realizing the basic human emotions through various facial expressions, we have also designed and proposed a technique to accomplish the task of emotion recognition by machine , to be more precise we have made an attempt to make computer automatically detect and classify human emotions from static human facial images. To achieve this, zoetic classifiers i.e Support Vector Machine and Artificial Neural Network Classifier have been used to classify the six basic human emotions. Although both the classifiers were equally diligent in accomplishing the task, however it has been experimentally proven that the Performance of the Support Vector Machine Classifier was superior to the Artificial Neural Network Classifier.
REFERENCES
Anastasios C. Koutlas, Dimitrios I. Fotiadis “A Region Based Methodology for Facial Expression Recognition” page 1.
Ekman, P and Friesen, W, "Facial Action Coding System: A Technique for the Measurement of Facial Movement", Consulting Psychologists Press, Palo Alto, 1978 pp. 10-11.
Filko D. and G. Martinovic, “Emotion Recognition System by a Neural ´ Network Based Facial Expression Analysis,” in Automatika - Journal for Control, Measurement, Electronics, Computing and Communications. ATKAFF. vol. 54, no. 2, pp. 263-272, 2013.
Gargesha M., P. Kuchi and K. Torkkola, “Facial Expression Recognition,” in EEE 511: Artificial Neural Computation Systems, 2002.
Gender Classification from Facial Images using PCA and SVM - Chandra Kamal Sinha. http://www.cs.cmu.edu/~schneide/tut5/node42.html http://www.cs.utexas.edu/~grauman/courses/378/handouts/moghaddam2000.pdf. http://www.csie.ntu.edu.tw/~cjlin/libsvm. http://www.csie.ntu.edu.tw/~cjlin/papers/guide/guide.pdf. http://www.ijcttjournal.org/Volume17/number-4/IJCTT-V17P131.pdf. http://www.researchgate.net/profile/Javier_Francisco_Razuri/publication/261448510_Automatic_Emotion_Recognition_through_ Facial_Expression_Analysis_in_Merged_Images_Based_on_an_Artificial_Neural_Network/links/54b7869a0cf2bd04be339d2 c.pdf. http://www.tutorialspoint.com/artificial_intelligence/artificial_intelligence_neural_networks.htm
Hu T., L.C. De Silva and K. Sengupta, “A hybrid approach of NN and HMM for facial emotion classification,” in Pattern Recognition Letters, vol. 23, no. 11, pp. 1303-1310, 2002.
Kobayashi H. and F. Hara, “Facial Interaction between Animated 3D Face Robot and Human Beings,” in Proceedings of the International Conference of Systems, Man and Cybernetics, pp. 3732-3737, NY: IEEE New York, 1997.
Mehrabian A., "Communication without words", Psychology Today, Vol. 2, No. 4, 1968, pp. 53-56.
Padgett C., G.W. Cottrell and R. Adolphs, “Categorical perceptionin facial emotion classification,” in Proceedings of the 18th Annual Conference of the Cognitive Science Society. Erlbaum, pp. 249-253,1996.