© 2016 IJSRSET | Volume 2 | Issue 2 | Print ISSN : 2395-1990 | Online ISSN : 2394-4099 Themed Section: Science and Technology
Modified Ratio Estimators for Population Mean Using Size of the
Sample, Selected From Population
Mohmmad Jerajuddin
1*, Jai Kishun
21
Consultant MIS (RCH-II), National Institute of Health and Family Welfare, New Delhi, India
2Assistant Professor (Statistics & Demography), National Institute of Health and Family Welfare, New Delhi, India
ABSTRACT
This paper deals with a modified ratio estimator for the estimation of population mean of study variable using the size of the sample, selected from the population under SRSWOR. The bias and mean square error of the proposed estimator up to the first order of approximation is derived [Appendix]. The constants, biases and mean square errors (MSEs) are computed using the data from Murthy [1] and Mukhopadhyay [3]. The percent relative efficiencies (PREs) are also computed for both existed and proposed estimators and compare the results accordingly for justifying the betterment of the proposed estimators over other mentioned modified estimators.
Keywords: Auxiliary Variable, Sample size, Simple Random Sampling, Bias, Mean Square Error, Relative Standard Error (RSE), Percent Relative Efficiency (PRE).
Notations & Terminology Used in this paper:
N – Population Size n – Sample Size
n =
N
f Sampling Fraction
X – Auxiliary Variable Y – Study Variable
X,Y– Population Mean
x,y
– Sample Meanx y
C ,C
– Co-efficient of Variations of X and Yrespectively
x y
S ,S
– Population Standard Deviations of X andY respectively
xy
S
– Population Covariance between X and Yd
M – Median of the auxiliary variable
– Correlation Co-efficient between X & Y3
2
1 3
1 2 3
2
( - )
( -1)( - 2) N
i i
x
N X X
N N S
, Co-efficient ofSkewness of the auxiliary variable
4
2
1 4
2 4 2
2
( 1) ( - )
3( 1)
( -1)( - 2)(N 3) ( 2)( 3)
N
i i
x
N N X X
N
N N S N N
, Co-efficient of Kurtosis of the auxiliary variable.
j
ˆ
Y– Existed jth
modified ratio estimator of
Y
p
ˆ
Y
– Proposed modified ratio estimator ofY
Bias( )– Bias of the estimator
MSE( )– Mean square error of the estimator
PRE( ) – Percent relative efficiency of the estimator
I.INTRODUCTION
Cochran (1940) had first made his contribution to introduce the ratio estimator in literature using known information of the auxiliary variable in improving the efficiency of the estimator of the population mean
Y
[4]. Assuming that the population mean of the auxiliary variable X is known, and correlation between study and auxiliary variable is positive (high) [2], [3]; anestimator
Y
ˆ
R of population meanY
was introduced.The ratio estimator is given below.
ˆ ˆ
R y
Y X RX
x
, where
y y
ˆ R=
x x
(1.1)
Where
y
is the sample mean of the study variable Y,The bias in the ratio estimator
Y
ˆ
Rof the populationmean
Y
, to the first order of approximation:
2
R
1 -ˆ
Y f x - xy x y
Bias Y C C C
n
(1.2)
The mean squared error of the ratio estimator
Y
ˆ
Rof thepopulation mean
Y
, to the first order of approximation:
2
2 2
R
1-ˆ
Y f x y - 2 x y
MSE Y C C C C
n
(1.3)
The ratio estimator
Y
ˆ
Ris more efficient than the samplemean
y
if1 2
x
y C C
(1.4) (1.4The ratio estimator
Y
ˆ
Rhas a bias of ordern
1. Since thestandard error of the estimate is of ordern12, the bias is also of order
1 2
n [2]. In other words the bias of the
estimator decreases as the sample size n increases which shows that the ratio estimate is a consistent estimate [15]. That is the ratio estimate can be almost unbiased for large n [16]. In this regard, the criteria of unbiasedness and consistency perform as primary filters in assessing possible estimates [17]. Since efficiency of an estimator depends on its variance and it is logical that the variance as well as the mean square error of estimator are minimum when increasing the sample size [19]. Initially Cochran (1940) introduced the ratio estimator, thereafter various modifications have been proposed for improving the efficiency of the ratio estimators by using some known descriptive statistics such as population mean, population variance, coefficient of variation, coefficient of kurtosis, coefficient of skewness, population correlation coefficient, function of quartiles, and use of median etc [5],[7],[12]. All these descriptive statistics have been used from the early information of the auxiliary variable. We have observed that no efforts have been made on the modification of ratio estimators for improving their efficiencies by utilizing the size of the sample, selected from the population under study. A sample usually represents a subset of manageable size so the chance of occurrence of sampling error is also possible when selecting the sample from the population. This sampling error is minimized with a required degree of precision (also called margin of error), say ‘E’ of estimate. If we consider the components of confidence interval when estimating sample size, its width is
determined by a reliability coefficient, an standard error
/ n
of estimate and the use of finite correctionfactor
1
N n
N
. Algebraically
E
1
reliability coefficient N n
N n
(1.5)
The formula (1.5) is used when the sample size n is more than 5% of the finite population N. Since
is a fixed quantity, the only way to have a small standard error is to take a large sample (assuming reliability coefficient is also fixed). But how large a sample depends on the size of
, the population standard deviation and the preferred degree of reliability (ie. 99.9%, 99%, 95%, 90% etc.) [20], [21]. Under SRSWOR scheme, we also need an appropriate sample size with a minimum relative standard error for a smallest margin of error. Algebraically, the minimum sample size under SRSWOR is given by1
2 2
2
1
y Y n
N S
(1.6)
Where
denote the relative standard error (RSE) [4], which should be minimum as possible for a more precise sample. We collect those samples which contain some information about the population and calculate some specific statistics from it, so that it may be helpful for making inferences about the population. This process of collecting information from the sample is referred to as sampling. That’s why sampling theory is connected to samples and its estimate is also based on the sizes of the sample.II. METHODS AND MATERIAL
Consider a finite population of N units
1 2 N
U={U ,U ,...,U }. Let(X ,Y )i i ; i=1,2,...,N be real
valued function defined on the finite population U, whereXidenote the auxiliary variables which have full
information about population andYi the variable under
study and the objective is to estimate the population
mean
Y
.of auxiliary variable is known, Sisodia & Dwivedi [6] have proposed a modified ratio estimator for estimating
Y
together with its bias and mean squared error defined below. 1 X ˆ Y =y x x x C C (2.1)
2 2
1 1 1
1-ˆ
Y = x- x y
f
Bias Y C C C
n
(2.2)
2
2 2 2
1 1 1
1-ˆ
Y f y x - 2 x y
MSE Y C C C C
n
(2.3)
Where
1
X =
X Cx
Motivated by Sisosidia & Dwivedi [6] and Singh et. al. [9] developed a modified ratio estimator replacing the coefficient of variation with coefficient of kurtosis, given below. 2 2 2 X ˆ Y =y x
(2.4)
2 2
2 2 2
1-ˆ
Y = f x- 2 x y
Bias Y C C C
n
(2.5)
2
2 2 2
2 2 2
1-ˆ
Y f y x - 2 x y
MSE Y C C C C
n
(2.7)
Where 2 2 X = X
In addition, various research works have been done in earlier time under simple random sampling on the modification of ratio estimators such as Upadhyaya & Singh [8], Singh & Tailor [11], Yan & Tian [10], and Subramani & Kumarpandiyan [5] etc have used the population parameters of the auxiliary variable for improving the efficiency of the ratio estimators by minimizing the mean sum of square of the estimators. Some modified ratio estimators are listed in Table 1.1 below. It should be noted that it is not the overall list of modified ratio estimators available in the literature. We have taken only some of them to compare our result with the existing modified ratio estimators.
Let us denote the existing modified ratio estimators as follows:
1
ˆ
Y
= Ratio Estimator by Sisosidia & Dwivedi2
ˆ
Y
= Ratio Estimator by Singh et. al.3
ˆ
Y
= Ratio Estimator by Upadhyay & Singh4
ˆ
Y
= Ratio Estimator by Yan & Tian5
ˆ
Y
= Ratio Estimator by Singh & Tailor6
ˆ
Y
= Ratio Estimator by Subramani & KumarpandiyaTable 1.1 A list of existing modified ratio estimators are summarized with their biases, mean square errors, and the constant terms
j(j=1,2,…6)Sr.
No. Estimators
Constants (
j ) Bias ( jˆ
Y
) MSE (Y
ˆ
j)1. 1 X ˆ Y =y x x x C C
1
X
=
X
C
x
2 2
1 1 1
1-ˆ
Bias Y = x- x y
f
Y C C C
n
2 2 2 2
1 1 1
1-ˆ
MSE Y y x- 2 x y
f
Y C C C C
n
2. 2 2 2
X
ˆ
Y =y
x
2 2X
=
X
2 22 2 2
1-ˆ
Bias Y = f Y Cx- C Cx y
n
2 2 2 2
2 2 2
1-ˆ
MSE Y f Y Cy Cx- 2 C Cx y
n
3. 2 3 2 X ˆ Y =y x x x C C
3 2
X = X x x C C
2 23 3 3
1-ˆ
Bias Y = f Y Cx- C Cx y
n
2 2 2 2
3 3 3
1-ˆ
MSE Y f Y Cy Cx- 2 C Cx y
n
4. 1 4 1
X
ˆ
Y =y
x
4 1 X = X
2 24 4 4
1-ˆ
Bias Y = x- x y
f
Y C C C
n
2 2 2 2
4 4 4
1-ˆ
MSE Y f Y Cy Cx- 2 C Cx y
n
5. 5
X
ˆ
Y =y
x
5X
=
X
2 25 5 5
1-ˆ
Bias Y = x- x y
f
Y C C C
n
2 2 2 2
5 5 5
1-ˆ
MSE Y f Y Cy Cx- 2 C Cx y
n
6. 6
X
ˆ
Y =y
x
d dM
M
6X
=
X
M
d
2 2
6 6 6
1-ˆ
Bias Y = f Y Cx- C Cx y
n
2 2 2 2
6 6 6
1-ˆ
MSE Y f Y Cy Cx- 2 C Cx y
n
For a better intimation to the readers in a single sight, the Biases and MSEs of the modified ratio
estimatorsYˆj, (j=1, 2… 6), summarized in Table 1.1 can
be represented as follows:
2 2
j j j
1-ˆ
Y = f x - 2 x y
Bias Y C C C
n
(2.8)
2
2 2 2
j j j
1-ˆ
Y y x- 2 x y
f
MSE Y C C C C
n
(2.9)
Where
1
X =
X Cx
, 2
2 X = X , 3
2 X = X x x C C , 4
1 X = X , 5 X = X
and 6
X =
X Md
.
III. PROPOSED MODIFIED RATIO ESTIMATOR
The fact is that the auxiliary variable X is closely related to (having positive correlation with) the study variable Y and it is assumed that the population total and/or mean of X is known, we have made effort to introduce a new kind of ratio estimator based on size of the sample, selected from the population under SRSWOR which is more efficient as compared to the other existed modified ratio estimators. Some of those have been summarized in Table 1.1 to make comparison of biases and mean square errors in our study. It has been observed that the Bias and MSE of the proposed estimator up to the first order of approximation is least as compared to those of already existed in the literature.
The proposed modified ratio estimator for population
mean
Y
isp X n ˆ Y =y x n
(3.1)
To the first degree of approximation, the biases and
mean squared errors of
Y
ˆ
p are given as:
2 2
p p p
1-ˆ
Y = f x - 2 x y
Bias Y C C C
n
(3.2)
2
2 2 2
p p P
1-ˆ
Y f y x- 2 x y
MSE Y C C C C
n
(3.3)
Where p
=
X
X
n
And = n
N
f is the sampling fraction also called finite
population correction factor (f.p.c)
From (2.9) and (3.3), it is observed that the proposed
modified ratio estimator
Y
ˆ
p perform better than theexisting estimators j
ˆ
Y
(j=1,2,…,6) and that’s why pˆ
Y
ismore efficient than
Y
ˆ
j(j=1,2,…,6). So that
p
jˆ
ˆ
Y
Y
MSE
MSE
For j=1,2,…,6 (3.4)If p
2 j x y C C
is satisfied (3.5)Where p= X
X n
and
jis defined in Table 1.1.The percent relative efficiency (PRE) of the modified
ratio estimators p
ˆ
Y
and jˆ
Y
with respect to the usualestimator
y
is given by(y )
( ) x100
( ) srs V PRE
MSE
(3.6)
IV. EMPIRICAL STUDY
Data Set: We have considered four natural populations. First two set of populations (Population 1 and Population 2) have been taken from Murthy [1] in page no. 228 and another two populations (Population 3 and Population 4) have been taken from Mukhopadhyay [3] in page no. 168. The descriptive statistics (Population Parameters), obtained from these populations are summarized in the Table 1.2.
Murthy [1] “Table 6.9”:
Population 1: (
X
1) = Data on number of workers and(Y) = Output for 80 factories in a region.
Population 2: (
X
2) = Fixed Capital and (Y) = Outputfor 80 factories in a region.
Mukhopadhyay [3] “Table E6.1”:
Population 3: (
X
1) = Data on number of workers and(Y) = Output for 40 factories in a region.
Population 4: (
X
2) = Fixed Capital and (Y) = Outputfor 40 factories in a region.
Table 1.2 Computed Parameters form the Populations P1, P2, P3, and P4.
P
o
pu
la
tio
n
P
a
ra
met
er
s Murthy [1] Mukhopadhyay [3]
P1 P2 P3 P4
N 80 80 40 40
n 20 20 8 8
f 0.25 0.25 0.2 0.2
Y
51.8264 51.8264 50.7858 50.7858X
11.2646 2.8513 2.3033 9.4543
0.9413 0.9150 0.8006 0.8349y
S 18.3566 18.3566 16.7352 16.7352
y
C 0.3542 0.3542 0.3295 0.3295
2
C
y 0.1255 0.1255 0.1086 0.1086x
S
8.4561 2.7043 1.9360 6.3869x
C
0.7507 0.9485 0.8406 0.67562
Cx 0.5635 0.8996 0.7065 0.4564
2
-0.0634 0.6977 -0.5344 -0.46221
1.0500 1.3006 0.9740 0.8799d
M 7.5750 1.4800 1.250 7.0700
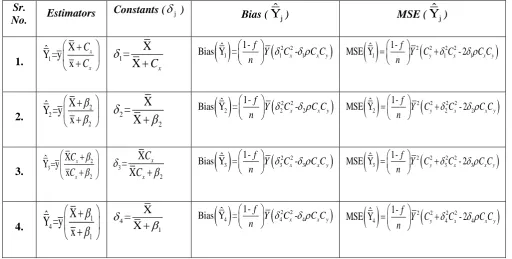
Tables [1.3 to 1.7] show the comparison between existing and proposed modified estimators. The graphical representation for MSEs and PREs of existing and modified ratio estimators are also presented herewith in section 4.1 and section 4.2.
V. RESULTS AND DISCUSSION
Table 1.3: Constants of the Existing and proposed modified ratio estimators for the Populations P1, P2, P3, and P4.
j
ˆ
Y P1 P2 P3 P4
1
ˆ
Y
0.9375 0.7504 0.7326 0.93332
ˆ
Y
1.0057 0.8034 1.3021 1.05143
ˆ
Y
1.0076 0.7949 1.3813 1.07804
ˆ
Y
0.9147 0.6868 0.7028 0.91495
ˆ
Y
0.9229 0.7571 0.7421 0.91896
ˆ
Y
0.5979 0.6583 0.6482 0.5721p
ˆ
Y
0.3603 0.1248 0.2235 0.5417Table 1.4: Biases of the Existing and proposed modified ratio estimators for the Populations P1, P2, P3, and P4.
j
ˆ
Y P1 P2 P3 P4
1
ˆ
Y
0.5066 0.5361 1.1009 1.13792
ˆ
Y
0.6185 0.6484 4.6177 1.56973
ˆ
Y
0.6218 0.6297 5.2908 1.67594
ˆ
Y
0.4715 0.4142 0.9809 1.07635
ˆ
Y
0.4839 0.5497 1.1402 1.08956
ˆ
Y
0.1007 0.3643 0.7777 0.2186p
ˆ
Y
0.0331 0.0473 0.0724 0.1687Table 1.5: MSE of the Existing and proposed modified ratio estimators for the Populations P1, P2, P3, and P4.
j
ˆ
Y P1 P2 P3 P4
1
ˆ
Y
15.2581 0.5066 42.0165 41.05662
ˆ
3
ˆ
Y
19.4592 0.6218 217.7027 61.44034
ˆ
Y
14.0113 0.4715 37.6265 38.81135
ˆ
Y
14.4503 0.4839 43.4736 39.29106
ˆ
Y
2.7825 0.1007 30.4301 11.6837p
ˆ
Y
1.8389 0.0331 11.5428 10.60981.1.
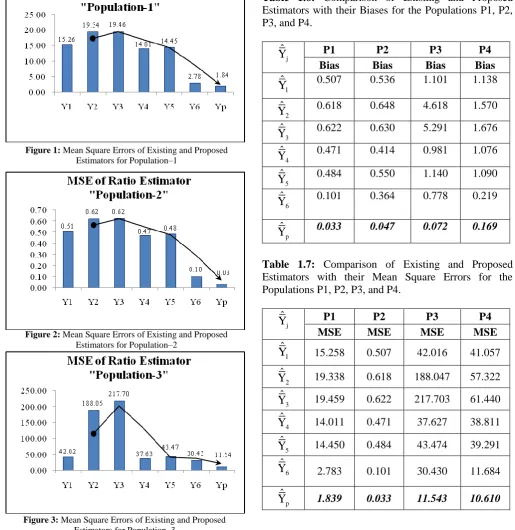
Graphical Representation of the Mean Square Errors of the Existing and Proposed Modified Ratio Estimators:Table 1.6: Comparison of Existing and Proposed Estimators with their Biases for the Populations P1, P2, P3, and P4.
j
ˆ
Y P1 P2 P3 P4
Bias Bias Bias Bias
1
ˆ
Y
0.507 0.536 1.101 1.1382
ˆ
Y
0.618 0.648 4.618 1.5703
ˆ
Y
0.622 0.630 5.291 1.6764
ˆ
Y
0.471 0.414 0.981 1.0765
ˆ
Y
0.484 0.550 1.140 1.0906
ˆ
Y
0.101 0.364 0.778 0.219p
ˆ
Y
0.033 0.047 0.072 0.169Table 1.7: Comparison of Existing and Proposed Estimators with their Mean Square Errors for the Populations P1, P2, P3, and P4.
j
ˆ
Y P1 P2 P3 P4
MSE MSE MSE MSE
1
ˆ
Y
15.258 0.507 42.016 41.0572
ˆ
Y
19.338 0.618 188.047 57.3223
ˆ
Y
19.459 0.622 217.703 61.4404
ˆ
Y
14.011 0.471 37.627 38.8115
ˆ
Y
14.450 0.484 43.474 39.2916
ˆ
Y
2.783 0.101 30.430 11.684p
ˆ
Y
1.839 0.033 11.543 10.610Figure 1: Mean Square Errors of Existing and Proposed Estimators for Population–1
Figure 2: Mean Square Errors of Existing and Proposed Estimators for Population–2
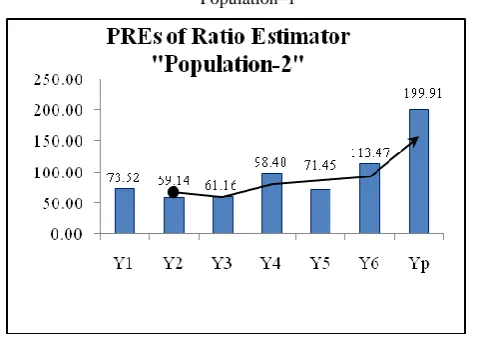
Table 1.8: Comparison of PREs for the estimators corresponding to all four populations
j
ˆ
Y P1 P2 P3 P4
PRE PRE PRE PRE
1
ˆ
Y
82.8188 73.5193 66.6563 68.21472
ˆ
Y
65.3450 59.1433 14.8934 48.85863
ˆ
Y
64.9390 61.1606 12.8646 45.58354
ˆ
Y
90.1886 98.3961 74.4332 72.16105
ˆ
Y
87.4488 71.4541 64.4222 71.28006
ˆ
Y
454.138 113.469 92.0361 239.707p
ˆ
Y
687.179 199.9113 242.6326 263.97031.2.
Graphical Representation of the Percent Relative Efficiency of the Existing and Proposed Modified Ratio Estimators:VI. RESULT and CONCLUSION
In the present paper, we have proposed a modified ratio
estimator p
ˆ
Y
based on the size of the samples, selectedfrom the population under SRSWOR for estimating the population mean of study variable Y when information of auxiliary variable X is available. We have found in our study that the proposed estimator is more efficient than the existing modified ratio estimators.
From the empirical study, we have observed that the bias and mean square error of the proposed modified ratio estimator is least as compared to those of existing modified estimators. Table 1.4 and Table 1.5 show the results of Biases and MSEs of both of the estimators (Proposed and Existing), from which we see that proposed estimator, performs better than those of existing estimators. The percent relative efficiency (PRE) in Table 1.7 also support the study as the proposed estimator is highly efficient than the existing
Figure 5: PRE of Existing and Proposed Estimators for Population–1
Figure 6: PRE of Existing and Proposed Estimators for Population–2
Figure 7: PRE of Existing and Proposed Estimators for Population–3
estimators. The graphical representations (section 1.1 and 1.2) of MSEs and PREs legitimate the justification of the proposed modified ratio estimator over the existing ratio estimators. Thus if the auxiliary variable X is closely related to the study variable Y assuming that population total and/or mean of X is known, a modified ratio estimator based on the size of the samples, selected from the population under SRSWOR scheme, is recommended to estimate the population mean of the study variable.
VII. REFERENCES
[1] Murthy, M.N. (1967): Sampling Theory and Methods; Statistical Publishing Society, Calcutta. [2] Cochran, W.G. (1977): Sampling Techniques; 3rd
edition. Wiley Eastern, New Delhi.
[3] Mukhopadhyay, P. (2009): Theory and Methods of Survey Sampling; 2nd edition. PHI Learning Pvt. Ltd., New Delhi.
[4] Sarjinder, S. (2003): Advanced Sampling Theory with Applications; Kluwer Academic Publishers Volume. (1&2)
[5] Subramani, J. & Kumarpandiyan, G. (2013): New Modified Ratio Estimation of Population Mean when Median of Auxiliary Variable is Known; Pak.j.stat.oper.res. Vol.IX No.2 2013 pp137 – 145.
[6] Sisodia, B.V.S. and Dwivedi, V.K. (1981): A Modified Ratio Estimator using Coefficient of Variation of Auxiliary Variable; Jour. of Indian. Soc. of Agri. Stat., Vol. 33(1). Pp. 13–18.
[7] Khan, M. & Shabbir, J. (2013): A Ratio Type Estimator for the Estimation of Population Variance using Quartiles of an Auxiliary Variable; J.Stat. Appl. Pro.2, No. 3, 319 –325.
[8] Upadhyaya, L.N. & Singh, H.P. (1999): Use of transformed auxiliary variable in estimating the finite population means, Biometrical Journal 41 (5), 627–636.
[9] Singh, H.P. & Kakran, M.S. (1993): A Modified Ratio Estimator Using Known Coefficient of Kurtosis of an Auxiliary Character, (unpublished). [10] Yan, Z. & Tian, B. (2010): Ratio Method to the
Mean Estimation using Coefficient of Skewness of Auxiliary Variable; ICICA, Part-II, CCIS 106, pp. 103 – 110.
[11] Singh, H.P. & Tailor, R. (2003). Use of known Correlation Coefficient in Estimating the finite
Population Means; Statistics in Transition 6 (4), 555-560.
[12] Yadav, S.K., Mishra, S.S. and Shukla, A.K. (2014): Improved Ratio Estimators for Population Mean Based on Median Using Linear Combination of Population Mean and Median of an Auxiliary Variable; American Journal of Operational Research, 4(2): 21-27.
[13] Subramani, J., Kumarpandiyan, G. & Balamurli, S. (2014): Some Modified Linear Regression type Ratio Estimators for Estimation of Population Mean Using Known Parameters of an Auxiliary Variable; Journal of Building Research, 1(1): 28-42.
[14] Sangngam, P. (2014): Ratio Estimators Using Coefficient of Variation and Coefficient of Correlation Modern Applied Science; Vol. 8, No. 5.
[15] Sukhatme, P.V. (1957): Sampling Theory of Surves with Applications, The Indian Society of Agricultural Statistics, New Delhi, India.
[16] Gun, A.M., Gupta, M.K. & Dasgupta, B. (2008): Fundamentals of Statistics, Vol–2; The World Press Pvt. Ltd., Kolkata.
[17] Barnett, V. (1999): Comparative Statistical Inference; 3rd edition, JohnWiley & Sons Ltd. [18] Kadilar, C. & Cingi, H. (2004): Ratio Estimators
in Simple Random Sampling; Applied Mathematics and Computation 151, 893–902 [19] Allen L. Webster (2010): Applied Statistics for
Business and Economics, An Essentials Version; 3rd edition, Tata McGraw–Hill Education Pvt. Ltd.
[20] David A. Kay (2005): CliffsAP Statistics, Wiley Publishing, Inc., Hoboken, NJ
[21] Daniel, W.W. & Cross, C.L. (2013): Biostatistics, A Foundation for Analysis in Health Sciences, 10th edition; JohnWiley & Sons, Inc.
APPENDIX
Let us define –
0 1
y e
Y
,e1 x 1
X ,
2
2 2 1
y
y s e
S
,
2
3 2 1
x
x
s e
S
and
4
1
xy
xy
s
e
S
(A.1)( )
j0
E e
For all j=1, 2, 3, 4 (A.2) And2 2
0
1
( ) f y
E e C
n
, 12 2
1
(
)
f
xE e
C
n
,0 1
1
( ) f x y
E e e C C
n
(A.3)
1. We have proposed the modified ratio estimator in (3.1) as
p
X n
ˆ Y =y
x n
, Where p
X
=
X
n
andn =
N
f is the sampling fraction (3.1)
From (A.1), we obtain the relations
y
Y
(1
e
0)
and
x
X
(1
e
1)
. Now substituting these values ofy
and
x
in the proposed modified ratio estimator (3.1), we have1
p 0 0 1
1
X n X
ˆ
Y = (1 ) = (1 ) 1
(1 ) n X
Y e Y e e
X e n
1p 0 p 1
ˆ
Y = (1
Y
e
) 1
e
, Where p= X X n
(3.1.1)
Assuming
e
1
1
and using the binomial expansion ofthe term
1pe1
1of (3.1.1), we have
2 2
p 0 p 1 1 1
ˆ
Y = (1Y e ) 1
e
pe O(e ) (3.1.2)
2 2
p 0 p 1 p 0 1 1 1
ˆ
Y =Y 1 e
e
e e
pe O(e ) (3.1.3)Where
O
(e )
1 denote the higher order terms ofe
1. Wealso have assumed that
e
1
1
, so that e1k 0as kincreases or mathematically if k>1.
Thus the terms in (3.1.3) having higher powers of
e
1arenegligible and therefore considered to be vanished.
Now taking expectations on both sides of (3.1.3) and using the results from (A.2) and (A.3), we have
2 2
p 0 p 1 p 0 1 1 1
ˆ
Y = 1
( )
( )
(
)
p( )
{ (e )}
E
Y
E e
E e
E e e
E e
E O
2 2
1p p
1 1
ˆ
Y = 1 f x y p f x n
E Y C C C O
n n
2 2
1p p
1 ˆ
Y = 1 f p x x y n
E Y C C C O
n
2 2
p p
1
ˆ
Y - =
f
p x x yE
Y
Y
C
C C
n
(3.1.4)
2 2
p p p
1-ˆ
Y =
f
x-
x yBias
Y
C
C C
n
(3.2)Thus the bias in the proposed modified ratio estimator
p
ˆ
Y
to the first order of approximation is given byequation (3.2).
2. Consider equation (3.1.3) and on simplification we get
2 2
p 0 p 1 p 0 1 1 1
ˆ
Y - =
Y Y e
e
e e
pe
O
(e )
(3.1.5)Squaring both sides and taking expectations we have
2
22 2 2
p 0 p 1 p 0 1 1 1
ˆ
Y -
=
p(e )
E
Y
Y E e
e
e e
e
O
(3.1.6)
Again in the similar way, the higher order terms will be negligible. Now using the results from (A.2) and (A.3), the MSE to the first order of approximation is given by
2
2 2 2
p 0 1 p 0 1
ˆ
Y =
p2
MSE
Y E e
e
e e
(3.1.7)Thus we get the required result as given below
2
2 2 2
p p P
1-ˆ
Y y x - 2 x y
f
MSE Y C C C C
n
(3.3)
Hence the mean square error in the proposed ratio
estimator p
ˆ
Y
to the first order of approximation is givenby (3.3)
3. The conditions for which the proposed estimator performs better than the sample mean under SRSWOR : We know that in simple random sampling, the most
suitable estimator of population mean
Y
is the sample meany
. We also know that the variance ofy
, up to the2 2 1
(ysrs) f y
V Y C
n
(3.1.8)
The modified ratio estimator p
ˆ
Y
is more efficient thanthe sample mean
y
if the mean square error of theestimator
Y
ˆ
p is less than the variance of sample meany
.Algebraically
pˆ
Y
(y
srs)
MSE
V
(3.1.9)
2 2 2 2 2 2
p P
1- 1
- 2
y x x y y
f f
Y C C C C Y C
n
n
2 2
pCx - 2 P C Cx y 0
P
2
x y
C C
Where p
=
X
X
n
(3.2.1)Hence if the condition (3.2.1) is satisfied, the proposed modified ratio estimator is more efficient than the sample mean
y
.4. The condition for which the proposed
estimator p
ˆ
Y
performs better than the existing estimatorsj
ˆ
Y
:The modified ratio estimator p
ˆ
Y
is more efficient thanthe existing modified ratio estimators
Y
ˆ
jif the MSE ofp
ˆ
Y
is less than MSE ofY
ˆ
j . Algebraically
p
jˆ
ˆ
Y
Y
MSE
MSE
(3.4)
2 2 2 2 2 2 2 2
p P j j
1-
1-- 2 - 2
y x x y y x x y
f f
Y C C C C Y C C C C
n n
2 2 2 2
p
C
x- 2
PC C
x y jC
x- 2
jC C
x y
P
2
j x
y C C
(3.5)
Where
jis defined in Table 1.1 and pX =
X n