Available online on 15.01.2020 at http://jddtonline.info
Journal of Drug Delivery and Therapeutics
Open Access to Pharmaceutical and Medical Research
© 2011-18, publisher and licensee JDDT, This is an Open Access article which permits unrestricted non-commercial use, provided the original work is properly cited
Open Access Research Article
RP-HPLC Method Development and Validation for the Estimation of
Mirabegron in Bulk and Dosage Form
Rahul Suryawanshi *, Siddiqua Shaikh, Snehal Patil
Department of Quality Assurance, S.N.D College of Pharmacy Babhulgaon, India
ABSTRACT
A new, simple, precise, accurate and reproducible Reverse Phase High Performance Liquid Chromatography (RP-HPLC) method for Simultaneous estimation of bulk and pharmaceutical formulations. Separation of Mirabegron was successfully achieve , C18, 250X4.6mm, 5µm or equivalent in an isocratic mode utilizing methanol water (70:30) at pH 5.0 Adjusted to OPA at a flow rate of 1.0ml/min and eluate was monitored at 243nm, with a retention time of 2.584 minutes for Mirabegron. The method was validated and the response was found to be linear in the drug concentration range of 50µg/ml to150 µg/ml for Mirabegron. The values of the correlation coefficient were found to 0.999for Mirabegron. The Limit of Detection(LOD) and Limit of Quantification (LOQ) for Mirabegron were found to be 0.149 and 0.498 res pectively. This method was found to be good percentage recovery were found to be 99 indicates that the proposed method is highly accurate. The specificity of the method shows good correlation between retention times of standard with the sample so, the method specifically determines the analyte in the sample without interference from excipients of tablet dosage forms. The method was extensively validated according to International Council for Harmonisation(ICH) guidelines for Linearity, Accuracy, Precision, Specificity and Robustness.
Keywords: Mirabegron, RP-HPLC, Simultaneous estimation, Accuracy, Precision, Specificity
Article Info: Received 23 Nov 2019; Review Completed 17 Dec 2019; Accepted 29 Dec 2019; Available online 15 Jan 2020
Cite this article as:
Suryawanshi R, Shaikh S, Patil S, RP-HPLC Method Development and Validation for the Estimation of Mirabegron in Bulk and Dosage Form, Journal of Drug Delivery and Therapeutics. 2020; 10(1):31-38
http://dx.doi.org/10.22270/jddt.v10i1.3841
*Address for Correspondence:
Rahul Suryawanshi, Department of Quality Assurance, S.N.D College of Pharmacy Babhulgaon, India
INTRODUCTION
The chemical name for Mirabegron is 2-(2-amino-1, 3
thiazol-4-yl)-N-[4-[2-[[(2R)-2-hydroxy-2-phenylethyl]amino]ethyl]phenyl]acetamide having a molecular formula of C21H24N4O2S and a molecular weight of 396.509 g/mol.1 Mirabegron is a beta-3 adrenergic agonist that is used for treatment of overactive bladder syndrome.2-4 It has not been implicated in causing liver enzyme elevations or clinically apparent acute liver injury. Its primary use is in the treatment of overactive bladder.5 Mirabegron dose-dependently increased cyclic adenosine 3', 5'-monophosphate (cAMP) concentrations in bladder tissues isolated from rats and showed a potent relaxant effect in isolated rat and human bladder strips precontracted with carbachol at low contraction tonus. Recently, Mirabegron was shown to relax in vitro human and rabbit prostate smooth muscle through activation of β3 adrenoceptor. The same group also showed that Mirabegron encourages smooth muscle relaxation by α1 adrenergic receptor blockade.
Fig 1- chemical structure of Mirabegron
MATERIAL AND METHODS:
Apparatus:
HPLC Water 486 Tunable Absorbance Detector Model No HPLC 610 Series Detector UV-visible Software Conquer Column C18 (250mm × 4.6mm), 5μm id. filtered using 0.45μ
membrane filter Nylon 0.45μ and ultra-sonicated Model: WUC 4L Capacity.
Chemicals and solvents:
Mirabegron drug were perches from MSN Laboratory Ltd Hyderabad the marketed formulation of Mirabegron OAB-F ( Alembic Pharmaceutical LTD) were perches from local market HPLC grade water, methanol were purchased from E.MerckLtd., Mumbai,India.
Chromatographic condition:
Column : Grace C18 (4.6 ID×250 mm;5μm) column, Mobile phase: Methanol: water (70:30) at pH 5.0 adjusted with OPA
Flow Rate: 1.0 ml/min, Detection Wavelength:243 nm, Run time: 6 min, Injection volume: 20.0 μl.
Detection Wavelength by UV Spectroscopy:
The absorption maximum of MGN was determined using 10μg/ml working solution of MGN. The solution was prepared in mobile phase (Methanol 70:Water 30 at pH 5.0adjusted with OPA). The absorption spectrum or UV spectrum recorded for MGN was as shown in Figure 2 and the corresponding absorbance values were as illustrated in
Table 1. As shown in Table 1, the MGN has showed absorbance at two different wavelength viz. 243 and 204nm. Out of the two wavelengths, the absorbance at 204nm was found to be 1.114 which found maximum of the two absorbances. Nevertheless, it is in the range of solvent cutoff for Methanol. As Methanol is component of the mobile phase, the other wavelength 243nm with absorbance of 0.773, although less than that at 204nm was selected for further analysis in order to avoid interferences of mobile Phase
Fig 2:UV Spectrum of MGN HPLC method development
The aqueous phase for the present method development was HPLC grade water. The aqueous phase is also consisting of 0.5% Triethylamine as an ion pairing reagent. The pH of the aqueous phase was adjusted with Ortho phosphoric acid and maintained at pH 5.0.
Preparation of standard stock solution of MGN
10mg of MGN was precisely weighed and dispensed to100ml volumetric flask containing few ml of mobile phase (Methanol 70: Water 30 at pH 5.0adjusted with OPA). The volume was made up to the mark using mobile phase slowly and from side to side mild wobbly to make up the substantial solution of 100μg/ml. This solution was ultra-sonicated for 30min in three cycles each of 10 min. Furthermore, it was the filtered through 0.45μ membrane filter in order to take away minute particles if any.
Preparation of working solution of MGN
Aliquot of 1.0ml of standard stock solution of MGN was withdrawn by means of micropipette and diluted to 10.0ml with mobile phase (Methanol 70: Water 30 at pH 5.0adjusted with OPA) to make the resultant solution of 10μg/ml. This solution was ultra-sonicated for 30 min in three cycles each of 10 min. Also, it was then filtered through 0.45μ membrane syringe filter and filled in HPLC vials for injection. This solution was then used for supplementary
Selection of mobile phase
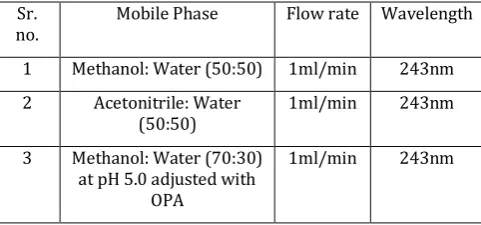
To begin with mobile phase composition of Methanol: Water 50:50 was selected for RP-HPLC trial runs. The separation carried out on C18stationary phase (4.6mm x 250mm, 5µ
particle size). The results obtained were evaluated for retention time, peak area, no. of theoretical plates and tailing factor. The conditions for trial runs were as given in Table 1
below.
An additional trial run was executed with composition of methanol: water in the ratio of 70:30 at pH 5.0 adjusted with OPA at flow rate of 1ml/min. The detector was set at 243nm. The chromatogram obtained was evaluated for retention time, peak area, no. of theoretical plates and tailing factor.
Table 1 Chromatographic conditions for trial runs
Sr.
no. Mobile Phase Flow rate Wavelength 1 Methanol: Water (50:50) 1ml/min 243nm 2 Acetonitrile: Water
(50:50) 1ml/min 243nm 3 Methanol: Water (70:30)
at pH 5.0 adjusted with OPA
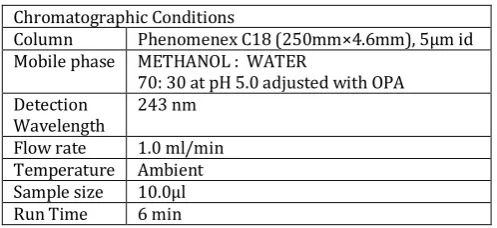
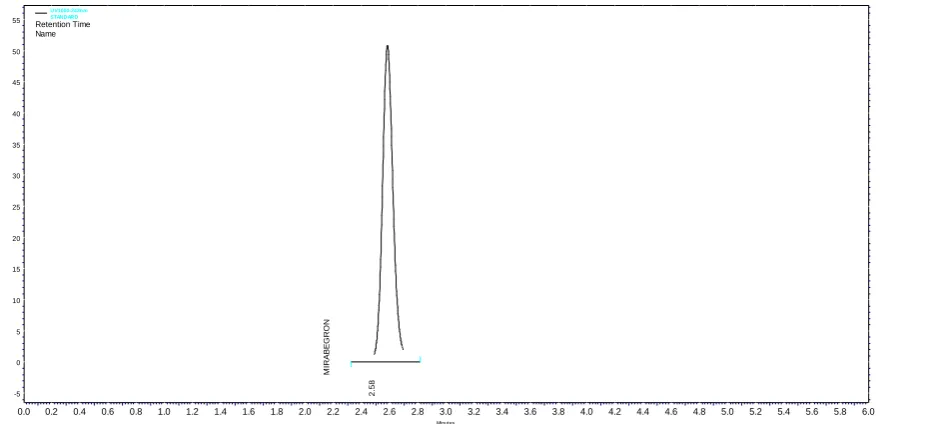
System suitability testing
The system suitability testing was planned to ensure the consistency of the system for evaluation of MGN. The study was proposed with 10μg/ml working solution as prepared in process written in section 6.2.1.4. This solution was injected to set chromatographic conditions as given in Table 3. to evidence the chromatogram for MGN. The following chromatogram was integrated to get retention time, peak area, tailing factor and number of theoretical plates for MGN.
Table 2. Table for chromatographic conditions set for the experiment
Chromatographic Conditions
Column Phenomenex C18 (250mm×4.6mm), 5μm id Mobile phase METHANOL : WATER
70: 30 at pH 5.0 adjusted with OPA Detection
Wavelength 243 nm Flow rate 1.0 ml/min Temperature Ambient Sample size 10.0μl Run Time 6 min
HPLC method validation
Linearity and Range: Volume of standard stock solution (100μg/ml)of MGN equivalent to 1.0, 2.0, 3.0, 4.0, 5.0 and 6.0ml was pipette out using micro-pipette and transferred to six different 10ml volumetric flasks. The aliquot of each volumetric flask was diluted up to 10ml using the mobile phase to attain the consequent solutions of 10, 20, 30, 40, 50, and 60μg/mlin that order. Each of this solution was injected to the given chromatographic conditions and chromatograms were recorded. The same function was persistent three times for all standard solutions prepared to study linearity.
Precision: Precision of the method was studied at three points across the range for MGN. This was performed by setting three quality control standards for MGN in the given series of 10 to 60μg/ml. Precision experiment was performed to study two dissimilar parameters viz. repeatability and intermediate precision.
Accuracy: % Accuracy was determined from the particulars obtained for precision study. At this point it was determined from the observations of mean peak area obtained in the case of three QC standards of MGN defined for precision study.
Robustness: In Robustness, the system parameters like organic concentration of the mobile phase (Methanol) and flow rate were varied as per Table 10 & 11 The 10μg/ml concentration standard solution of MGN was selected for this study and it was kept constant throughout all system
parameters varied. The preferred concentration (10μg/ml) was injected to given chromatographic conditions three times at each level of change and chromatograms recorded. From the chromatograms acquired mean peak area was determined in all measurements made.
%Recovery:
Preparation of stock from API:
10mg of MGN (API) was precisely weighed and transferred to 100ml volumetric flask containing few ml of mobile phase and volume was made up to the mark (100ml) using mobile phase (Methanol 70: Water 30 at pH 5.0adjusted with OPA) to obtain final concentration standard stock solution of MGN 100μg/ml. The following solution was filtered through 0.45μ membrane filter and ultra-sonicated for 30 min in three cycles each of 10 min.
Preparation of standard stock solution from dosage
form
Twenty tablets (Label claim 50mg of Mirabegron (OAB-F) Alembic Pharmaceuticals ltd) were weighed, triturated to obtain powder and average weight of powder was determined. Powder equivalent to 10mg was transferred to 100ml of mobile phase to attain the main stock solution of MGN100μg/ml. The substantial solution was filtered through 0.45μ membrane filter and ultra-sonicated for 30min in three cycles each of 10 min. From the main stock sample solution of MGN aliquots of 0.8, 1.0 and 1.2ml were pipette out using micro pipette in three different 10ml volumetric flasks and the solution of each of these flasks was diluted up to 10ml using mobile phase to obtain resultant sample solutions of 8, 10, 12μg/ml respectively.
Preparation of test solution for % recovery by spike
method
10μg/ml solution (prepared previously) of MGN (API) was spiked into each of above sample solutions of MGN viz. 8, 10 and 12μg/ml to obtain test solutions at 80%, 100% and 120%likewise. Each of these three level test solutions of MGN was injected in triplicate to the given chromatographic conditions and mean peak area for each level was determined.
Limit of Detection (LOD) and Limit of Quantitation (LOQ): The LOD and LOQ were calculated from the slope(s) of the calibration plot and the standard deviation (SD) of thepeak areas using the formulae LOD = 3.3 σ/s and LOQ = 10σ/s. The results were given in Table
RESULTS AND DISCUSSION
Results of system suitability study are summarized in Table 1. Six consecutive injections of the Standard solution showed uniform retention time, theoretical plate count, tailing factor and resolution For both the drugs which indicate a good system for analysis.
Table 3. Observation table for SST of MGN Sr.
No.
Parameter Mean observations SD %RSD Acceptance
criteria
Inference
1 Peak Area 277776 5015.53 1.81 < 2 Pass 2 Retention time 2.58 0.005 0.19 > 0.5 Pass 3 Number of Theoretical
plates*
6736 -- -- > 2000 Pass
Figure 3. Chromatogram of MGN obtained in system suitability experiment
Linearity and Range:
Table 4 Observation table for results obtained in linearity study
Sr. No. Conc. of MGN(μg/ml) Mean Peak Area*
1 10 282671
2 20 574102
3 30 852123
4 40 1111207
5 50 1420554
6 60 1732810
Figure 4 Calibration Curve of Mirabegron showing linear relationship between two variables
Figure 5 Representative chromatogram in linearity study observed at 10ppm
Minutes
0.0 0.2 0.4 0.6 0.8 1.0 1.2 1.4 1.6 1.8 2.0 2.2 2.4 2.6 2.8 3.0 3.2 3.4 3.6 3.8 4.0 4.2 4.4 4.6 4.8 5.0 5.2 5.4 5.6 5.8 6.0
m
A
U
-5 0 5 10 15 20 25 30 35 40 45 50 55
m
AU
-5 0 5 10 15 20 25 30 35 40 45 50 55
2
.5
8
M
IR
A
B
E
G
R
O
N
UV1000-243nm STANDARD Retention Time Name
y = 28712x - 9335.7 R² = 0.999
0 200000 400000 600000 800000 1000000 1200000 1400000 1600000 1800000 2000000
0 20 40 60 80
P
e
ak
Ar
e
a
Conc. of MNG in μg/ml
Series1
Minutes
0.0 0.2 0.4 0.6 0.8 1.0 1.2 1.4 1.6 1.8 2.0 2.2 2.4 2.6 2.8 3.0 3.2 3.4 3.6 3.8 4.0 4.2 4.4 4.6 4.8 5.0 5.2 5.4 5.6 5.8 6.0
m
AU
-5 0 5 10 15 20 25 30 35 40 45 50 55 60
m
AU
-5 0 5 10 15 20 25 30 35 40 45 50 55 60
M
IR
A
B
E
G
R
O
N
2
.6
6
Table 5. Peak Table for Linearity experiment at 10ppm
Inj. No. Name Retention Time(min) Area No. of Theoretical Plates Tailing Factor
1. MIRABEGRAN 2.66 291261 5339 1.12
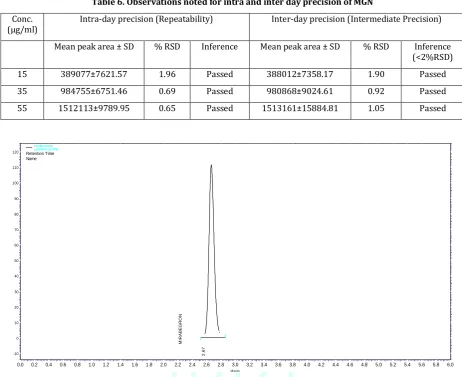
Precision
Table 6. Observations noted for intra and inter day precision of MGN
Conc.
(μg/ml) Intra-day precision (Repeatability) Inter-day precision (Intermediate Precision) Mean peak area ± SD % RSD Inference Mean peak area ± SD % RSD Inference
(<2%RSD) 15 389077±7621.57 1.96 Passed 388012±7358.17 1.90 Passed 35 984755±6751.46 0.69 Passed 980868±9024.61 0.92 Passed 55 1512113±9789.95 0.65 Passed 1513161±15884.81 1.05 Passed
Figure 6. Chromatogram obtained for MGN at 15ppm Intra-day precision
Table 7. Peak Table for Intra-day precision experiment at 15ppm
Inj.
No. Name Retention Time (min)
Area No. of Theoretical Plates Tailing Factor
1. MIRABEGRAN 2.67 181367 5394 1.10
% Accuracy
Table 8. Percent accuracy determined from the data obtained for intermediate precision experiment Sr.
No. (μg/ml) Conc. Mean Peak Area* Mean Measured Conc. (μg/ml) Accuracy % Inference (Stad. For MGN 95-105% w/w)
1 15 388012.00 13.84 92.26 Failed 2 35 980868.00 34.49 98.54 Passed 3 55 1513161.00 53.03 96.41 Passed
Minutes
0.0 0.2 0.4 0.6 0.8 1.0 1.2 1.4 1.6 1.8 2.0 2.2 2.4 2.6 2.8 3.0 3.2 3.4 3.6 3.8 4.0 4.2 4.4 4.6 4.8 5.0 5.2 5.4 5.6 5.8 6.0
m
A
U
-10 0 10 20 30 40 50 60 70 80 90 100 110 120
m
AU
-10 0 10 20 30 40 50 60 70 80 90 100 110 120
2
.6
7
M
IR
A
B
E
G
R
O
N
Figure 7. Chromatogram observed for percent accuracy at 35p
Table 9. Peak Table for percent accuracy experiment at 35ppm
Inj. No. Name Retention Time (min)
Area No. of Theoretical Plates Tailing Factor
1. MIRABEGRAN 2.66 978236 4495 1.11
Robustness
Table 10. Observations of robustness expt. for variation in methanol concentration
Methanol
Concentration (%) Standard Conc. (μg/ml) peak area* Mean Mean measured conc. (μg/ml) Assay % Inference (Stad. For MGN 95-105% w/w) 70 10 282671 10.17 101.70 Passed
72 10 281543 10.13 101.31 Passed 68 10 284374 10.23 102.30 Passed
Table 11. Observations of robustness expt. for variation in flow rate per min of mobile phase
Flow Rate
(ml/min) Conc. (μg/ml) Standard Mean peak area* Mean measured conc. (μg/ml) % Assay Inference (Stad. For MGN 95-105% w/w) 1.0 10 282671 10.17 101.70 Passed
0.9 10 280453 10.09 100.93 Passed 1.1 10 281736 10.14 101.38 Passed
% Recovery:
Table 12. Observation table for percent recovery study of MGN at three levels viz 80, 100 and 120%
% Recovery
Level
Conc. Of standard spiked
(μg/ml)
Conc. of sample (μg/ml)
Mean peak Area of sample conc.*
Amount recovered#
(μg/ml) % Recovey
Inference (Std. MGN assay
95-105% w/w)
80 10 8 232692 8.43 104.65 Passed 100 10 10 284592 10.24 102.39 Passed
Minutes
0.0 0.2 0.4 0.6 0.8 1.0 1.2 1.4 1.6 1.8 2.0 2.2 2.4 2.6 2.8 3.0 3.2 3.4 3.6 3.8 4.0 4.2 4.4 4.6 4.8 5.0 5.2 5.4 5.6 5.8 6.0
m
A
U
-20 0 20 40 60 80 100 120 140 160 180 200 220
m
AU
-20 0 20 40 60 80 100 120 140 160 180 200 220
2
.6
6
M
IR
A
B
E
G
R
O
N
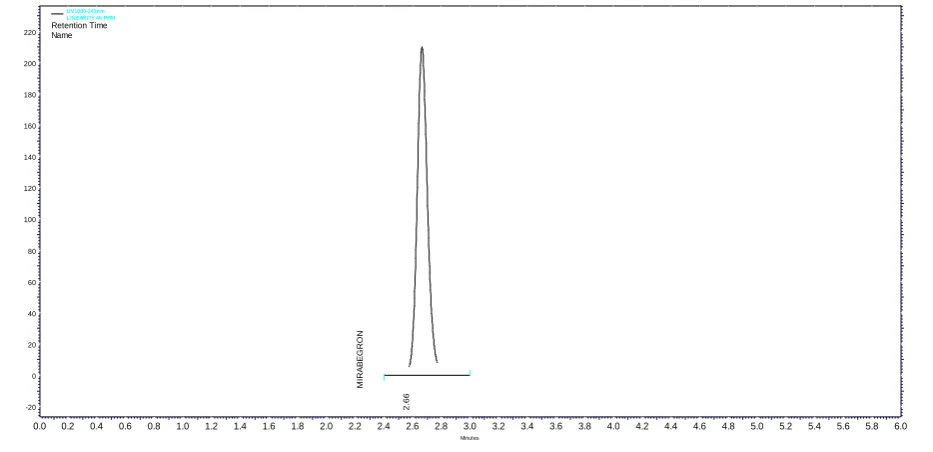
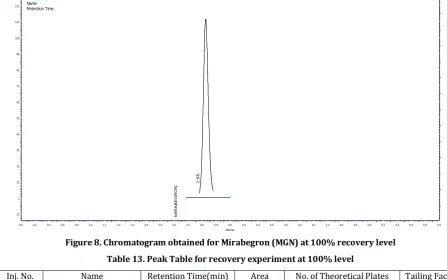
Figure 8. Chromatogram obtained for Mirabegron (MGN) at 100% recovery level Table 13. Peak Table for recovery experiment at 100% level
Inj. No. Name Retention Time(min) Area No. of Theoretical Plates Tailing Factor
1. MIRABEGRAN 2.65 565181 4384 1.15
LOD and LOQ :
Table No 14. Results of LOD& LOQ
Standard Drug Solution LOD (μg/ml) LOQ (μg/ml) Mirabegron (MGN) 2.07 6.28
SUMMARY AND CONCLUSION
The proposed study was planned to develop RP-HPLC method for quantitative estimation of Mirabegron (MGN) as API and to ascertain its application for estimation of MGN in finished product formulation (marketed tablet dosage form). We have fruitfully developed the RP-HPLC method estimation of MGN as API. The chromatographic conditions found an appropriate for the projected method were as herein below. Also, the system was found to be an appropriate with the following chromatographic conditions.
Chromatographic Conditions
Column Phenomenex C18 (250mm×4.6mm), 5μm id Mobile phase Methanol 70: Water 30 at pH 5.0 adjusted
with OPA Detection
Wavelength 243 nm Flow rate 1.0 ml/min Temperature Ambient Sample size 10μl Run Time 6 min
The developed and optimized method was then subjected to method validation as per ICH Q2R1 guideline for the parameters like linearity, range, precision, accuracy, robustness, detection limit, quantitation limit etc. The linearity was established by measuring a series of standard solutions of MGN and found in the range of 10-60μg/ml. The calibration curve developed suggested linear relationship amongst concentration of MGN and observed response (mean peak area for MGN) with correlation coefficient of 0.9991. The regression equation obtained was y = 28712x – 9335.7.
Precision of the method was studied at three levels across the range observed in linearity study. Three QC standards were defined viz. 15, 35 and 55μg/ml for this study. Precision was performed to ascertain the repeatability and intermediate precision. The results obtained showed %RSD for repeatability and intermediate precision were in the range of 0.65 to 1.96 and 0.92 to 1.90in that order. Results observed for %RSD in both (repeatability and intermediate precision) cases were less than 2%, hence, the method was found to be precise. % Accuracy was determined from the data of precision study indicated the %assay in the range of 92.26 to 98.54% w/w of MGN.
The robustness of the method was studied by purposeful difference in method parameters like organic concentration (Methanol) and flow rate. The results observed for organic concentration variation and flow rate change were in the
Minutes
0.0 0.2 0.4 0.6 0.8 1.0 1.2 1.4 1.6 1.8 2.0 2.2 2.4 2.6 2.8 3.0 3.2 3.4 3.6 3.8 4.0 4.2 4.4 4.6 4.8 5.0 5.2 5.4 5.6 5.8 6.0
m
AU
-10 0 10 20 30 40 50 60 70 80 90 100 110 120
m
AU
-10 0 10 20 30 40 50 60 70 80 90 100 110 120
M
IR
A
B
E
G
R
O
N
2
.6
5
range of 101.31-102.30 and 100.93-101.70% w/w respectively.
The applicability of the method was studied in tablet dosage form of Mirabegron. The results obtained for percent recovery study were in the range of 101.52 to 104.65% w/w for MGN. The results obtained in conformity with the prescribed limits for MGN. In addition, absence of an additional peak (s) in this study indicated that the method was specific for the determination of MGN in capsule dosage form.
Detection and quantitation limit were determined from the standard error of calibration curve of MGN and found to be 2.07 and 6.28μg/ml respectively. From the lower values of detection limit it was observed that method was responsive for determination of MGN.
REFERENCES
1] Harris, Daniel C. (2006), Quantitative Chemical Analysis, 7th Edition, W. H. Freeman
2] Mermet, Jean-Michel, Otto, Matthias and Valcarcel Cases, Miguel (2005), Analytical
chemistry : a modern approach to analytical science, 2nd Edition, Wiley-VCH
3) Townshend A. (1995) Encyclopaedia of Analytical Science, Volumes 1-10, Academic Press, London.
4] Jaarinen and Niiranen 2005, Molnár and Horváth 1976, Wohlgemuth 2011, pp. 116-159.
5] Ettre, Leslie S. (2001). "The Birth of Partition Chromatography. LCGC. 19 (5), pp. 506–512.
6] Ion Exchange Chromatography Principles and Methods. General Electric Company. 2004. pp. 11–20.
7] ungbauer, Alois; Hahn, Rainer (2009)."Chapter 22 Ion-Exchange Chromatography". Guide to Protein Purification, 2nd Edition. Methods in Enzymology. 463. pp. 349–371.
8] Skoog, D. A.; Principles of Instrumental Analysis, 6th ed.; Thompson Brooks/Cole: Belmont, CA, 2006, Chapter 28. 9] Allocati N, Federici L, Masulli M, Di Ilio C (2009) Glutathione
transferases in bacteria. FEBS J 276: 58-75.
10] Skoog D A, Holler F J, Crouch S. R. Instrumental Analysis, 6thed, Thomson Brook/cole, 2007, pp. 13-16, 378-385, 901-905, 893-900.
11] Molnár and C Horváth (September 1976). "Reverse-phase chromatography of polar biological substances: separation of catechol compounds by high-performance liquid chromatography". Clinical Chemistry. 22 (9): 1497–1502. 12] Scott R P W, Technique and Practice of chromatography, Marcel
Dekker, New York, 70, pp. 1-12.
13] ICH, Q2R1, Text on validation of analytical Procedures International Conference on harmonization, Geneva, 1994, October, pp. 1-13.
14] Jyothsna M et al., IOSR-JPBS, Volume 13(1), 2018, pp. 78-83. 15] Paisa G R and Rao R A, / Journal of Pharmacy Research,
2017,11(6), pp. 682-685
16] Rani et al., World Journal of Pharmaceutical Research, Volume 6(14), 2017, pp. 750-767.
17] Raveendra et al., World Journal of Pharmacy and Pharmaceutical Sciences, Volume 6(5), 2017, pp. 912-925.
18] Spandana R et al., Indo American Journal of Pharmaceutical Research, Volume, 6(11), 2016 pp. 6860-6886.
19] Zhou et al., Journal of Chromatographic Science, Volume 53, 2015, pp. 1361–1365.
20] Narasimharajuet. al., Am. J. PharmTech Res. Volume, 2012, 2(6), pp. 564-571.
21] Mounika B.et al., Int J Curr Pharm Res, Volume 9(5), pp. 140-151.
22] Rezaei M. et al., J. Med. Chem. Sci., Volume 1, pp. 36-40.
23] Sethi P D, HPLC Quantitative Analysis of Pharmaceutical Formulations. CBS Publishers & Distributors, first edition 2001. 24] Scott PWR, Liquid Chromatography for the Analyst. New York:
Marcel Dekker Inc. 1994:1-10.
25] International Conference on Harmonization (ICH), Q2A: Text on Validation of Analytical Procedures, March 1995.