An analysis of changing land use pattern and cropping
pattern in a scenario of increasing food insecurity in
Kerala state
Rejula K
1*and Rashmi Singh
21,2Division of agricultural extension, Indian agricultural research institute, New Delhi 110012, India.
*Corresponding author: [email protected]
Paper No. 201 Received: 28 December 2014 Accepted: 8 February 2015
ABSTRACT
Kerala state is unique in its agro-climatic variations and cropping pattern as compared to other states of India. Changes in Land Use pattern and cropping pattern in Kerala have been creating a lot of concern from the environmental as well as food security point of view. The present study examines shifts in land use pattern and changing trend of cropping pattern in Kerala from 2001to 2012period. Secondary data on area, production and productivity of major food crops and non food crops were collected from various sources. Compound annual growth rate and Cuddy-Della Valle instability index was computed to examine the growth and instability of the crops over the period (2001-2012). Crop diversification index was also calculated for the state for each year. The study observed that land which is categorized as cultivable waste, fallow other than current fallow and Current fallow recorded a positive growth in area. It is also found that banana(1.53%) and rubber(1.07%) showed maximum positive growth in terms of area. Among food crops rice (4.01%) tapioca (3.83%) and plantain (1.01%) showed a negative growth in area. Rice recorded negative growth in both area and production, which should be considered as an alarming situation as far as food security of Kerala is considered. It can be concluded that in Kerala Total cropped area is decreasing and food crops are more hard hitted by this shift than non food crops. Crop diversification index also point towards the trend of increasing monocropping in the state which favour non food crops.
Keywords: land use, cropping pattern, growth rate, instability index, Herfindahl Index, food crops, non food crops.
Kerala has the unique feature of diverse agro-climatic situations which enable it to cultivate many types of crops. In the earlier days agricultural land utilization was according to the agronomic conditions of land and food crops occupied a major part of cultivated land. However area under rice has been declining over the years with a possibility of extinction of rice farming in the state. According to the State Planning Board, the Kerala state lost over 5, 00,000 hectares of land under paddy cultivation between 1980 and 2007 and the harvest was reduced fifty percent to 6,30,000 tones during the period. The gap between the requirement and production of rice in the state has been showing an increasing trend in the past. The deficit which was about 50% in the 1960s,
increased to more than 75% in the 1990s and to an alarming level of 85% in 2007-2008. At present, the state produces only one-sixth of its total food grain requirement. For the rest, it depends on the Centre and neighboring states like Tamil Nadu and Andhra Pradesh. In the Agricultural development policy, draft of Govt of Kerala (2013) it is stated that if the present trend is allowed to continue the state of Kerala would become most food insecure part in the country”
imbalance in drainage system, reduce water table level, and destroy flora and fauna inhabiting in that system. It is clear that Imbalance in land utilization leads to food insecurity and ecological instability in any region. In this context it is vital to know what is the changing scenario of land use pattern and cropping pattern with special focus on food crops in Kerala. An analysis of temporal changes in land use pattern over a period of time provides scope for understanding present scenario of agricultural land utilization and proper measures can be taken accordingly to have a balance between remuneration to farmers along with a sustainable environmental and production system.
Review of literature
Kanwar (1971) defined cropping pattern as the time and space sequence of crops. Land use pattern and cropping pattern change over time due to various reasons. Many studies were undertaken on this aspect at various time periods. Cash crops can help to increase farm income per individual farmer. But Panikar (1980) identified that cropping pattern which favors perennial crops will adversely affect both the employment opportunities of the rural people and food security of the state as a whole. Thomas and Devi (1990) identified an increasing trend in the area under crops like cardamom, cashew, coffee and rubber from 1973 to 1987 . They concluded that Climatic conditions of the state, farmer’s high expectations of future prices for crops such as cardamom, cashew, coffee and rubber were the major reason for the increase in area under these crops.
Jayakumar and Velayudhan (2002) tried to analyze the cause and consequences of agricultural stagnation in Kerala. The study limited to important food crops and cash crops. Growth indices of various crops were computed from 1960-61 to 1999-2000. The study revealed a significant decrease in growth of area under rice and tapioca. While for coconut and pepper nominal increase were noted, but rubber has shown a fourfold increase. All crops showed increasing trend in production. Rubber depicted highest growth in productivity and coconut showed the least.
Kerala state experienced unparalleled changes in land use pattern during the last fifty years (Kumar,
2005). Significant reduction in area under paddy and tapioca was observed. Rice area decreased by sixty per cent between 1975 and 2003, while the cultivation of coconut, rubber, arecanut and banana and other plantains increased considerably.
Durga and Kumar (2013) through an analysis of time series data revealed that there is stagnation, large scale commercialization and instability in agricultural sector of Kerala, while Studies conducted at other parts of our country (Shakeel,2013; Renu and Ashutosh , 2014) revealed that at national level the scenario of growth rate was in favour of food grains during the last fifty years. But in Kerala the situation is entirely different. It is facing a serious reduction in area proportion food crops to the total cropped area.
Data and Methodology
The present study was conducted in Kerala because it has maximum gap between production and requirement of food grains as compared to other states of India. In this study cropping pattern is defined as the proportion of area under different crops at a point of time. Crops selected for study were classified as food crops and non food crops. Recent (from 2001-to-2012-13) change of growth and instability analysis of crops is done in this study. Change in Land use pattern was studied in terms of increase or decrease in area under different land use categories of the state. To measure the change in cropping pattern Secondary data on area, production and productivity of major crops grown in Kerala was collected from publications of Govt like farm guide and web sites like http://www.ecostat.kerala. gov.in. Twelve crops were selected for study which accounted for more than 80% of cropped area. The study was restricted to principal crops with the assumption that the excluded crops do not affect cropping pattern and in turn do not vitiate the main conclusions of the study.
Compound annual growth rate and Cuddy-Della Valle instability index was computed to examine the growth and instability of the crops . Crop diversification index was also calculated for the state for each year. The following formula was used to calculate Compound annual growth rate.
,
: number of years.
Instability in area, production and productivity is estimated using Cuddy-Della Valle instability index (Cuddy and Della Valle 1978) which is given as I = CV√ (1-̅ R)2. Where I is the instability index in%, and R2is the coefficient of determination from a time trend regression adjusted by the number of degree of freedom. Cuddy-Della Valle Index is a measure of variability in time series data (Weber and Sievers 1985) . The simple coefficient of variation (CV) overestimates the level of instability in time series data characterized by long-term trends, whereas the Cuddy-Della Valle Index corrects the coefficient of variation .
Crop diversification index
The study analyzed the scenario of crop diversification in Kerala using Herfindahl Index. It is a measure of concentration. Index was calculated by taking sum of squares of area proportion of each crop in the total cropped area. Herfindahl Index ( HI) is given by the following formula
n HI=∑ Pi2
i=1
n is the total number of crops and Pi represents acreage proportion of ith crop in the total cropped area. With the increase in diversification, index would decrease. This index takes a value one when there is complete specialization and approaches zero when N becomes large. That is diversification is perfect. Diversification index( DI= 1-HI) calculated was used for capturing change.
Results and Discussion
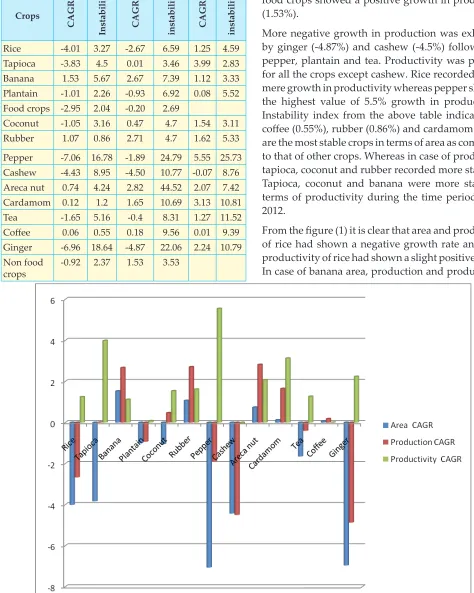
Results of the study are presented as follows. Change in land use pattern is presented in terms of area under different land use categories and change in cropping pattern is presented in terms of growth in area, production and productivity of major crops grown in Kerala from 2001 to2012. It is very clear from table (1) that land which is categorized as cultivable waste, fallow other than current fallow and Current fallow recorded a positive growth in area. This shows a general trend that farmers are slowly reducing area under cultivation and are in search for alternate employment because of various reasons.
Table 1. Growth rate and instability index of land use pattern in Kerala, 2004-12
Sl
no Land use pattern (Area in Hectares) CAGR Instability Index (%)
1 Land put to non agricultural
use -0.73 5.73
2 Barren and un cultivable
land -6.13 4.19
3 Permanent pasteurs and
other grazing land -9.58 14.30
4 Land under misc tree crops -13.38 9.29
5 Cultivable waste 3.63 8.51
6 Fallow other than current
fallow 3.51 5.49
7 Current fallow 1.25 6.86
8 Net area sown -0.56 0.49
9 Area sown more than once -4.74 7.57
10 Total cropped area -1.59 1.85
Total cropped area showed a negative growth of 1.59% and area sown more than once (-4.74%) and Net area sown (-0.56%) also experienced a negative trend in growth. More negative growth in area was shown by land under miscellaneous tree crops (13.38%) followed by permanent pasteurs and other grazing land (9.58%) and Barren and un cultivable land (-6.13%). Net area sown and total cropped area showed more stability which is evident from the least values of instability index. Permanent pasteurs and other grazing land and land under miscellaneous tree crops recorded highest instability index in area.
Table 2: Growth rate and instability index of major crops in Kerala, 2001-12
Crops
Area Production Productivity
CAGR
Instability CAGR instability CAGR instability
Rice -4.01 3.27 -2.67 6.59 1.25 4.59
Tapioca -3.83 4.5 0.01 3.46 3.99 2.83
Banana 1.53 5.67 2.67 7.39 1.12 3.33
Plantain -1.01 2.26 -0.93 6.92 0.08 5.52
Food crops -2.95 2.04 -0.20 2.69
Coconut -1.05 3.16 0.47 4.7 1.54 3.11
Rubber 1.07 0.86 2.71 4.7 1.62 5.33
Pepper -7.06 16.78 -1.89 24.79 5.55 25.73
Cashew -4.43 8.95 -4.50 10.77 -0.07 8.76
Areca nut 0.74 4.24 2.82 44.52 2.07 7.42
Cardamom 0.12 1.2 1.65 10.69 3.13 10.81
Tea -1.65 5.16 -0.4 8.31 1.27 11.52
Coffee 0.06 0.55 0.18 9.56 0.01 9.39
Ginger -6.96 18.64 -4.87 22.06 2.24 10.79
Non food
crops -0.92 2.37 1.53 3.53
were cardamom, coconut, coffee and tapioca. Rice recorded a negative growth (-2.67%) in production also. Similarly total production of food crops also showed a negative growth rate (0.2%). Whereas non food crops showed a positive growth in production (1.53%).
More negative growth in production was exhibited by ginger (-4.87%) and cashew (-4.5%) followed by pepper, plantain and tea. Productivity was positive for all the crops except cashew. Rice recorded 1.25% mere growth in productivity whereas pepper showed the highest value of 5.5% growth in productivity. Instability index from the above table indicate that coffee (0.55%), rubber (0.86%) and cardamom (1.2%) are the most stable crops in terms of area as compared to that of other crops. Whereas in case of production tapioca, coconut and rubber recorded more stability. Tapioca, coconut and banana were more stable in terms of productivity during the time period 2001-2012.
From the figure (1) it is clear that area and production of rice had shown a negative growth rate and only productivity of rice had shown a slight positive trend. In case of banana area, production and productivity
Table 3: Proportion of area under major food crops to total cropped area
Year Proportion in per cent
Rice (in %) Tapioca Banana plantains
10.8 3.7 1.7 1.8
2001 10.5 3.5 1.9 1.8 2002 9.7 3.2 1.9 1.8 2003 9.7 2.9 1.9 1.8 2004 9.2 3 2.1 1.8 2005 9 2.9 2 1.8 2006 8.3 3 2.1 1.9 2007 8.7 3.2 2 1.9
2008 8.8 2.8 1.9 1.8
2009 8 2.7 2.2 1.9 2010 7.8 2.8 2.2 1.8 2011 7.6 2.7 2.4 1.9 2012 10.8 3.7 1.7 1.8 had recorded a positive growth. Rubber, areca nut and cardamom also recorded all positive growth in area production and productivity.
It is clear from the table (3 and 4) that proportion of food crops to the total cropped area has been declining every year and that of non food crops has been increasing in every year.
Figure 2 : Proportion of area under major food crops to total cropped area
Figure 3: Proportion of area under major non food crops to total cropped area
Table 4: Proportion (in %) of area under major non food crops to total cropped area
Year Coconut Rubber Pepper Cashew Areca nut Cardamom Tea Coffee Ginger
2001 30.3 15.9 6.8 2.9 3.1 1.4 1.2 2.8 0.35 2002 30.3 16 7 2.9 3.3 1.4 1.2 2.8 0.3 2003 30.4 16.2 7.3 2.9 3.5 1.4 1.3 2.9 0.3 2004 30 16 7.9 2.7 3.6 1.4 1.2 2.8 0.3 2005 30 16.6 7.9 2.6 3.6 1.4 1.2 2.8 0.4 2006 29.9 17.2 7.4 2.4 3.5 1.4 1.2 2.9 0.4 2007 29.7 18.5 6.4 2.1 3.6 1.4 1.3 3 0.3
2008 29.2 19.2 5.7 1.9 3.6 1.5 1.4 3.1 0.3
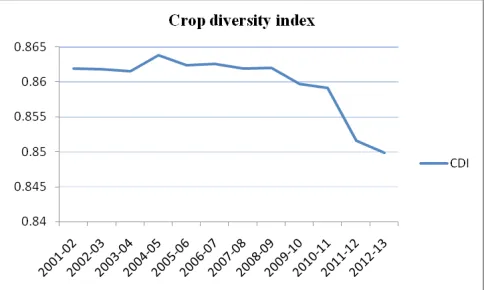
Crop diversification in Kerala Agriculture
Crop diversification is the concept of moving away from growing single crop to many crops. A farm is considered as diversified farm if no single product account for 50% or more of total income. In this study crop area diversification for food crops and non food crops at the state level was analyzed.
Figure 4. Crop diversity index for Kerala state 2001-12 From figure (4) It is clear the that crop diversity index of the state is decreasing (from 0.8619 to 0.8499) over a period of 2001-02 to 2012-13 indicating more monocropping of perennials.
Conclusion
The analysis of data showed that land available for cultivation but not taken up for cultivation or abandoned after a few years for one reason or the other is increasing. Lands once cultivated but remaining uncultivated for five years or more in succession shall also be included in this category. It is also found that the land which were taken up for cultivation but have been temporarily put off cultivation for a period of not less than one year but not more than five years is also increasing. It could be inferred from the above trend that those who own the land leave it fallow because of many reasons. Situation is such that cultivable fallow is available but the resources are not available to the needy or it is costly.
Among the crops banana and rubber showed maximum positive growth in terms of area. Banana is one of the profitable alternate crop opted by the farmers in their paddy fields. Many farmers are permanently changing their paddy fields by raising field to grow banana. At the extreme case they are even filling the land with unfertile red soil and
growing perennial tree crops. This can cause damage to agro-ecosystem which adversely affect ecological sustainability of the area.
Among food crops rice tapioca, and plantain showed a negative growth in area. It is very critical to note that Rice recorded a negative growth (-2.67%) in production also, which should be considered as an alarming situation as far as food security of Kerala is considered. This situation is also evident from the values of growth in the total area and production under food crops (-2.95%; -0.2%) as compared to non food crop which showed positive growth in production even though a slight decrease in area was recorded. It can be concluded that in Kerala Total cropped area is decreasing and food crops are more hard hitted by this than non food crops. Growth in productivity was positive for all the crops except cashew. Rice also recorded 1.25% mere growth in productivity which is a ray of hope for the state of Kerala since still there is scope for improving production of rice by taking measures to reduce cost of cultivation and increasing remuneration to farmers.
Decreasing crop diversity index of the state shows a trend towards specialization. That is farmers of the state are more interested in mono cropping of perennial cash crops which require less labor and more are remunerative as compared to food crops. Government had already come up with legislations like “Kerala conservation of paddy land and wetland act, 2008” to conserve paddy lands and to have sustainable use of valuable land resources. But it is very pathetic that even after the enactment of legislation the state has lost 34,654 hectare of paddy land. Therefore the results obtained through this study suggest that suitable measures has to be taken by providing inputs at reasonable cost, ensuring reasonable profit from the farm and by giving special consideration to farmers who cultivate crops like paddy which also provide many ecosystem services to the society.
References
Cuddy, J., and Della Valle, PA. Measuring the Instability of Time Series Data. Oxford Bullet Econ Stat,1978; 40(1): p79– 84.
Durga, AR., and Kumar, DS. Land use dynamics in Kerala: An analysis of issues and policies for the future. Productivity; 2013: 54 (1): 89.
Government of Kerala, 2013 . Agricultural development policy( draft) , available URL: http://www.kau.edu/ announce/2013_policy.pdf
Jayakumaran, G. , and Velayudhan, KV. Kerala economy: a special feature. Southern economist; 2002
Kanwar, JS. Cropping pattern scope and concept. Proceeding of the National Symposium on Cropping Patterns. Indian Council of Agricultural Research; 1971
Kumar, BM. Land use in Kerala: changing scenarios and shifting paradigms. J Trop Agric ,2005; 42: 1-12.
Panikar, PGK. Recent Trends in Area Under Production of Rice in Kerala. Working Paper No. 116, Centre for Development Studies, Trivandrum; 1980
Renu, M. and Ashutosh, S. Crop diversification in Indian agriculture. Asian J Res Soci Sci Huma ;2014: 4 ( 8): 113-120. Shakeel, A. Changing cropping pattern from conventional to market oriented value added crops in Eastern Uttar Pradesh , India : Variations and Causes. Economic Affairs. 2014; 59(1): p75-87
Thomas, KJ., Thomas, EK., and Devi, PI. An analysis of cropping pattern in Kerala. Agri Situa India. 1990; 45 (3). Weber, A. and Sievers, M. Observations on the Geography of