Economic Affairs
DOI :Onion is a major staple vegetable crop in India dominantly produced by small farmers and is called as a “Queen of Kitchen”. The green leaves, immature and mature bulbs are eaten raw or have been used in preparation of soups, sauces and for seasoning foods. An account of its special characteristics of pungency, it is valued high. Attention also given to crispness, juiciness and keeping quality of the bulb. Onion bulb is containing rich source of nutrients like phosphorous, calcium, carbohydrates protein and vitamin C. Indian farmers produces both common or Bellary onion (Allium cepa L. var.cepa) and small or multiplier onion (Allium cepa L. var.aggregatum Don.). According to the GOI (2014), area and production of onion in India was about 10,51,000 hectare (ha) and 16,81,000 tonnes (t), while in the state of Tamil Nadu it was accounted for 37,700 ha and 4,29,720 t. It shows that, an average productivity of
Estimation of Resource Use Efficiency and Technical Efficiency of Small
Onion Farmers in Tamil Nadu: A Cobb-Douglas and Stochastic Frontier
Approach
V. Karthick1, M. Thilagavathi1, A. Surendran2, R. Paramasivam1 and S.J. Balaji3
1Department of Agricultural Economics, Tamil Nadu Agricultural University, Coimbatore-641003, Tamil Nadu, India 2Rutgers-the state University of New Jersey, New Brunswick, USA
3Indian Agricultural Research Institute, New Delhi, India
Corresponding author: [email protected]
Abstract
This paper investigates the determinants of the resource use efficiency and technical efficiency of onion production. Farm-level data were collected using a structured questionnaire administrated to 90 randomly selected onion growers in Perambalur district of Tamil Nadu. The empirical results show that, bulbs, plant protection chemicals and human labour, machine hours, and phosphorous have a positive and significant influence on onion yield. Economic efficiencies are more than one for bulb, nitrogen, phosphorous, potash, plant protection chemicals, machine hours, land size values, farmyard manure and human labour in onion production which meant that these resources are being used at suboptimum level and there exists the possibility of increasing the yield of onion by increasing their use. The technical efficiency for the farms was estimated to be 78%, which indicates the possibility of increasing the yield of onion by adopting better technology. This study suggested that development of awareness of modern agricultural practices through demonstration, farm visits, framers meetings etc., by the government as well as removal all inputs distributional bottlenecks would ensure increased onion production in the study area.
Keywords: Cobb-douglas production, economics efficiency, resource use efficiency, stochastic frontier production function, technical efficiency
onion (11.4 t ha-1) was less than the national average (16
t ha-1). The less than optimal performance of the onion
production implies that a need exists for studies to examine efficiency of onion production in Tamil Nadu. The demand for onion would be stable over the period of time, often government of Tamil Nadu restrict export quota of onion to meet domestic demand because of low production (DEMIC, 2013). An increasing onion production lies in raising onion productivity by improving technical efficiency of resource use in onion production. Efficiency concerns relative performance of the processes used in transforming given input into output (Abu and Asember, 2011; Otienoet al., 2012). Efficiency measurement has received significant attention from researchers in different fields of study (Facayodeet al., 2011; Dawanget al., 2011)
Paper No.: 240 Received: 2 June 2015 Accepted: 17 September 2015
Economic theory identifies three measures of efficiency, namely allocative or resource use, economic and technical efficiency (Boriset al., 1997, Effiong and Onyenweaku, 2006, Ogunniyi L.T, 2011). The allocative efficiency (AE) reflects the ability of the farm to use inputs in optimum proportions given their respective prices and the production technology. Economic efficiency (EE) is defined as the capacity of a firm to produce a predetermined quantity of output at minimum cost for a given level of technology. Technical efficiency (TE) is the measure of the farm’s success in producing maximum output from a given set of inputs (Bhendi and Kalirajan, 2007; Wakili, 2012; Karthicket al., 2013). It is also referred to as the ability to operate on the production frontier or isoquant frontier (Effiong and Onyenweaku, 2006).
Measuring efficiency is vital because it can guide resource utilization and may lead to considerable resource savings, which have important implications for both policy formulation and farm management (Bravo-Ureta and Riegler, 1991; Bravo-Ureta, B.E. and Pinheiro, A.E., 1997; Shehuet al., 2010; Samuelet al., 2014). Thus, this study contributes to the analysis of the resource use efficiency, technical efficiency and economics efficiency of onion production among smallholder farmers and identifies the factors influencing efficiency of smallholder onion farmers.
Database and Methodology
Data for this study were collected from small farm onion growers in Perambalur district, which is one of major onion growing district in Tamil Nadu. It contributes around 24% of onion production of the total state production. However, the productivity (yield) of onion was only 7,543 kilogram (kg) ha-1 (2011-12), which
is low in comparison to the state average of 10,797 kg ha-1 (Season and Crops Report, 2013). Geographically,
Perambalur district located between 10o54’ and 11o30’
of North latitude and 78o40’ and 79o30’ of East longitude
and it is spread over in the area of 3,691.07 square kilometer. It lies in the Southern plateau and hill zone of Agro-climate regional planning with characteristics of semi-arid climate without any coastal line. The primary data were randomly collected from 90 onion growers with well-structured interview schedules during the year of 2012.
The Cobb-Douglas production function was used to estimate the resource-use or allocative efficiency and stochastic frontier production function analysis was used to evaluate the technical efficiency of onion production. Elasticity’s of production were estimated by an Ordinary Least Square (OLS) method. The estimated values of the
regression coefficients were tested for statistical significance with the help of ‘t’ test and the significance of the equation was tested by ‘F’ test for R2. The
specification of the model given below,
1 2 3 4 5 6 7 8 9 1 2 3 4 5 6 7 8 9
b b b b b b b b b
t
a X X X X X X X X X U
(1)
Where, Y = Yield of Onion (kg ha-1), X
1 = Bulb (kg ha -1), X
2 = Farmyard Manure (t ha-1), X3 = Nitrogen (kg ha-1),
X4 = Phosphorous (kg ha-1), X
5 = Potash (kg ha-1), X6 =
Plant Protection chemicals (Rupees (Rs) ha-1), X 7 =
Human Labour (mandays ha-1), X
8= Machine Labour
(hours (hrs) ha-1), X
9 = Farm size under onion (ha), Ut=
Error term.
The estimated coefficients of significant independent variables were used to compute the marginal value products (MVP) and the resources-use efficiency (r) was worked out using Equation (2) (Rahman and Lawal, 2003):
r = MVP / MFC
(2)
Where,MVPi = iY XPy X
Here, MVPi = Marginal value product of the ith input,
Yi= Geometric mean of the value of output,Xi = Geometric mean of the ith input,i = Estimated
co-efficient (or) elasticity of the ith input, and Py = Price of
output.
The relative percentage change in MVP of each resource was required to obtain optimal resource allocation estimated using Equation (3):
D = (1– MFC/MVP)
×
100
(3)
Where, D is the absolute value of percentage change in MVP of each resource (Mijindadi, 1980).
A stochastic frontier production model used for testing farm technical efficiency is the ability of a farmer to maximize output with given quantities of inputs and a certain technology (output-oriented) or the ability to minimize input uses with a given objective of output (input-oriented). Output-oriented technical efficiency is more commonly used in empirical applications and is defined as stochastic production frontier models were introduced by Aigner, Lovell, and Schmidt (1977), Meeusen and den Broeck (1977) and Battese and Coelli (1988). The multiplicative stochastic production function is of the form,
Y
i=
ii
Where, Yi = Output of the ith farmer, Xi = Input
quantities used by the ith farmer,= Parameters to be
estimated,i = A stochastic error-term consisting of two independent componentsUi andVi, andi = Vi–Ui.
The output is bounded by the stochastic variable Vi – Ui. The random error, Vi can be positive or negative. It captures the effects of random shocks outside the farmers control, observation and measurement error on dependent variable and statistical noise. It is assumed to be independent and identical as Vi N (0, 2v) a truncated normal, with truncations at zero of the normal distribution (Battese and Coelli, 1995). The other independent error term Ui is a non- negative (Ui>0) term representing farm specific technical inefficiency in the sense that it measures short fall output (Yi) from its maximum possible value given by stochastic frontier.
The variance of = (vi-ui) is given by,
2=
2 u+
2vWhere, the term2 is the variance parameter that
denotes the total deviation from the frontier,2 uis the
deviation from the frontier due to inefficiency, and2 vis
the deviation from the frontier due to stochastic noise.
=
2u
/ (
2u+
2v)
Where, is an indicator of relative variability of Ui and Vi that differentiates the actual yield from the frontier. When 2
v tends to zero, it implies that Ui is the
predominant error, then = 1. This means yield difference is mainly due to non-adoption of best practice or technique. When2u tends to zero, it implies that the Vi
is the predominant error and will be tending to zero. This means that yield differences from the frontier yield is mainly due to either statistical error or external factors that are not included in the model. When the model (4) is estimated, one can measure the mean technical efficiency of a farm. The following functional form was used to estimate the individual technical efficiencies and to examine the factors affecting them. The analysis (1) is done in a single step procedure by combining the following models (5), (6) and (7) using a computer program frontier version 4.1.
The stochastic frontier production function model specified for onion crop is given below:
Ln(y) = a
0+ a
1Ln(X
1) + a
2Ln(X
2) + a
3Ln(X
3) +
a
4Ln(X
4) + a
5Ln(X
5) + a
6Ln(X
6) + a
7Ln(X
7)
+ a
8Ln(X
8) + a
9Ln(X
9) + v
i– u
i(Cobb –
Douglas type)
(5)
Where, Y = Yield of onion (kg ha-1), X
1 = Bulbs (kg
ha-1), X
2 = Farmyard manure (t ha-1), X3 = Nitrogen (kg
ha-1), X
4 = Phosphorous (kg ha-1), X5 = Potash (kg ha-1),
X6 = Plant Protection Chemicals (Rs ha-1), X
7 = Human
labour (mandays ha-1), X
8= Machine labour (hrs ha-1),
X9 = Farm size under onion (ha).
The model for assessing technical inefficiency is given by Eq. (6):
U
i=
0 +
1Z1+
2Z2 +
3Z3
(6)
Where, Uiis the technical inefficiency in the ithfarm,Z1 is the experience in onion farming (in years), Z2 is the education of a farmer (in years), Z3 is the farm size (in ha), and1,2,3 are the inefficiency parameters.
The technical efficiency (TE) of individual farm was worked out using formula (7):
TE = Yi/Yi*
(7)
Where, Yi* is the frontier yield and Yi is the actual yield.
Results and Discussion
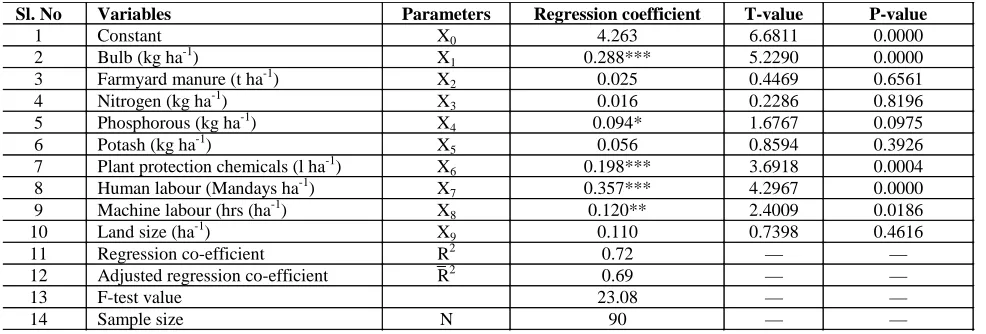
From the results of Cobb-Douglas production function analysis (Table.1), the co-efficient of multiple determination (R2) value at 0.72 would indicate that 72%
of the variation in onion yield was influenced by the explanatory variables included in the model.
In Cobb-Douglas production function, the coefficients are representing the production elasticity of the resources used. The coefficients of bulbs, plant protection chemicals and human labour were positive and significant at 1% which indicated that an increase in the usage of bulbs, plant protection chemicals and human labour by 1% from the existing mean level,ceteris paribus would increase the yield of onion by 0.29, 0.20 and 0.36% respectively. The variable machine hours was positive and significant at 5% and it is indicating that 1% change in machine hours from the existing mean level,ceteris paribus would increase the yield of onion by 0.12%. The viable phosphorous was positive and significant at 10% level and it is indicating that 1% change in phosphorous from the existing mean level, ceteris paribus would increase the yield of onion by 0.09% respectively.
values, farmyard manure, human labour are more than one in each case. It indicates that these resources are being used at suboptimum level and there exists the possibility of enhancing the yield of onion by increasing their use. The level of adjustments for use of various resources to earn optimum returns will a bench-mark for the onion stakeholders like growers, middle man, government and agricultural agencies, and agro-based companies in the study area.
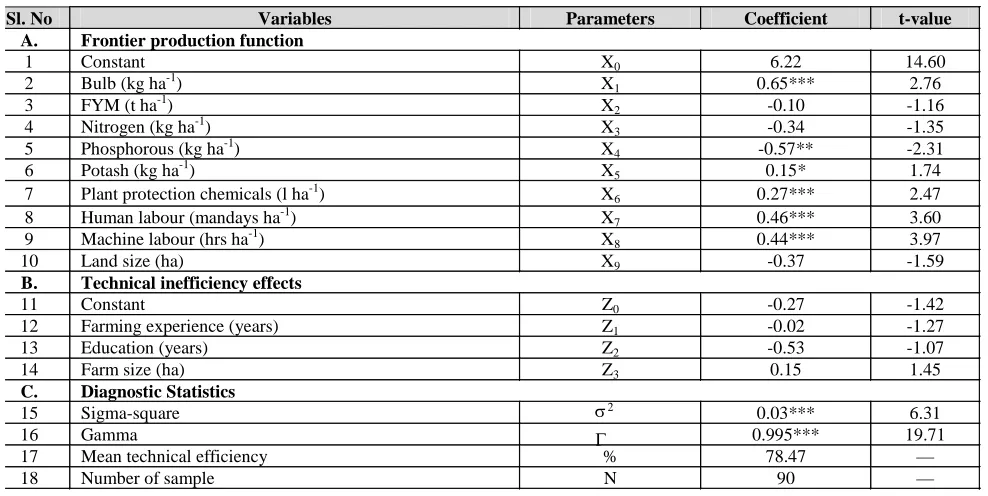
The parameters of the production factors and related statistical test results obtained from the stochastic frontier production function are presented in Table 3. The production function estimates indicate the relative importance of factor inputs in onion production. From the results, all except FYM, Nitrogen, Phosphorous and land size had the expected positive sign. This suggested that more output of onion would be obtained from the use of additional quantities of these variables,ceteris paribus. The estimate of gamma (ã) which is the ratio of the variance of farm specific performance of technical efficiency to total variance of output was significant at
one per cent level, indicating the presence of one sided error component. The variance ratio was estimated as 0.995, implying that about 99.5% of the disparities between the observed output and the frontier output were due to technical inefficiency (the variation in onion output was due to farmers’ practices rather than random variability). The coefficients (production elasticity) of inputs like planting material (bulb), plant protection chemicals, human labour and machine hours were significant at 1%, which implied that one per cent increase in the respective inputs could increase onion yield by 0.65, 0.27, 0.46 and 0.44 % respectively. The coefficient of phosphorous was negative significant at 1%, which implied that 1% increase in the respective input could decrease onion yield by 0.57% and the coefficient of potash was positive significant at 10% level, which implied that 1% increase in the respective input could increase onion yield by 0.15%. The variables farmyard manure, nitrogen and land size were found to be non-significantly efficient at technical level. This implies that, the sample farmers in the study area are lower rate of application of FYM.
Table 1: Results of Cobb-Douglas production function analysis
Sl. No Variables Parameters Regression coefficient T-value P-value
1 Constant X0 4.263 6.6811 0.0000
2 Bulb (kg ha-1) X1 0.288*** 5.2290 0.0000
3 Farmyard manure (t ha-1) X2 0.025 0.4469 0.6561
4 Nitrogen (kg ha-1) X3 0.016 0.2286 0.8196
5 Phosphorous (kg ha-1) X4 0.094* 1.6767 0.0975
6 Potash (kg ha-1) X5 0.056 0.8594 0.3926
7 Plant protection chemicals (l ha-1) X6 0.198*** 3.6918 0.0004
8 Human labour (Mandays ha-1) X7 0.357*** 4.2967 0.0000
9 Machine labour (hrs (ha-1) X8 0.120** 2.4009 0.0186
10 Land size (ha-1) X9 0.110 0.7398 0.4616
11 Regression co-efficient R2 0.72 — —
12 Adjusted regression co-efficient R2 0.69 — —
13 F-test value 23.08 — —
14 Sample size N 90 — —
*** Significant @1% level, **Significant @5% level, *Significant @10% level.
Table 2: Economic Efficiency of Resource Use in Onion Production
Sl.
No Variables Mean Regression
Marginal value of product
(MVP)
Marginal fixed cost (MFC)
MVP /MFC
Per cent adjustmen t required
1 Yield 10017
2 Bulb (kg ha-1) 993 0.29 37.06 12.04 3.08 67.52 3 Farmyard manure (t ha-1) 25 0.03 128.46 100.00 1.28 22.60 4 Nitrogen (kg ha-1) 60 0.02 34.26 7.02 4.88 79.52 5 Phosphorous (kg ha-1) 60 0.09 201.26 5.67 35.52 97.18 6 Potash (kg ha-1) 30 0.06 239.80 4.63 51.79 98.07 7 Plant protection chemicals (l ha-1) 1 0.20 20558.60 1331.26 15.44 93.52 8 Human labour (mandays ha-1) 224 0.36 203.54 161.03 1.26 20.88 9 Machine labour (hrs ha-1) 2 0.12 6229.88 648.83 9.60 89.59 10 Land size (ha)* 1 0.11 14048.38 5000 2.80 64.41
The variation in the levels of efficiency of onion growers ranged from 53.01 to 98.99 with mean efficiency of 78.47% in Table 4. About 4.44% of the farmers belonged to the most efficient category (96 to 100). Only 17.78% of the sample onion growers were belonging to efficiency groups falling between 66 to 70%. The relatively wide differential in technical efficiency of the ‘least’ practice and the ‘best’ practice farmer was an indication of potential for efficiency improvement. A possible explanation to this variation could be the varying socio-economic characteristics of the sampled farmers such as educational levels, membership of association, number of visit by extension agents, household size and system of land ownership must have influence the farmer ’s ability to effectively use the available technology; a situation that must have contributed to
the observed variation in their efficiency levels. An average level of technical efficiency for the farms was estimated to be 78%. Also The technical efficiency of about 70% of sample farmers has been found more than 75%, which indicates the possibility of increasing the yield of onion by adopting better technology.
Conclusion
The OLS estimates of Cobb-Douglas production function for onion revealed that the coefficients of bulbs, plant protection chemicals and human labour were positive and significant at 1% and the variable machine hour was positive and significant at 5% level. Phosphorous was positive and significant at 10% respectively. Economic efficiency indicates that bulb, Table 3: Results of Maximum Likelihood Estimator of stochastic frontier production function
Sl. No Variables Parameters Coefficient t-value A. Frontier production function
1 Constant X0 6.22 14.60
2 Bulb (kg ha-1) X1 0.65*** 2.76
3 FYM (t ha-1) X
2 -0.10 -1.16
4 Nitrogen (kg ha-1) X3 -0.34 -1.35
5 Phosphorous (kg ha-1) X4 -0.57** -2.31
6 Potash (kg ha-1) X5 0.15* 1.74
7 Plant protection chemicals (l ha-1) X6 0.27*** 2.47
8 Human labour (mandays ha-1) X7 0.46*** 3.60
9 Machine labour (hrs ha-1) X8 0.44*** 3.97
10 Land size (ha) X9 -0.37 -1.59
B. Technical inefficiency effects
11 Constant Z0 -0.27 -1.42
12 Farming experience (years) Z1 -0.02 -1.27
13 Education (years) Z2 -0.53 -1.07
14 Farm size (ha) Z3 0.15 1.45
C. Diagnostic Statistics
15 Sigma-square 2 0.03*** 6.31
16 Gamma 0.995*** 19.71
17 Mean technical efficiency % 78.47 —
18 Number of sample N 90 —
***Significant @1% level, **Significant @5% level, *Significant @10% level
Table 4: Frequency distribution of onion farms
Sl. No Range Number of farms Percentage of farms
1 00.51 - 00.55 2 2.22
2 00.56 - 00.60 0 0.00
3 00.61 - 00.65 7 7.78
4 00.66 - 00.70 16 17.78
5 00.71 - 00.75 14 15.56
6 00.76 - 00.80 14 15.56
7 00.81 - 00.85 13 14.44
8 00.86 - 00.90 7 7.78
9 00.91 - 00.95 13 14.44
10 00.96 - 01.00 4 4.44
Total 90 100.0
Mean technical efficiency 00.78 —
Minimum efficiency 00.53 —
nitrogen, phosphorous, potash, plant protection chemicals, machine hours, land size values, farmyard manure, human labor are being used at suboptimum level and there exists the possibility of enhancing the yield of onion by increasing their use. The stochastic frontier production function resulted that, the coefficients of inputs like bulb, plant protection chemicals, human labour and machine hours were significant at 1% respectively and the sample farmers were technically efficient with 78% in onion cultivation. Thus this result has indicated that bulbs, plant protection chemicals human labour and machine hour were the significant inputs in onion cultivation. Hence concerted efforts will be taken to train the farmers in the optimal use of inputs towards reaping the full benefit from onion cultivation. The results suggests that farmers could increase output through more intensive use of seed material, potash, plant protection chemicals, human labour and machine hours inputs given the prevailing state of technology. This could be achieved through development of awareness of agricultural practices by the government as well as removal all distributional bottlenecks, which affect the availability and prices of improved seeds and fertilizers at the grass root. In the long term, higher technical efficiency could be achieved by improving farmers’ educational status through adult education and literacy campaigns. Also, extension agents should be adequately trained and equipped to help the farmers imbibe the culture of sound agronomic practices that would ensure increased onion production in the study area.
References
Abu, O., Asember, D.J. 2011. Opportunities for smallholder spinach, farmers in Nigeria; A profit efficiency analysis.Journal of Economics,2 (2):75-79.
Aigner, D., Lovell, C.A.K. and Schmidt, P. 1977. Formulation and Estimation of Stochastic Frontier Production Function Models. Journal of Econometrics,6: 21-37.
Battese, G. and Coelli, T. 1988. Prediction of firm-level technical efficiencies with a generalized frontier Production function and panel data.Journal of Economics,28(4): 387-399.
Battese, G.E. and Coelli, T.J. 1995. A Model for Technical Inefficiency Effects in a Stochastic Frontier Production Function for Panel Data.Empirical Economics,20: 325-332.
Bhendi, M.J. and Kalirajan, K.P. 2007. Technical efficiency of major food and cash crops in Karnataka (India).
Indian Journal of Agricultural Economics,62(2): 176-192.
Boris, E., Bravo-Ureta and Antonio, E.P. 1997. Technical, Economic, and Allocative efficiency in peasant farming. Evidence from the Dominican Republic. Development Economics,35(1): 48-67.
Bravo-Ureta, B.E. and Riegler, L. 1991. Dairy Farm Efficiency Measurement Using Stochastic Frontier and Neoclassical Duality. American Journal Agricultural Economics,73: 421-428.
Bravo-Ureta, B.E. and Pinheiro, A.E. 1997. Technical, Economical, and Allocative Efficiency in Peasant Farming: Evidence from the Dominican Republic. Development Economics,35(1): 48-67.
Dawang, N.C., Ayuba, D. and Matawal, O.M. 2011. Estimates of profitability and Technical Efficiency of Artisanal Fisheries. A case study of Natural Lakes from Plateau State Nigeria.Asian Journal of Agricultural Science,3(6): 516-523.
DEMIC. 2013. Press Note, Domestic and Export Market Intelligence Cell, Centre for Agricultural and Rural Development Studies, Tamil Nadu Agricultural University, Coimbatore, India.
Effiong, E.O. and Onyenweaku, C.E. 2006. Profit efficiency in Bloilerproduction in Akwa Ibom State, Nigeria. Department of Agricultural economics, Michael Okpara University of Agriculture, Umudike, Umuakwa, Abia State, Nigeria. International Journal of Agriculture and Rural Devlopment,7(1): 72-79.
Facayode, S.B., Rahji, M.A.Y., Fayeye, T.R. and Yinusa, S.O. 2011. Technical, Efficiency of Small Scale Rabit Production in South-West, Nigeria. Journal of Agricultural Research and Development,10(1). Government of India (GOI). 2014. Indian Horticulture
Database 2013, National Horticulture Board. Ministry of Agriculture, Government of India, Gurgaon-122 015, India.
Karthick, V., Alagumani, T. and Amarnath, J.S. 2013. Resource–use Efficiency and Technical Efficiency of Turmeric Production in Tamil Nadu — A Stochastic Frontier Approach. Agricultural Economics Research Review,26(1): 109-114. Meeusen, W. and Broeck, V.D. 1977. Efficiency estimates
from Cobb-Douglas production function with composed error.International Economic Review, 18(2): 435-444.
Ogunniyi, L.T. 2011. Profit Efficiency among maize producers in Oyo State, Nigeria.ARPN Journal of Agricultural and Biological Sciences,6(11): 11-17. Otieno, D.J., Hubbard, L. and Ruto, E. 2012. Determinants of Technical Efficiency in Beef Cattle Production in Kenya. A Paper Presented at theInternational Association of Agricultural Economist (IAAE) Triennial Conference, Foz do Iguacu, Brazil. Rahman, S.A. and Lawal, A.B. 2003. Economic analysis
of maize based cropping systems in Giwa local government area of Kaduna State,ASSET Report Series, No. 3, Nigeria.
Samuel Mburu, L., Chris Ackello-Ogutu, and Richard Mulwa. 2014. Analysis of Economic Efficiency and Farm Size: A Case Study of Wheat Farmers in
Nakuru District, Kenya, Economics Research International Volume 2014 (2014), Article ID 802706. http://dx.doi.org/10.1155/2014/ 802706.
Season and Crop Report. 2013. Fasli 1419, Department of Economics and Statistics, Chennai, Tamil Nadu, India.
Shehu, J.F., Iyortyer, J.T., Mshelia, S.I. and Jongur, A.A.U. 2010. Determinants of Yam Production and Technical Efficiency among Yam Farmers in Benue State, Nigeria.Journal Social Sciences,24(2): 143-148.