Available online on 30.08.2019 at http://jddtonline.info
Journal of Drug Delivery and Therapeutics
Open Access to Pharmaceutical and Medical Research© 2011-18, publisher and licensee JDDT, This is an Open Access article which permits unrestricted non-commercial use, provided the original work is properly cited
Open Access
Research Article
Evaluation of Anti-Hyperlipidemic Activity of Ethanolic Extract of
Cassia
Fistula
Leaf
Chourasia Vivek
1*, Ahmad Shohrab
2, Parmar Arvind
2, Kulkarni Sneha
2, Sahu Nitendra K
3.
1 RKDF College of Pharmacy, SRK University, Bhopal, MP, India 2 Department of Pharmacy, Barkatullah University, Bhopal, MP, India
3 KNP College of Pharmacy, Bhopal MP, India
ABSTRACT
The present study was designed to perform evaluate antihyperglycemic activity of ethanolic extract of Cassia Fistula leaf. Leaf of cassia fistula was extracted using ethanol as solvent by soxhlet apparatus. The evaluation of antihyperlipidemic activity was done using High Fat Diet induced hyperlipidemia models in Wistar albino rats. The work entitled evaluation of anti-obesity activity of leaf of Cassia fistulawas to determine the efficacy and safety in experimental animals. Both aqueous and alcoholic extract of leaf of Cassia Fistula (Linn.)have shown significant reduction in weight of heart and both the kidney as compared to cafeteria diet fed animals confirming their anti-obesity property. The aqueous and alcoholic extract of leaf of Cassia Fistula (Linn.)has shown significant decrease in serum levels of Total-Cholesterol, LDL-Cholesterol, VLDL-Cholesterol and Triglyceride.
Keywords: Antihyperglycemic, cassia fistula, hyperlipidemia, High fat diet, alcoholic extract
Article Info:Received 18 June 2019; Review Completed 19 Aug 2019; Accepted 23 Aug 2019; Available online 30 Aug 2019 Cite this article as:
Chourasia V, Ahmad S, Parmar A, Kulkarni S, Sahu NK, Evaluation of Anti-Hyperlipidemic Activity ofEthanolic Extract of
Cassia Fistula Leaf, Journal of Drug Delivery and Therapeutics. 2019; 9(4-A):685-693
http://dx.doi.org/10.22270/jddt.v9i4-A.3552
*Address for Correspondence:
Vivek Chourasia, Asst. Professor, RKDF College of Pharmacy, SRK University, Bhopal, MP, India
INTRODUCTION
Globally, there are more than 1 billion overweight adults and at least 300 million of them are obese. Obesity and overweight pose a risk for chronic diseases including Type- II diabetes, cardiovascular disease, hypertension, stroke due to increased consumption of energy-dense foods containing high amount of saturated fat and sugars and reduced physical activity. The lipids of human plasma are transported in macromolecular complexes termed lipoproteins. A number of metabolic disorders that involve elevations in levels of any of the lipoprotein species are thus termed hyperlipoproteinemias or hyperlipidemias. The term hyperlipemia denotes increased levels of triglycerides in plasma. The two major clinical sequelae of the
hyperlipoproteinemias are acute pancreatitis and
atherosclerosis. The former occurs in patients with marked hyperlipemia. Control of triglycerides can prevent recurrent attacks of this life-threatening disease. Obesity is the state of excess body fat stores, which should be distinguished from overweight (i.e. excess body weight relative to a person’s height). Obesity refers specially to having an abnormally high proportion of body fat or adipose tissue in relation to
lean muscle mass. Obesity is often simply defined “a condition of abnormal or excessive accumulation of adipose tissue, to the extent that health may be impaired”. People with abdominal fat distribution or ‘android obesity’ are at greater risk to its consequences than those with the less serious ‘gynoid’ fat distribution where fat is more evenly and peripherally distributed around the body.Increasingly secondary lifestyle of modern living combined with the availability of tempting, high-fat (junk) foods has almost
caused an epidemic of obesity in the affluent nation1,2.
other medicinal plants. In modern times, and in any controlled clinical trials, commercial preparations have tended to be standardized extracts of the whole plant. The plant has documented to possess analgesic, anti-inflammatory , antioxidant , antidiabetic , as well as hepatoprotective activity. Since many disease conditions
commonly treated with Cassia fistula in traditional medical
systems are considered self-limiting, its purported benefits need critical evaluation. This review summarizes current scientific findings and suggests areas where further research
is needed and also to verify the therapeutic efficacy of Cassia
fistula 3,4.
MATERIALS AND METHODS
Collection of plant material
Herb was collected from the market place at Ghoda Nakkas from Moolchand and Foolchand Brothers, suppliers of Ayurvedic Medicinal plants in Bhopal, (M.P.) and leaf were purchased in the month of July-2011. Root part was separated and was made completely clean, dust free. Authentification of plant
Plant was identified and authentified by Dr. Zea Ul Hasan Professor, Head of Department, H.O.D. Botany, Saifia Science College, Bhopal, (M.P.), and a voucher specimen no. 295/Bot/Saifia/11 was assigned.
Preparation of extract
The powdered leaf was extracted with petroleum ether to remove lipids and then again extracted with ethanol in soxhlet extractor. The extract was concentrated under
vacuum to get the residue. The residue was dried in vacuum desiccators. The extractive yield of ethanol was found to be more, and it was selected for antiobesity activity. All the test suspensions (100 mg/ml) were prepared in the vehicle, i.e., 5% w/v acacia mucilage and were administered in the dose
of 200 mg/kg orally. Each time before extracting with
alcohol, petroleum ether treated drug was air dried. For aqueous extract fresh untreated drug was taken5.
After the effective extraction, solvent was concentrated at room temperature in reduced pressure using a rotary evaporator and water was removed by heating on water bath. The color and consistency of the extract was noted. Extract were subjected to chemical investigation and pharmacological screening for its antiobesity activity.
Evaluation of anti-obesity activity Test drug
Both the aqueous and alcoholic extract was given as
suspension prepared by dissolving of both extract in 2%
acacia suspension to make test solution. Cafeteria diet
The cafeteria diet consisted of 3 diets (condensed milk 48 g + bread 48 g), (chocolate 18 g + biscuit 36 g + dried coconut 36 g) and (cheese 48 g + boiled potatoes 60 g). The three diets were given to each group of 6 rats on day 1, 2 and 3 respectively and then repeated in same succession for 42 days in addition to normal pellet chow.
Table 1 Drug dose and route of administration
Drug Dose Route of drug administration
Orlistat 40 mg/kg Orally
Alcoholic extract 200 mg/kg Orally
Aqueous extract 200 mg/kg Orally
Lection of animals: - (Animal care and handling)
Wistar albino rats of either sex weight (75-175 g) were selected respectively, procured from institute’s animal breeding house. The animals were acclimatized to the
standard laboratory conditions in well cross ventilated
animal house at temperature 25±2°C relative humidity
44-56% and light and dark cycles of 10 and 14 hours
respectively for 1 week before and during the experiments.
The animals were fed with standard diet and water ad
libitum. The experiments were approved by CPCSEA and the
institutional ethics committee.
Table 2 Grouping and treatment of animal in high fat diet induced obesity in experimental rats
Diet Group I
(Normal pellet chow ad Libitum)
Group II (Cafeteria diets + Normal pellet
chow)
Group III (Cafeteria Diet + Normal pellet
chow)
Group IV (Cafeteria Diet + Normal pellet
chow)
Group V (Cafeteria Diet + Normal pellet
chow) No. of animals
used 6 6 6 6 6
No. of days
studied 42 42 42 42 42
Treatment 2% Acacia suspension 1ml/100g body
weight
___ Orlistat 40
mg/kg (p.o.) Alcoholic extract of Cassia Fistula (200 mg/kg/p.o.)
Aqueous extract of Cassia Fistula
(200 mg/kg/p.o.) Evaluation
Procedure
Wistar Albino rats of either sex (75-175g) were given high fat diet for 42 days. Thirty rats were randomly divided into 5 groups of six animals each. The following schedule of dose,
diet administration in experimental groups was followed.
6-10
Group: I- The animals received 2% acacia suspension 1
ml/100 gm/p.o. and served as normal control.
Group: II- The animals received only high fat diet and
served as negative control.
Group: III-The animals received Orlistat 40mg/kg/p.o.
suspended in 2% acacia suspension and high fat diet. The above mentioned treatment schedule followed for the respective group of animals for 42 days.
Group: IV- The animals received high fat diet and
treated with alcoholic extract of Cassia Fistula
(200mg/kg/ p.o) suspended in 2% acacia suspension.
Group: V- The animals received high fat diet and
treated with aqueous extract of Cassia Fistula (200
mg/kg/ p.o) suspended in 2% acacia suspension.
Daily all experimental animals were given high fat diet
with drug treatment of Orlistat, ethanolic and aqueous
leaf extract of Cassia Fistula.
Evaluation parameters
Body weight: The body weight (g) was recorded on 1st week
and then on every week for 42 days.
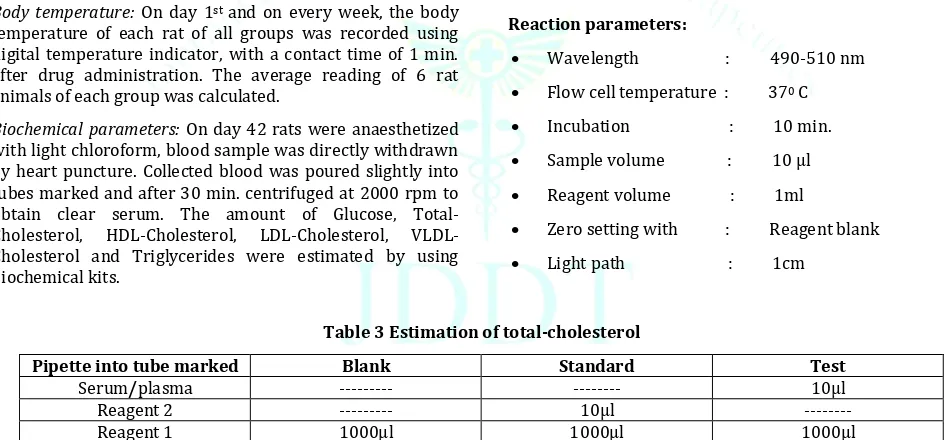
Body temperature:On day 1st and on every week, the body
temperature of each rat of all groups was recorded using digital temperature indicator, with a contact time of 1 min. after drug administration. The average reading of 6 rat animals of each group was calculated.
Biochemical parameters:On day 42 rats were anaesthetized with light chloroform, blood sample was directly withdrawn by heart puncture. Collected blood was poured slightly into tubes marked and after 30 min. centrifuged at 2000 rpm to obtain clear serum. The amount of Glucose, Total-Cholesterol, HDL-Total-Cholesterol, LDL-Total-Cholesterol, VLDL-Cholesterol and Triglycerides were estimated by using biochemical kits.
Estimation of Glucose:The glucose was determined by Aspen Diagnostics kit Gluco-Check (Glucometer) which reads the blood glucose level manually. The amount of glucose was
calculated in mg/dl 11-15.
Estimation of total-cholesterol
Autospan Diagnostic’s kit was used for estimation of Total-Cholesterol, which followed CHOD/POD method.
Procedure
(a) Taken 200µl of clear serum into tubes added 200 µl of
reagent 3 and incubated at temperature for (15-300 C)
for 10 min.
(b) Kept all tubes in cooling centrifugation chamber at
2000 rpm for 15 minute for HDL Cholesterol
estimation.
(c) Added 100 µl of supernatant from step 1 reagent 4.
Added 100 µl of reagent 1. Incubate at 370 C for 10 min.
measured the absorbance of different sample.
Working reagent preparation: All the reagents are ready to use.
Reagent storage and stability: All the Reagents are stable
at 2-80 C untill the expiry date mentioned on the container
label. Do not freeze the Reagent.
Procedure: Fresh clear serum with no hemolysis was used for estimation.
Reaction parameters:
Wavelength : 490-510 nm
Flow cell temperature : 370 C
Incubation : 10 min.
Sample volume : 10 µl
Reagent volume : 1ml
Zero setting with : Reagent blank
Light path : 1cm
Table 3 Estimation of total-cholesterol
Pipette into tube marked Blank Standard Test
Serum/plasma --- --- 10µl
Reagent 2 --- 10µl ---
Reagent 1 1000µl 1000µl 1000µl
Mix well; incubate at 370 C for 10 minute or at room
temperature (15-300 C) for 30 minutes.
Programme the analyser as per assay parameters.
Blank the analyser with reagent blank.
Measured absorbance of standard followed by the test.
Calculated the results as per given calculation formula.
Calculation
Absorbance of test
Cholesterol concentration (mg/dl) = × 200 Absorbance of standard
Estimation of HDL-cholesterol
HDL-Cholesterol was estimated using Span Diagnostics kit, which follows the CHOD/POD method.
Procedure
(a) Taken 200µl of clear serum into tubes added 200 µl of
reagent 3 and incubated at temperature for (15-300 C)
for 10 min.
(b) Kept all tubes in cooling centrifugation chamber at
2000 rpm for 15 minute for HDL Cholesterol
estimation.
(c) Added 100 µl of supernatant from step 1 reagent 4.
Added 100 µl of reagent 1. Incubate at 370 C for 10 min.
measured the absorbance of different sample. Table 4 Estimation of HDL-cholesterol, step-I
Pipette into tube marked Test
Serum/Plasma 200µl
Mixed well and kept at room temperature (15-300 C) for 10
minutes. Centrifuge for 15 minutes at 2000 rpm and separated clear supernatant. Use the supernatant for HDL-Cholesterol estimation.
Table 5 Estimation of HDL-cholesterol, step-II
Pipette into tube marked Blank Standard Test
Supernatant from Step-1 --- --- 100µl
Reagent-4 --- 100 µl ---
Reagent-1 1000µl 1000µl 1000µl
Mix well incubate at 37 0 C for 10 minutes or at room
temperature (15-300 C) for 30 minutes.
Programmed the analyzer with reagent blank.
Measured absorbance of standard followed by the test.
Calculated results as per given calculation formula.
Calculation:
Absorbance of test HDL-Cholesterol concentration (mg/dl)= ×50×2*
Absorbance of standard
*(2 dilution factor, as sample is diluted 1:1 in step 1) Estimation of LDL-Cholesterol and VLDL-Cholesterol: The amount of LDL-Cholesterol and VLDL-Cholesterol were calculated using friedewald’s equation**
LDL-Cholesterol =
Total-Cholesterol – Triglycerides – HDL-Cholesterol 5
VLDL-Cholesterol = Triglycerides/5
LDL-Cholesterol = Total–Cholesterol – (HDL+VLDL) Estimation of triglycerides
Triglycerides was estimated using accurate Triglycerides kit of Span Diagnostics Pvt. Ltd. Accurately triglycerides estimation kit is formulated using GPO and peroxide for quantitative estimation of serum triglycerides. This method is more specific due to use of lipase to liberate glycerol which is estimated.
Principle
Triglycerides are hydrolysed by lipoproteins lipase (LPL) to produce Glycerol and Free Fatty Acids (FFA). In presence of Glycerol Kinase (GK), Adenosine and Adenosine Diphosphate (ADP). Glycero 3-Phosphate is further oxidized by Glycerol 3-Phosphate Oxidase (GPO) to produce Dihydroxyacetone
Phosphate (DAP) and H2O2. In presence of Peroxidase (POD),
Hydrogen Peroxide couples with 4-aminoantipyrine (4-AAP) and 4-Cholorophenol to produce red Quioneimimine dye. Absorbance of coloured dye is measured at 505 nm and id proportional to Triglycerides concentration in the sample. LPL
Triglycerides Glycerol + FFA GK
Glycero + ATP Glycerol 3-phosphate + ADP GPO
Glycero 3- phosphate + O2 DAP +H2O2
POD
2H2O2 + 4-AAP + Chorophenol Quinoneimine dye + 4H2O Reagent composition: The kit contains 3 Reagents bottle:
(a) Enzyme reagents
(b) Diluent buffer
(c) Standard
Preparation of working reagent:
The contents of enzyme reagent were dissolved in 10 ml of diluent buffer. The working reagent is stable for 4 - 6 week at 2 - 80 C.
Procedure: Fresh clear serum with no hemolysis was used for estimation.
Wavelength :490-550 nm
Flow cell temperature: 370 C
Incubation : 10 minutes
Sample volume : 10µl
Reagent volume : 1000µl
Zero setting with :Reagent blank
Table 6 Estimation of triglycerides
Pipette into tube marked Blank Standard Test
Serum/Plasma --- --- 10µl
Reagent 2 --- 10µl ---
Reagent 1 1000µl 1000µl 1000µl
Mix well. Incubate at 370 C for 10 minutes. Programme the
analyser as per above assay parameters.
1. Blank the analyser with Reagent Blank.
2. Measure absorbance of standard followed by the test.
3. Calculate results as per given calculation formula.
Calculation:
Absorbance of Test
**For Glycerol free Triglycerides:
Glycerol free Triglycerides = calculated Triglycerides - 10 mg/dl
Organ weight:
The animals were sacrificed by excess ether anesthesia and then midline abdominal incision was made. Different organ like live heart and both the kidney were isolated and weighed.
Statistical analysis: -
The results of each parameter in different groups were analyzed by the application of one-way analysis of variance-ANOVA. The multiple comparisons to elicit the significant differences between various groups were performed by means of Tukey test. Value of p<0.05, p<0.01, p<0.001 were
considered statistically significant 16-19.
RESULTS AND DISCUSSIONS
The alcoholic as well as the aqueous extract of the leaf of Cassia Fistula (Linn.) showed a significant antiobesity profile.
Effect of cafeteria diet induced obesity:
Cafeteria diet increase food intake and causes obesity in human as well as in animals. Further the composition and variety of cafeteria food exert synergistic effect on development of obesity. This model is of particular importance as it is much closer to human obesity, where in it explains various parameters like body weight, body temperature, serum biochemical parameters and internal organ weight.
Body weight:
It has been reported that variety of highly palatable energy rich carbohydrate cafeteria food elicited significant increase in body weight in as well as in animals due to increase in body fat content. As expected cafeteria fed animals showed significant increase in body weight when compared with normal group.
The standard drug Orlistat was significantly effective in reducing body weight. The aqueous extract showed moderate decrease in weight. Thus we may say that they exhibit appetite suppressing activity.
The mean body weight difference observed with standard, alcoholic and aqueous extract. (Table-7, Figure 1)
Table 7 Effect of alcoholic and aqueous extract of leaf of Cassia Fistula (Linn.)on body weight (g) in cafeteria fed diet rats
Sr.
No Groups Body weight (g)
% Change in Body weight 0 week 1st week 2nd week 3rd week 4th week 5th week 6th week
1. Control (1ml/100 g 2% acacia suspension)
77.89
±2.37 113.92 ±3.67 115.72 ±0.92 94.87 ±1.27 113.24 ±1.15 116.91 ±3.17 118.11 ±0.83 34.05
2. High fat cafeteria
diet 88.01 ±2.29 130.93 ±2.26 a**
131.36 ±1.63 a***
138.42 ±0.91 a***
141.10±1.24 a***
142.69 ±2.93 a***
144.83 ±1.40 a***
39.23
3. Cafeteria diet +
Orlistat (40mg/kg) 156.11 ±2.71 a***, b***
171.21 ±2.75 a***, b***
184.77 ±0.63 a***, b***
194.34 ±1.54 a***, b***
197.40±3.02 a***, b***
197.27 ±3.02 a***, b***
195.96 ±0.92 a***, b***
20.34
4. Cafeteria diet + Alcoholic extract (200mg/kg/p.o.)
162.72 ±3.61 a***, b***
174.09 ±2.45 a***, b***
177.11 ±0.66 a***, b***,c***
177.59 ±1.11 a***, b**,c***
173.78±1.54 a***, b**,c***
165.41 ±3.68 a***, b**, c***
163.06 ±1.40 a***, b***, c***
0.22
5. Cafeteria Diet + Aqueous extract (200mg/kg/ p.o.)
175.53 ±3.48 a***,b**, c***,d*
183.22 ±2.78 a***,b**,c*
197.06 ±1.28 a***,b*** c***,d***
197.06 ±1.28 a***,b**,d***
196.43±0.72 a***,b**,d***
190.08 ±3.19 a***,b**, d***
180.70 ±1.47 a***,b**, c***,d***
2.86
Data are expressed in mean ± SEM, n= 6 (no. of six animals) in each groups,*p<0.05, **p<0.01, ***p < 0.001 compared with multiple group using One-way ANOVA followed by Tukey multiple comparison test.
a = significant difference in compared with vehicle treated group. b= significance difference in compared with high fat diet group.
Figure 1 Effect of alcoholic and aqueous extract of leaf of Cassia Fistula (Linn.) on body weight (g) in cafeteria fed diet rats
Body temperature
In the animal model of obesity there will be decrease in diet induced thermogenesis due to decrease in sympathetic activation of brown adipose tissue. The main factor of this decrease in diet induced thermogenesis is the neurotransmitter NPY synthesized throughout the brain. NPY causes increase in food intake within 10-15 min.,
combined with a reduction in thermogenesis on its endogenous release. NPY inhibits thermogenesis by reducing activation of brown adipose tissue. Accordingly the significant decrease in body temperature was observed in cafeteria diet fed rats when compared with control animals. The standard drug Orlistat significantly reversed the decrease in body temperature thus showing a significant rise in temperature. (Table-8, Figure-2)
Table 8 Effect of alcoholic and aqueous extract of leaf of Cassia Fistula (Linn.) on body temperature in cafeteria fed diet rats
Sr. No Groups Difference in Body Temperature 0 week 1st week 2nd week 3rd
week 4
th
week 5
th
week 6
th
week 1. Control (1ml/100 g 2%
acacia suspension)
39.52 ±0.61
39.38 ±0.53
39.06 ±0.27
39.10 ±0.80
39.00 ±0.57
39.50 ±0.29
39.65 ±0.33
2. High fat cafeteria diet 39.55
±0.43 43.28 ±0.73 a***
44.43 ±0.32 a***
43.8 ±0.57 a**
45.21 ±0.51 a***
45.81 ±0.40 a***
45.73 ±0.32 a***
3. Cafeteria diet + Orlistat (40 mg/kg/p.o.)
39.3 ±0.73
42.06 ±0.50 a**,c*
42.55 ±0.55 a***, b **
42.60 ±1.35 a*
41.4 ±0.47 a***,b***
40.6 ±0.40 a***, b***
40.51 ±0.56 a*, b***
4. Cafeteria diet + Alcoholic
extract (200 mg/kg/ p.o.) 38.1 ±0.52 44.21 ±0.44 a***,c**
45.16 ±0.21 a***,c***
44.56 ±0.89 a***
42.01 ±0.47 a***, b***
42.3 ±0.46 a***,b***, c*
42.40 ±0.32 a***,b***,c*
5. Cafeteria diet + Aqueous
extract (200mg/kg/p.o.) 38.72 ±0.38 45.15 ±0.23 a***
45.66 ±0.22 a***,c***
45.5 ±0.80 a***
42.88 ±0.37 a***,b*
44.03 ±0.42 a***,b*c***,d*
44.09 ±0.39 a***, c, d* Data are expressed in mean ± SEM, n = 6 (no. of six animals) in each groups, *p<0.05, **p<0.01, ***p < 0.001 compared with multiple group using One-way ANOVA followed by Tukey multiple comparison test.
a = significant difference in compared with vehicle treated groups. b= significance difference in compared with high fat diet groups.
Figure 2 Effect of alcoholic and aqueous extract of leaf leaf of Cassia Fistula (Linn.) on body temperature in cafeteria fed diet rats
Serum biochemical parameters
In obesity, the lipid disorder is characterized by increase in serum levels of Total-Cholestrol, LDL-Cholesterol, and Triglycerides along with low levels of serum HDL-Cholesterol. Accordingly the cafeteria fed rats displayed significant increase serum level of Total-Cholesterol, Triglycerides, LDL-Cholesterol and VLDL-Cholesterol. Along with moderate increase in serum HDL-Cholesterol levels as compared to cafeteria diet control. Treatment with standard drug Orlistat has resulted in reduction in serum level of Triglycerides, Total-Cholesterol, LDL-Cholesterol and
VLDL-Cholesterol. Along with moderate in serum HDL-Cholesterol levels as compared to cafeteria diet control. The aqueous
and alcoholic extract of leaf of Cassia Fistula (Linn.) has
shown significant decrease in serum levels of
Total-Cholesterol, LDL-Cholesterol, VLDL-Cholesterol and
Triglycerides. (Table-9, Figure-3). The aqueous as well as alcoholic extract significantly reduces the serum levels of HDL-Cholesterol. (Table-9, Figure-3) Obesity is associated with Hperinsulinemia and insulin resistance to increase in blood glucose levels. As expected the cafeteria diet fed rats showed significant increase in serum glucose levels when compared to normal group of rats. (Table-9, Figure-3)
Table 9 Effect of alcoholic and aqueous extract of leaf of Cassia Fistula (Linn.)on serum biochemical parameters in cafeteria fed diet rats
Sr.
No Groups Glucose (mg %) Cholesterol (mg %) HDL (mg %) LDL (mg %) VLDL (mg %) (mg %) TGS
1. Control (1ml/100 g
2% acacia suspension) 191.33 ±0.66 133.98 ±0.50 53.79 ±0.93 65.18 ±0.75 15.01 ±0.51 75.05 ±2.33
2. High fat cafeteria diet 430.166
±0.98 a***
146.81 ±0.88 a***
21.43 ±0.76 a***
106.28 ±0.29 a***
19.10 ±0.73 a**
95.53 ±2.12 a***
3. Cafeteria diet +
Orlistat (40mg/kg/p.o.)
227.83 ±1.10 a***, b***
117.29 ±0.74 a***, b***
30.98 ±0.79 a***, b***
82.3 ±0.11 a***, b***
4.99 ±0.61 a***, b***
24.98 ±2.27 a***, b***
4. Cafeteria diet +
Alcoholic extract
(200mg/kg/p.o.)
367.66 ±1.45 a***, b***
c***
131.40 ±1.47 b***, c***
33.57 ±1.02 a***, b***
86.47 ±0.33 a***, b***
c***
11.36 ±0.71 a**, b***,
c***,
63.81 ±3.09 a*, b***,
c***
5. Cafeteria diet +
Aqueous extract
(200mg/kg/p.o.)
441.16 ±1.49 a***, b***,
c***, d***
139.88 ±0.57 a***, b***,
c***, d***
37.58 ±0.79 a***, b***,
c***, d*
87.9 ±0.47 a***, b***,
c***
14.4 ±0.59 b***, c***,
d*
72.0 ±3.16 b***, c***,
Data are expressed in mean ± SEM, n = 6 (no. of six animals) in each groups,*p<0.05, **p<0.01, ***p < 0.001 compared with multiple group using One-way ANOVA followed by Tukey multiple comparison test.
a = significant difference in compared with vehicle treated groups. b= significance difference in compared with high fat diet groups.
Figure 3 Effect of alcoholic and aqueous extract of leaf of Cassia Fistula (Linn.) on serum biochemical parameters on cafeteria diet fed rats
Internal organ weight
Obesity is associated with increased adipose tissue accumulation in the body. It is reported that cafeteria diet feeding in female rats leads to significant increase in internal organ weight, confirming to this, the cafeteria diet group of rats showed significant increase in weight of liver, and both kidney increase in weight of heart when compared to normal
groups. Orlistat has decreased consumption of diet and thus decrease in weight of kidney and liver and decrease weight of heart when compared to cafeteria diet fed animals. Both
aqueous and alcoholic extract of leaf of Cassia Fistula (Linn.)
have shown significant reduction in weight of heart and both the kidney as compared to cafeteria diet fed animals confirming their anti-obesity property. (Table-10, Figure-4)
Table 10 Effect of alcoholic and aqueous extract of leaf of Cassia Fistula (Linn.) on organ weight (g) in cafeteria diet fed rats
Sr. No Groups Liver Heart Kidney
Left Right
1. Control (1ml/100 g 2% acacia
suspension) 0.90±0.06 0.79±0.00 0.87±0.06 0.73±4.21
2. High Fat Cafeteria diet 1.38±0.14 0.96±0.02 a** 0.95±0.01 0.93±7.57
3. Cafeteria Diet + Orlistat (40 mg/kg
p.o.) 0.84±0.41 0.77±0.03 b
** 1.04±0.03 a* 0.75±6.9
4. Cafeteria Diet + Alcoholic extract
(200 mg/kg p.o.) 0.79±0.46 0.69±0.04 b
*** 0.82±0.04 c** 0.80±1.68
5. Cafeteria Diet + Aqueous extract
(200 mg/kg p.o.) 0.76±0.04 0.78±0.05 b
** 1.03±0.02 a*, d** 0.85±0.02
Data are expressed in mean ± SEM, n = 6 (no. of six animals) in each groups,*p<0.05, **p<0.01, ***p < 0.001 compared with multiple group using One-way ANOVA followed by Tukey multiple comparison test.
a = significant difference in compared with vehicle treated groups. b= significance difference in compared with high fat diet groups.
Figure 4 Effect of alcoholic and aqueous extract of leaf of Cassia Fistula (Linn.) on organ weight (g) in cafeteria diet fed rats
CONCLUSIONS
The work entitled evaluation of anti-obesity activity of leaf of Cassia fistula was to determine the efficacy and safety of leaf extract in experimental animals. The plant was preliminary collected, authenticated and was subjected for extraction to obtain different extract. The crude extract was subjected to phytochemical analysis for presence of glycoside, flavonoids, saponins etc. Concluding that the alcoholic extract of leaf of Cassia fistula has comparatively shown better antiobesity activity than as compared to the aqueous extract of the leaf.
Acknowledgments:
The authors wish to express thanks to Principal, Truba College of Pharmacy, Bhopal, India for providing lab facility and support.Conflicts of Interests:
The authors report no conflicts of interest.REFERENCES
1. Prashar Y, Venkataraman S, International Journal of Phytopharmacology 2010;1(2):103-108.
2. Zedah RM, Nejad MM, Shahin M, Obesity Pandemic an iranian perspective. Arch Iranian Med 2005; 8(1): 1-7.
3. Murali KS. Differential reproductive success in Cassia fistula in different habitants-A case of pollinator limitations? In: Current Science (Bangalore), 65 (3). pp. 270-272.
4. Khandelwal KR. A Handbook of Practical Pharmacognosy, techniques & experiments 9th edition, 2008; 157-161. 5. Kumar SVS, Sujatha C, Syamala J. Protective effect of root
extract of Operculina turpenthum (Linn.) Against paracetamol-induced hepatotoxicity in rats. Indian Journal of Pharmaceutical Science 2006; 68(1): 32-35.
6. Loots MA, Lamme EN, Zeegelaar J, Mekkes JR, Bos JD, Middelkoop E. Differences in cellular infiltrate and extracellular matrix of chronic diabetic and venous ulcers versus acute wounds. J Invest Dermatol1998; 111(5):850-7. 7. Zedah RM, Nejad MM, Shahin M. Obesity Pandemic an Iranian
Perspective. Arch Iranian Med, 2005; 8(1): 1-7.
8. Regilane, MS, Flavia, AS, Vietta, SN. The Lipid Lowering Effects of trans- dehydrocarotin a clearoden diterpene from Croton
Cajucara Benth in mice fed on high fat diet. J. Pharm. 2000; 535-539.
9. Liu R, Zhang ZJ, Liu WC.Anti-Obesity effects of protopanaxdiol types of Ginsenosides isolated from the leaves of American ginseng (Panax quinquefolius L.) in mice fed with a high-fat diet. Fitoterapia, 2010; 81(8): 1079-1087.
10. Fahey TJ, III, Sadaty A, Jones WG, Barber A, Smoller B, Shires GT. Diabetes impairs the late inflammatory response to wound healing. J Surg Res,1991; 50(4):308-13.
11. Santosh RS. Pharmacology and Pharmacotherapeutics, Revised Nineteenth Edition, Popular Prakashan Pvt. Ltd., 2005; 575.
12. Scott D, Larsen, Mark, Connell A, Michele, Cudahy M. Synthesis and Biological Activity of Analogues of the Antidiabetic/Antiobesity Agent 3 Guanidinopropionic Acid: Discovery of a Novel Aminoguanidinoacetic Acid Antidiabetic Agent. J. Med. Chem; 44, 200: 1217-1230.
13. Song MY, Kim EK. Antiobesity activity of aqueous extracts of Rhizoma Dioscoreae Tokoronis on high-fat diet-induced obesity in mice, J Med Food, 2009; 12(2): 304-9.
14. Vuong T, Benhaddou-Andaloussi A, Brault A. Antiobesity and ant diabetic effects of bio transformed blueberry juice in KKAy mice. International Journal of Obesity 2009; 1-8.
15. Yoshida T, Sakane N, Wakabayashi Y. Anti-obesity effect of CL 316,243, a highly specific 3-adrenoceptor agonist, in mice with monosodium-l-glutamate-induced obesity. Eur J Endocrinol 1994; 131, 97-102.
16. Thomas W, Robert B, Womble LG. Effect of Sibutramine plus Orlistat in obese women following 1 year of treatment by Sibutramine alone. A placebo controlling trial. Obesity Research, 2000; 8(8): 431-437.
17. Jeong YS, Jung HK, Cho KH. Anti-obesity effect of grape skin extract in 3T3-L1 adipocytes, Food Science and Biotechnology 2011; 20(3):635-642.
18. Sung YY, Yoon T, Kim SJ. Anti-obesity activity of Allium fistulosum L. extract by down-regulation of the expression of lipogenic genes in high-fat diet-induced obese mice. Molecular Medicine Reports 2011; 4(3): 431-435.