RESEARCH ARTICLE
IMPLEMENTATION OF A PQ-INTEGRATED SINGLE PHASE SMART METER USING MULTIPLE LOW
COST MICROPROCESSORS
*Hung, N. C.
Division of Electrical Engineering, Faculty of Electronics and Telecommunications, Saigon University, No. 273 An Duong Vuong Street, Ward 3, District 5, Hochiminh City, Vietnam
ARTICLE INFO
ABSTRACT
A single-phase smart meter is built by using multi-microprocessors. The meter structure consists of different modules for measuring power energy and power quality, it also includes data storage and metering interface units. The characterized function of the meter is the instrumentations and measurements of harmonics, voltage variation, and voltage flicker. Besides, the user can acquire electricity consumption information through real-time measurement results which can be displayed on the meter, the user’s mobile phone, and the web pages at a fixed duration. Finally, a prototype is built and tested in laboratory, and the test results validate the feasibility of the smart meter system.
Copyright © 2018, Hung. This is an open access article distributed under the Creative Commons Attribution License, which permits unrestricted use, distribution, and reproduction in any medium, provided the original work is properly cited.
INTRODUCTION
Due to the shortage of energy source, the awareness of electric power conservation is increasing. In power system, a smart grid employs Information Technology (IT) and Intelligent Appliances (IA) to regulate the loading of a user, so it can reduce electric power assumption and increase the operation efficiency of an electric network (Louie, 2010; Sahin, 2013; Liu, 2010). However the fundamentals of smart grid is Advanced Metering Infrastructure (AMI), and the smart meter is the kernel of AMI. On the other hand, high-tech industry is having been quickly developed, and a great number of precise instruments and power quality sensitive devices are widely added to the power network. Besides, various high-efficient power converters are increasingly used for electric power energy conversion in different facility. The non-linear characteristics of this kind of loads have caused power quality distortion, such as harmonics, spike, notch, and etc. (R. C. Dugan, 2000; Barrera Nunez, 2008; Barrera Nunez, 2008). So power quality needs to be continuously concerned for the successful operation of all equipments in a smart grid. The effective solution of power quality problem depends on the
accurate realization of the on-line power quality
characteristics.
*Corresponding author: Hung, N. C.,
Division of Electrical Engineering, Faculty of Electronics and Telecommunications, Saigon University, No. 273 An Duong Vuong Street, Ward 3, District 5, Hochiminh City, Vietnam.
Since the smart meter is with the capability of power information acquisition and bidirectional communication (Kang, 2011; Megalingam, 2011; Erol-Kantarci, 2011; Zheng, 2010; Luan, 2009), it can be simultaneously used for remote power quality monitoring. Therefore, a power IC (ADE7953), three different microprocessors (F2407A, TMS320-F2812, and MSP430), a certain of signal conversion devices, and different communication modules are integrated to build up a prototype of a smart meter system in the paper. The functions of the system include electric power energy consumption recording, billing, and different power quality indices monitoring, the user can easily understand the conditions of power consumption and quality via the client-server structure of the internetwork. The test results of prototype meter system show that it is suitable for a high voltage industry system or a low voltage residential circuit.
Metering system structure
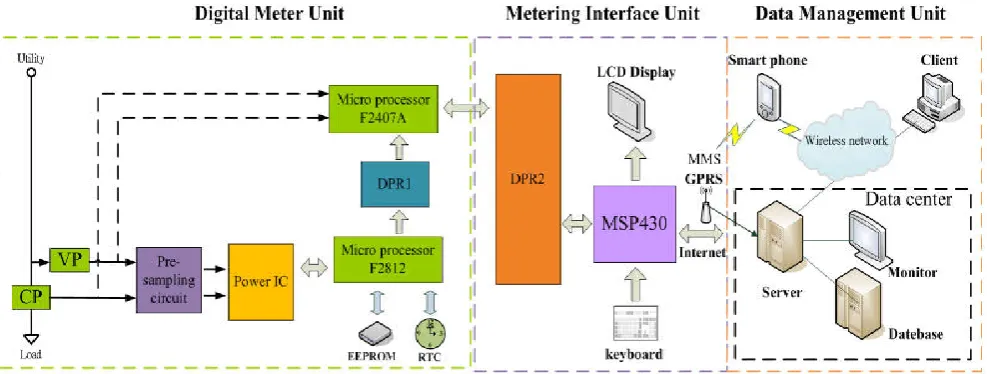
The hardware structure of the smart meter system includes Digital Power Meter Unit (DPMU), Metering Interface Unit (MIU), and electric power Data Management Unit (DMU) as shown in Fig.1.The raw voltage and current signals are separately sampled and analyzed for electric power energy consumption and power quality measurements in the digital power meter unit. The real-time accumulative electric energy information is stored in EEPROM module, and then delivered to MIU.
ISSN: 0976-3376
Vol. 09, Issue, 10, pp.8943-8948, October,Asian Journal of Science and Technology 2018SCIENCE AND TECHNOLOGY
Article History: Received 17th July, 2018 Received in revised form 25th August, 2018
Accepted 20th September, 2018 Published online 30th October, 2018
Key words:
Smart Meter,
Advanced Metering Infrastructure, Smart Grid, Power Quality, Instrumentation and Measurement.
Citation: Hung, N. C. 2018. “Implementation of a PQ-integrated single phase smart meter using multiple low cost microprocessors”, Asian Journal of
Besides, the real-time power quality conditions are also transferred to MIU at different instant. Both of the energy and power quality information are then passed to data management unit which consists of a mobile phone and a client-server internet platform. To implement the functions of the smart meter system, Figure 2 shows the flowchart of the software main programs. Firstly, all microprocessors are initialized; then the microprocessor, TMS320-F2812, starts to sample the electric power signals from the output of the power IC, ADE7953, and the power energy consumption is calculated and stored to the memory device, EEPROM, at a fixed time interval of 7.5 seconds. Besides, different power parameters, such as average power, reactive power, power factor, and etc., are also collected at the same time period. All above general power data are temporally stored into the Dual-Port-Ram 1 (DPR1) and then transferred to DPR2 by the microprocessor, TMS320-T2407A. Finally, the Metering Interface Unit (MIU) will upload the power information in DPR2 to the data management unit through the internet system or to the user’s mobile phone by wireless communication of GPRS module. Similarly, the raw voltage and current signals will be respectively sampled and analyzed to collect power quality information, including harmonics every 15 seconds and voltage flicker every one minute. The individual operation of DPMU, MIU, and DMU is described as follows:
Digital Power Meter Unit
Fig. 1 shows the hardware structure of dual-core microprocessors includingF2812 and TMS320-F2407A, the power system voltage and current signals are respectively attenuated and isolated by Voltage Probe (VP) and Current Probe (CP). And the output signals of VP and CP are then input to a pre sampling circuit of the power IC (ADE7953) which is used to measure the power parameters including real power, reactive power, power factor, voltage and current rms values. All of these power parameter information are then processed by the microprocessor, TMS320-F2812, stated as above, and Fig.3 shows the flow chart for DPMU to implement the collection of power parameter and voltage variation information. Besides, Fig. 1 also illustrates that the output signals of VP and CP are sampled and analyzed by the microprocessor, TMS320-F2407A, for power quality analysis including harmonics and voltage flicker. The flow chart for DPMU to collect harmonics and voltage flicker information is shown in Fig.4.
Metering Interface Unit
The microprocessor, MSP430, is the kernel of the module, it receives the electric power and power quality measurement results from DPMU as shown in Fig. 1. Meanwhile, all data are displayed and refreshed on the LCD monitor at a different time period of 7.5 seconds or 15 seconds, different power parameters and power quality indices can be also selected and displayed on LCD monitor according to user’s demand. Besides, MIU will upload all power and power quality information to DMU through internet, but the information of an emergent event, such as overload or voltage sag, will be automatically sent to a particular cellular phone through GPRS module. The flow chart for above data processing is shown in Fig. 5.
Data Management Unit
A database is built up in the unit, and Fig.6 and Fig.7 show different data format for power quality information of voltage variation and electric power parameters. Besides, different web pages are used to display long-term variation trends for all information by client-server modes, so the users can read the interested information through internet connection.
Performance test results
To validate the feasibility and the functions of the prototype smart meter system, a series of tests were respectively performed in the laboratory for electric power parameters and power quality monitoring, and the test results are described as follows.
Electric power parameters measurement: Fig.8. shows the
test results on the LCD display for a low voltage power line, including rms voltage and current (Vrms and Irms), apparent power (S), real power (P), reactive power (Q), and power factor (PF). The spinning disc symbol is used to simulate the operation of a classical mechanic power meter, the spinning speed is proportional to the real power assumption.
Power quality measurement: An auto transformer is used to simulate various voltage variation events, such as voltage sag or swell. Figure 9 shows the typical test result for a voltage sag disturbance, it can be seen that the voltage amplitude and duration are respectively equal to 64% and 0.827 seconds.
Fig.2. Flow chart of the main program for the metering system
Fig.4. Flow chart for DPMU to collect harmonics and voltage flicker information
Fig. 6. Data format of voltage variation
Fig.7. Data format of electric power parameters
Fig.8. Typical test results for electric power parameters measurement by the proposed smart meter prototype for
a power line in laboratory
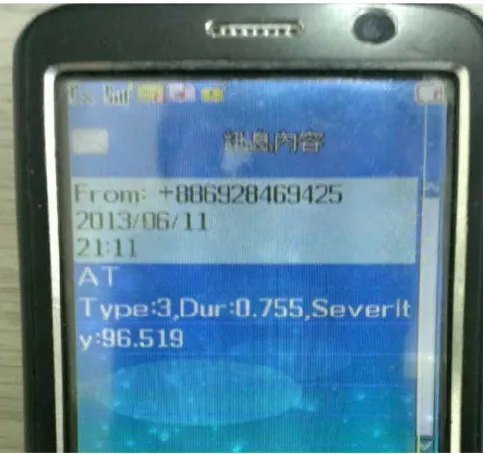
In addition, MIU sent a alarm message to user’s cellular phone through GPRS module asa voltage variation over a preset level happened to the power circuit as shown inFigure 10, the sag severity was 96.52% (voltage amplitude was 3.48%) for a duration of 0.755 seconds.For the other power quality disturbances including voltage flicker and harmonics,a power circuit supplying nonlinear loads such as PC, projector, AC/DC converters, and etc. was monitored, and the test results was combined into the DMU webpage display tests.Power parameters and power quality information management and display on DMUAs power parameters or power quality indices are uploaded to DMU by MIU, they will be stored to the database, and then they will be processed and displayed on different web pages immediately. Therefore, the real time situation of the power circuit can be realized by the user as he is connected to the internet. The typical test results are shown from Figure 10 to Figure 12for the monitoring results ofrms voltage trend, voltage flicker (Vrms and ΔV10), harmonic (THDV), and power parameters (Vrms, Irms, S, P, Q, PF, power energy). It can be seen from the figures that: (1)the
trend of ΔV10 in Figure 10 is within a range between 0.8~1.0 Vp-p, and the rms voltage is in the range of 110~125V;
(2)THDV in Figure 11 is less than 6%; (3)the trend of power
parameters including Vrms, apparent power (S), real power (P), reactive power (Q), power factor (PF), and power energy (Whr) can be simultaneously reported on the same webpage.
Fig.9. Voltage sag event measurement result by the proposed smart meter system in power quality monitoring mode
Fig.9. Typical alarm message sent to user’s cellular phone through GPRS wireless mode
Fig.11. Webpage showing voltage harmonics trend
Fig.12. Webpage showing power parameters trend
Conclusion
The kernel of Advanced Metering Infrastructure (AMI) is smart meter, and AMI is the key factor for a successful smart grid; besides, power quality needs to be guaranteed for a modern power system. Therefore, a smart meter system with power quality monitoring function is proposed in this paper, the meter system is built using multiple low-cost microprocessors to increase its feasibility. And a single phase prototype meter system was built, and the desired functions were tested in the laboratory. The important results include: (1)the smart meter is successfully implemented with a power IC (ADE7953) and three different microprocessors (TMS320-F2407A, TMS320-F2812, and MSP430), and a mini data management unit is also constructed by client-serve mode;
(2)the performance of the smart meter is proved from the laboratory test results; (3) users can easily understand the real-time information about the electric power consumption, emergent power circuit event, and power quality variation through internet communication.
REFERENCES
Barrera Nunez V., J. Melendez Frigola, and S. Herraiz Jaramillo, 2008. A Survey on Voltage Sag Events in Power
Systems,Proceedings of the 2008 IEEE Conference on
Transmission and Distribution, pp.1-3.
Barrera Nunez V., J. Melendez Frigola, S. Herraiz Jaramillo, and J. Sanchez Losada, 2008. Unusual Voltage Sag Event
Detection in Power Systems,Proceedings of 2008
IEEE/PES Latin America Transmission and Distribution Conference and Exposition, Aug. pp.1-5.
Dugan R. C., M. F. McGranaghan, and H. W. Beaty, 2000.
Electrical Power Systems Quality, McGraw-Hill
International Editions.
Erol-Kantarci M. and H.T. Mouftah, 2011. Wireless Sensor
Networks for Cost-Efficient Residential Energy
Management in the Smart Grid, IEEE Transactions on
Smart Grid, pp.314-325.
Kang M.S., Y.L. Ke, and J.S. Li, 2011. Implementation of
smart loading monitoring and control system with ZigBee
wireless network, Proceeding of 2011 6th IEEE
Conference on Industrial Electronics and Applications (ICIEA), pp.907-912.
Liu E., M.L. Chan, C.W. Huang, N.C. Wang, and C. N. Lu, 2010. Electricity Grid Operation and Planning Related
Benefits of Advanced Metering Infrastructure, Proceeding
5th International Conference on Critical Infrastructure (CRIS), pp. 1-5.
Louie H., M. Burns, and C. Lima, 2010. An Introduction and User's Guide to the IEEE Smart Grid Web Portal,
Proceeding IEEE Conference on Innovative Smart Grid Technologies, Europe, pp. 1-5.
Luan S.W., J.H. Teng, S.Y. Chan, and L.C. Hwang, 2009. Development of a Smart Power Meter for AMI Based on
Zig-Bee Communication. Proceeding IEEE International
Conference on Power Electronics and Drive Systems, pp. 661-665.
Megalingam R.K., A. Krishnan, B.K. Ranjan, and A.K. Nair, 2011. Advanced digital smart meter for dynamic billing,
tamper detection and consumer awareness, Proceedings of
2011 3rd International Conference on Electronics Computer Technology (ICECT), pp.389-393.
Sahin D., T. Kocak, S. Ergut, C. Buccella, C. Cecati, and G.P. Hancke, 2013. A Survey on Smart Grid Potential
Applications and Communication Requirements, IEEE
Transactions on Industrial Informatics, pp. 28-42.
Zheng Z.H., X.J Zhou, and W. Zhang, 2010. Design and Implementation of Remote Meter Reading System.
Proceeding 2nd International Conference on Software Technology and Engineering (ICSTE), 247-250.