Available online on 15.02.2019 at http://jddtonline.info
Journal of Drug Delivery and Therapeutics
Open Access to Pharmaceutical and Medical Research© 2011-18, publisher and licensee JDDT, This is an Open Access article which permits unrestricted non-commercial use, provided the original work is properly cited
Open
Access
Research Article
Reverse Phase-High Performance Liquid Chromatography method development and validation for estimation of efavirenz by Quality by Design approachWaghmare Santosh A a, Kashid Arun M b
aJSPM’s Charak College of Pharmacy and Research(Affiliated to Savitribai Phule Pune University), Wagholi, Pune- 412207, India bDepartment of Pharmaceutical Chemistry, Sinhgad Institute of Pharmacy, Narhe, Pune 411041, Maharashtra, India
ABSTRACT
Quality by design (QbD) refers to the achievement of certain predictable quality with desired and predetermined specifications. A very useful component of the QbD is the understanding of factors and their interaction effects by a desired set of experiments by using software (design expert 8). The present study describes the development of a comprehensive science and risk based HPLC method which is given by design expert 8 and subsequent validation for the analysis of Efavirenz active pharmaceutical ingredient (API) using a quality by design approach. An efficient experimental design based on systematic scouting of all four key components of the RP‐HPLC method (column, pH, mobile phase and flow rate) is presented. The described method was linear. R2=0.9998. The precision, ruggedness and robustness values were also within the prescribed limits (<1% for system precision and <2% for other parameters). Chromatographic peak purity results indicated the absence of co‐eluting peaks with the main peak of Efavirenz. The proposed method can be used for routine analysis of Efavirenz in quality control laboratories.
Keywords: Quality by design, HPLC, Efavirenz, design expert 8.
Article Info:Received 16 Jan 2019; Review Completed 10 Feb 2019; Accepted 12 Feb 2019; Available online 15 Feb 2019 Cite this article as:
Waghmare SA, Kashid AM, Reverse Phase-High Performance Liquid Chromatography method development and validation for estimation of efavirenz by Quality by Design approach, Journal of Drug Delivery and Therapeutics. 2019; 9(1-s):319-330 DOI:http://dx.doi.org/10.22270/jddt.v9i1-s.2357
*Address for Correspondence:
Mr. Santosh A. Waghmare, JSPM’s Charak College of Pharmacy and Research (Affiliated to Savitribai Phule Pune University), Wagholi, Pune- 412207, India
1. INTRODUCTION
1.1 Introduction to Drug Molecule
Chemically efavirenz is (4S)-6-chloro-4-(2- cyclopropylethynyl)-4-(trifluoromethyl)-2,4-dihydro-1H-3,1-benzoxazin-2-one. It has molecular formula of C14H9ClF3NO2. It is crystalline powder having white or slightly yellowish colour. The melting point of Efavirenz is ranging from 136.00C to 141.00C. Efavirenz is a non-nucleoside reverse transcriptase inhibitor (NNRTI). Efavirenz is directly connected to the enzyme and blocks the enzyme catalytic site. It is used as a part of highly active antiretroviral therapy for the treatment of human immunodeficiency virus. The drug is used in combination with other anti-retroviral agents for the treatment of HIV-1 infection in children’s and adults. The usual dosage of efavirenz is 600mg per day. It is usually taken on empty stomach at bedtime to reduce neurological and psychiatric adverse effects. Structure of efavirenz is given in Figure no 1.1
1.2 Quality by Design (QbD) is a concept first outlined by Juran in various publications. Juran believed that quality could be planned and that most quality crises and problems
relate to the way in which quality was planned in the first place. Experimental design (DoE), as a tool of QbD, can be defined as the strategy for setting up experiments in such a manner that the information required is obtained as efficiently and precisely as possible. Experimental design (DoE) is a powerful technique used for exploring new processes, gaining increased knowledge of the existing processes and optimizing these processes for achieving world-class performance. Experimentation is performed to determine the relationship between factors acting on the response. 2
O
N O
H
Cl
F
F F
The choice of DoE is very important for the success of any industrial experiment. The proper selection was based on the process knowledge and depended on the following factors: Number of factors and interactions to be studied Complexity of using each design
Statistical validity and effectiveness of each design Ease of understanding and implementation Nature of the problem
Cost and time constraints
The potential benefits of using a DoE rather than using traditional “one factor at a time” experimentation are summarized below:
Improved process yield and stability Improved profits
Improved process capacity Reduced process variability Reduced manufacturing costs
Reduced process design and developing time.2
1.3 Full three-level factorial designs by Design expert 8 Software.
Full three-level factorial design is an experimental matrix that has limited application in RSM when the factor number is higher than 2 because the number of experiments required for this design (calculated by expression N = 3k, where N is experiment number and k is factor number) is very large, thereby losing its efficiency in the modelling of quadratic functions. Because a complete three-level factorial design for more than two variables requires more experimental runs than can usually be accommodated in practice, designs that present a smaller number of experimental points, such as the Box–Behnken, central composite, and Doehlert designs, are more often used. However, for two variables, the efficiency is comparable with designs such as central composite. The majority of applications of three-level factorial designs are in the area of chromatography.2,3,4,5,6.
2. MATERIAL AND METHODS 2.1 Apparatus
A UV- vis Spectrophotometer (Jasco/ v-630), was used with quartz cells of 10mm path length; HPLC (Jasco 12000 series); Column Symmetry C-18, 4.6*250mm, 5µm particle size (Waters); analytical balance (Contech, CB-50 series); ultrasonicator cleaning bath ( spectra lab / UCB-400); filter papers 0.45µm.
2.2 Materials
Efavirenz reference standard was obtained as gift sample from Lupin Ltd. Aurangabad, Maharashtra, India and formulation was procured from the market. Ammonium formate buffer of research grade was obtained from Fine chem. Industries Ltd. Mumbai. Acetonitrile of HPLC grade was used for research from Merck Pvt. Ltd. Mumbai.
Stock solution of Efavirenz 1000µg/ml was prepared by using 10mg of Efavirenz in 10ml of methanol.
2.3 Chromatographic System
Analysis was carried on Symmetry C-18 4.6*250mm, 5µm particle size column at 292 nm. The samples were introduced through a Rheodyne injector valve with 20-µl sample loop. The mobile phase consisted of acetonitrile and
ammonium formate (72:28, v/v), filtered through a membrane filter (0.45µ), degassed in ultrasonic bath, and pumped at a flow rate of 1.0 ml/min.
3. RESULTS AND DISCUSSION 3.1 Design of Experiment Two Columns have used Column C8
Column C18
3.1.1 3 level Factorial design (Miscellaneous Factorial design)
Selected Factorial design was miscellaneous Factorial design due to it has flexibility to change/add/delete any parameter at any time when our experiment is going on.it provide facility to give standard run at one time at only one mobile phase.6
3.1.2 There are selected four mobile phase Acetonitrile : Water
Acetonitrile: Ammonium format buffer
Methanol : Water
Methanol : Ammonium format buffer.3,4,5,6
3.1.3 Miscellaneous Factorial design can pick up one mobile phase. So selected each mobile phase one by one. Acetonitrile : Water
Change pH Range: 3-5
Change Mobile phase proportion Range: 60-80% (Consider Acetonitrile)
Change flow rate range: 0.8-1.2
When all above ranges put in Miscellaneous Factorial design. It gave 27 run at different pH, Mobile phase proportion and flow rate.
Followed same procedure for each mobile phase. That is for column C-8 has four mobile Phase and column C-18 has four mobile Phases with 27 run for each mobile phase. Each column has its 108 run. After completion of all trails software give one optimize best value for each column. Optimization means finding an alternative with the most cost effective or highest achievable performance under the given constraints, by maximizing desired factors and minimizing undesired ones. In comparison, maximization means trying to attain the highest or maximum result or outcome without regard to cost or expense.
Miscellaneous factor design was utilised for method development in order to evaluate the effects of amount of buffer, buffer pH and flow rate on responses. Total 27 runs were suggested by the software. Factors and responses considered for study were shown in table 1. Ranges considered were based upon previous univariate chromatographic separation studies. For amount of organic range was 60 to 80 % v/v, for pH of buffer 3 to 5 and for flow rate 0.8 to 1.2 mL min-1.7,8.
3.2 Optimization
3.2.1 Screening design for suitable chromatographic condition:
C18 columns at pH 3.0, 4.0 and 5.0. These mobile phases were screened by varying the organic phase composition from 60 to 80 % v/v and flow rate from 0.8 to 1.2 mL/ min flow rate consider to be standard 1 ml/min because result are not satisfactory with 0.8 and 1.2 ml/min.
3.2.2 Results of various trials, having organic phase composition 60 % v/v are shown in following tables.
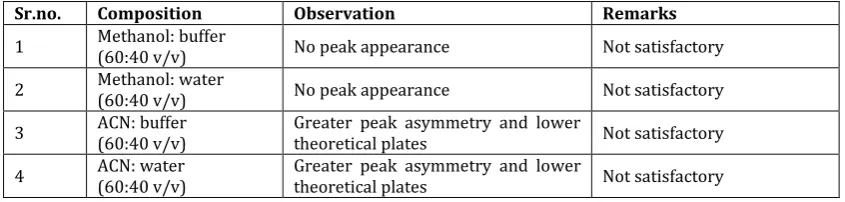
Table 1: Trials performed on C8 column at mobile phase (60:40 v/v) with aqueous phase pH 3 Sr.no. Composition Observation Remarks
1 Methanol: buffer (60:40 v/v) No peak appearance Not satisfactory
2 Methanol: water (60:40 v/v) No peak appearance Not satisfactory
3 ACN: buffer (60:40 v/v) Greater peak asymmetry and lower theoretical plates Not satisfactory
4 ACN: water (60:40 v/v) Greater peak asymmetry and lower theoretical plates Not satisfactory
Table 2: Trials performed on C18 column at mobile phase (60:40 v/v) with aqueous phase pH 3 Sr. no. Composition Observation Remarks
1 Methanol: buffer (60:40 v/v) Greater peak Asymmetry and lower theoretical plates Not satisfactory
2 Methanol: water (60:40 v/v) No peak appearance Not satisfactory
3 ACN: buffer (60:40 v/v) Less peak asymmetry but less theoretical plates Not satisfactory
4 ACN: water (60:40 v/v) Less peak asymmetry with more theoretical plates Satisfactory
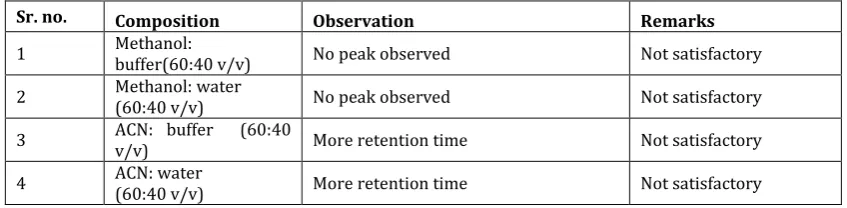
Table 3: Trials performed on C8 column at mobile phase (60:40 v/v) with aqueous phase pH 4 Sr.no. Composition Observation Remarks
1 Methanol: buffer (60:40 v/v) No peak appearance Not satisfactory
2 Methanol: water (60:40 v/v) No peak appearance Not satisfactory
3 ACN: buffer (60:40 v/v) More retention time Not satisfactory
4 ACN: water (60:40 v/v) More retention time Not satisfactory
Table 4: Trials performed on C18 column at mobile phase (60:40 v/v) with aqueous phase pH 4
Sr.no. Composition Observation Remarks
1 Methanol: buffer (60:40 v/v) No peak appearance Not satisfactory
2 Methanol: water (60:40 v/v) No peak appearance Not satisfactory
3 ACN: buffer (60:40 v/v) Good peak properties Satisfactory
4 ACN: water (60:40 v/v) More retention time Not satisfactory
Table 5: Trials performed on C8 column at mobile phase (60:40 v/v) with aqueous phase pH 5
Sr. no. Composition Observation Remarks 1 Methanol: buffer (60:40 v/v) No peak observed Not satisfactory
2 Methanol: water (60:40 v/v) No peak appearance Not satisfactory
3 ACN: buffer (60:40 v/v) Greater peak asymmetry with less theoretical plates Not satisfactory
Table 6: Trials performed on C18 column at mobile phase (60:40 v/v) with aqueous phase pH 5
Sr. no. Composition Observation Remarks
1 Methanol: buffer(60:40 v/v) No peak observed Not satisfactory
2 Methanol: water (60:40 v/v) No peak observed Not satisfactory
3 ACN: buffer (60:40 v/v) More retention time Not satisfactory
4 ACN: water (60:40 v/v) More retention time Not satisfactory
3.2.3 Results of various trials, having organic phase composition 70 % v/v are shown in following tables. Table 7: Trials performed on C8 column at mobile phase (70:30 v/v) with aqueous phase pH 3 Sr.
no. Composition Observation Remarks 1 Methanol: buffer (70:30 v/v) Greater peak asymmetry and lower theoretical plates Not satisfactory
2 Methanol: water (70:30 v/v) More retention time Not satisfactory
3 ACN: buffer (70:30 v/v) Greater peak asymmetry and lower theoretical plates Not satisfactory
4 ACN: water (70:30 v/v) Greater peak asymmetry Not satisfactory
Table 8: Trials performed on C18 column at mobile phase (70:30 v/v) with aqueous phase pH 3 Sr.
no. Composition Observation Remarks 1 Methanol: buffer (70:30 v/v) More retention time Not satisfactory
2 Methanol: water (70:30 v/v) More retention time Not satisfactory
3 ACN: buffer (70:30 v/v) Less peak asymmetry with more theoretical plates and good retention time More satisfactory
4 ACN: water (70:30 v/v) Less peak asymmetry with more theoretical plates and good retention time satisfactory
Table 9: Trials performed on C8 column at mobile phase (70:30 v/v) with aqueous phase pH 4
Sr.no. Composition Observation Remarks
1 Methanol: buffer (70:30 v/v) Greater peak asymmetry with lower theoretical plates Not satisfactory
2 Methanol: water (70:30 v/v) No peak appearance Not satisfactory
3 ACN: buffer (70:30 v/v) Less peak asymmetry with more theoretical plates and good retention time satisfactory
4 ACN: water (70:30 v/v) Greater peak asymmetry with more theoretical plates Not satisfactory
Table 10: Trials performed on C18 column at mobile phase (70:30 v/v) with aqueous phase pH 4
Sr.no. Composition Observation Remarks
1 Methanol: buffer (70:30 v/v) More retention time Not satisfactory
2 Methanol: water (70:30 v/v) More retention time Not satisfactory
3 ACN: buffer (70:30 v/v) Less peak asymmetry with more theoretical plates and good retention time Satisfactory
Table 11: Trials performed on C8 column at mobile phase (70:30 v/v) with aqueous phase pH 5 Sr. no. Composition Observation Remarks 1 Methanol: buffer (70:30 v/v) More retention time Not satisfactory
2 Methanol: water (70:30 v/v) Greater peak asymmetry Not satisfactory
3 ACN: buffer (70:30 v/v) Greater peak asymmetry with less theoretical plates Not satisfactory
4 ACN: water (70:30 v/v) Greater peak asymmetry with less theoretical plates Not satisfactory
Table 12: Trials performed on C18 column at mobile phase (70:30 v/v) with aqueous phase pH 5 Sr. no. Composition Observation Remarks 1 Methanol: buffer (70:30 v/v) More retention time Not satisfactory 2 Methanol: water (70:30 v/v) More retention time Not satisfactory 3 ACN: buffer (70:30 v/v) Less peak asymmetry with more theoretical plates and good retention time More satisfactory
4 ACN: water (70:30 v/v) Less peak asymmetry with more theoretical plates and good retention time satisfactory
3.2.4 Results of various trials, having organic phase composition 80 % v/v are shown in following tables. Table 13: Trials performed on C8 column at mobile phase (80:20 v/v) with aqueous phase pH 3 Sr. no. Composition Observation Remarks
1 Methanol: buffer (80:20 v/v) Greater peak asymmetry and More retention time Not satisfactory
2 Methanol: water (80:20 v/v) Greater peak asymmetry Not satisfactory
3 ACN: buffer (80:20 v/v) Greater peak asymmetry Not satisfactory
4 ACN: water (80:20 v/v) Greater peak asymmetry and lower theoretical plates Not satisfactory
Table 14: Trials performed on C18 column at mobile phase (80:20 v/v) with aqueous phase pH 3 Sr. no. Composition Observation Remarks
1 Methanol: buffer (80:20 v/v) Lower theoretical plates Not satisfactory 2 Methanol: water (80:20 v/v) Lower theoretical plates Not satisfactory 3 ACN: buffer (80:20 v/v) Less retention time Not satisfactory 4 ACN: water (80:20 v/v) Lower theoretical plates satisfactory
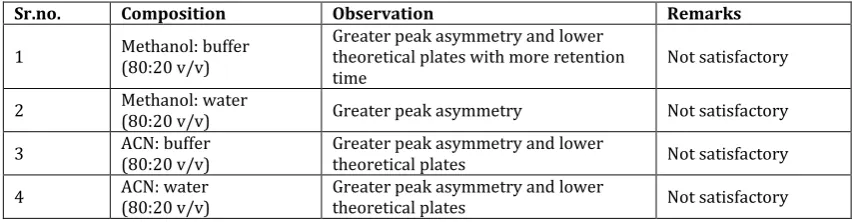
Table 15: Trials performed on C8 column at mobile phase (80:20 v/v) with aqueous phase pH 4 Sr.no. Composition Observation Remarks
1 Methanol: buffer (80:20 v/v) Greater peak asymmetry and lower theoretical plates with more retention
time Not satisfactory
2 Methanol: water (80:20 v/v) Greater peak asymmetry Not satisfactory
3 ACN: buffer (80:20 v/v) Greater peak asymmetry and lower theoretical plates Not satisfactory
4 ACN: water (80:20 v/v) Greater peak asymmetry and lower theoretical plates Not satisfactory
Table 16: Trials performed on C18 column at mobile phase (80:20 v/v) with aqueous phase pH 4 Sr.no. Composition Observation Remarks
1 Methanol: buffer (80:20 v/v) No peak appearance Not satisfactory
2 Methanol: water (80:20 v/v) No peak appearance Not satisfactory
3 ACN: buffer (80:20 v/v) Less retention time Satisfactory
Table 17: Trials performed on C8 column at mobile phase (80:20 v/v) with aqueous phase pH 5
Sr. no. Composition Observation Remarks
1 Methanol: buffer (80:20 v/v) Greater peak asymmetry Not satisfactory
2 Methanol: water (80:20 v/v) less theoretical plates Not satisfactory
3 ACN: buffer (80:20 v/v) Greater peak asymmetry with less theoretical plates Not satisfactory
4 ACN: water (80:20 v/v) Greater peak asymmetry with less theoretical plates Not satisfactory
Table 18: Trials performed on C18 column at mobile phase (80:20 v/v) with aqueous phase pH 5 Sr. no. Composition Observation Remarks
1 Methanol: buffer (80:20 v/v) lower theoretical plates Not satisfactory
2 Methanol: water (80:20 v/v) lower theoretical plates Not satisfactory
3 ACN: buffer (80:20 v/v) Good peak properties satisfactory
4 ACN: water (80:20 v/v) Lower retention time Not satisfactory
3.3 Optimized trials suggested by software based on desirability value
This methodology is initially based on constructing a desirability function for each individual response. The scale
of individual desirability function ranges between i= 0, for completely undesirable response and i =1, for fully desired response. Selection of trial was based on maximum desirability value. Therefore, first trial which was having desirability one (i=1) selected for method optimization.8, 9,10.
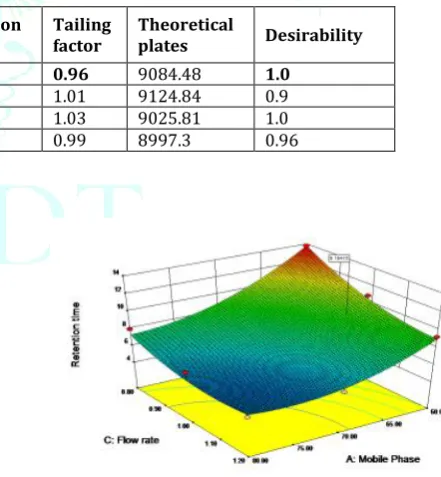
Table 19: Optimized trials suggested by software based on desirability value
Sr. no. Amount of CAN pH of buffer Flow rate Retention time Tailing factor Theoretical plates Desirability
1 72.03 5.0 1.0 5.6 0.96 9084.48 1.0
2 72.00 5.0 1.0 5.9 1.01 9124.84 0.9
3 72.56 5.0 1.1 5.7 1.03 9025.81 1.0
4 70.02 5.0 1.0 5.76 0.99 8997.3 0.96
3.3.1 Optimized chromatographic conditions
Mobile phase: Ammonium format buffer: ACN (28:72 v/v), pH of buffer: 5, Analytical column: C18 column Waters XBridge (4.6× 250mm id. particle size 5µm), UV detection: 247 nm, Injection volume: 20 µL, Flow rate: 1.00 mL min -1, Temperature: Ambient, Run time: 10 min
3.4 Effect of independent variables
3.4.1 Effect of independent variables on retention time (Y1):
The equation for response surface quadratic model is as follows
Y1 = +5.56 -2.58 X1+ 0.50X2 –1.52 X3 + 0.14 X1X2 +0.79X1X3+
-0.099 X2X3 + 1.45X12 + 0.46X22 + 0.96 X32 (1)
Where, X1= A, X2 = B and X3= C
a graphical representation of amount of ACN (A) and flow rate (C), while pH of buffer (B) is maintained constant at its optimum of 5. An increase in flow rate resulted in decrease in retention time (Y1), while increase in % v/v of buffer (or amount of buffer) resulted in increase in retention time (Y1). Combination of amount of buffer and flow rate showed decrease in response.
Figure 2(a): Three-dimensional plot for retention time as a function of flow rate and amount of ACN. Constant
factor (pH of buffer- 5.0)
Figure 3(b): Three-dimensional plot for retention time as a function of pH of buffer and amount of buffer.
Constant factor (flow rate- 1mL min-1)
Fig.4.(c) shows a graphical representation of pH of buffer (B) and flow rate (C), while amount of buffer (A) is maintained constant at its optimum of 40 % v/v. An increase in flow rate showed antagonistic effect on response (Y1), while increase in pH of buffer showed synergistic effect on the response. pH of buffer and flow rate combination found for having synergistic effect on response.
Figure 4(c): Three-dimensional plot for retention time as a function of flow rate and pH of buffer. Constant
factor (% v/v of buffer- 40)
Fit summary: Quadratic model was suggested by the software.
ANOVA: ANOVA of developed Full three level factorial model for retention time (Y1).
Values of "Prob > F" (p- value) less than 0.0500 indicate model terms are significant.
In this case A, B, BC, A2 and C2 are significant model terms.
Table 20: Significance of p value on model terms of retention time Model terms p value Effect of factor Remarks A (X1) 0.0001 -2.58 Significant B (X2) 0.0115 +0.50 Significant C (X3) 0.0001 -1.52 Significant
AB (X1X2) 0.5381 +0.14 Insignificant
AC (X1X3) 0.0021 +0.79 Significant
BC (X2X3) 0.6555 -0.099 Insignificant
A2 (X21) 0.0002 +1.45 Significant
B2 (X22) 0.1565 +0.46 Insignificant
C2 (X23) 0.0061 +0.96 Significant Overall model 0.0029 - Significant
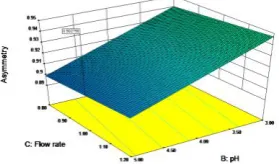
3.4.2 Effect of independent variables on tailing factor (Y2):
After applying experimental design, suggested Response Surface Linear Model was found to be significant with model F value of 23.79, p value less than 0.005 and R2 value of 0.7563. There is only a 0.01% chance that a "Model F-Value" this large could occur due to noise. Values of % C.V. and adjusted R2 were 3.78 and 0.7245 respectively. The model for response Y2 (tailing factor) is as follows:
Y2 = +0.98 +0.071X1-0.021X2+3.333 E-003X3
Figure 5(a): Three-dimentional plot for tailing factor as a function of flow rate and amount of buffer. Constant
factor (pH of buffer- 5)
Fig.6.(b) shows a graphical representation of pH of buffer (B) and amount of buffer (A), while flow rate (C) is maintained constant at its optimum of 1.0 mL min-1. An increase in pH of buffer had antagonistic effect on response (Y2) while increase in amount of ACN showed synergistic effect on it. Amount and pH of buffer combination showed antagonistic effect on response.
Figure 6(b): Three-dimentional plot for tailing factor as a function of pH of buffer and % v/v of buffer. Constant
factor (flow rate- 1mL min-1)
Fig.7.(c) shows a graphical representation of pH of buffer (B) and flow rate (C), while amount of buffer (A) is maintained constant at its optimum 40 % v/v. An increase in pH of buffer and flow rate showed antagonistic effect on response (Y2). Combination of flow rate and pH of buffer showed synergistic effect.
Figure 7(c): Three-dimentional plot for tailing factor as a function of flow rate and pH of buffer. Constant factor
Fit summary: Response Surface Linear Model was suggested by the software.
ANOVA: ANOVA of developed CCD model for tailing factor (Y2).
Values of "Prob > F" (p- value) less than 0.0500 indicate model terms are significant.
In this case A, B are significant model terms.
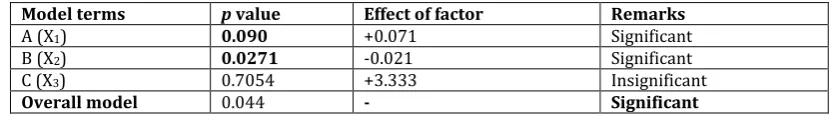
Table 21: Significance of p value on model terms of tailing factor Model terms p value Effect of factor Remarks A (X1) 0.090 +0.071 Significant B (X2) 0.0271 -0.021 Significant
C (X3) 0.7054 +3.333 Insignificant
Overall model 0.044 - Significant
For response Y2, factor X1 and X3 was having synergistic effect with p value 0.090 and 0.7054. Therefore we can conclude that increment in amount of ACN and flow rate was responsible for decrease in tailing factor and thus showed the direct relationship between them. Terms X2 were responsible for significant increase in tailing factor with p values -0.0271. Therefore we can conclude that combination of factors showed inverse relationship with response. Factors amount of ACN and combination of flow rate and amount of buffer differs from zero with a great margin therefore they were having more significant effect than other factors.
3.4.3 Effect of independent variables on theoretical plates (Y3):
After applying experimental design, suggested Response Surface Quadratic Model was found to be significant with model F value of 4.38, p value less than 0.005 and R2 value of 0.6988. There is only a 0.43% chance that a "Model F-Value" this large could occur due to noise. Values of % C.V. and adjusted R2 were 18.43 and 0.5394 respectively. The model for response Y3 (theoretical plates) is as follows: Y3 = +6409.99 -1700.54X1 +283.43X2 -322.85X3 -602.20X1X2 + 445.98X1X3 -323.61X2X3 +243.15 X21 +510.74X22 +2176.65X23 (3)
Fig.8 .(a) shows a graphical representation of amount of ACN (A) and flow rate (C), while pH of buffer (B) is varying from 3-5.
An increase in flow rate and amount of ACN showed antagonistic effect on response (Y3) individually, while their combination showed synergistic effect on response. 1,10.
Figure 8(a): Three-dimensional plot for theoretical plates as a function of flow rate and amount of ACN.
Constant factor pH-5
Fig.9.(b) shows a graphical representation of amount of ACN (A) and pH of buffer (B), while flow rate (C) is
maintained constant at its optimum value 1mL min-1. An increase in pH of buffer showed increase in number of theoretical plates (Y3), while increase in amount of ACN showed antagonistic effect on response. Combination of amount of buffer and pH of buffer showed antagonistic effect on it.
Figure 9(b): Three-dimensional plot for theoretical plates as a function of pH of buffer and % v/v of buffer.
Constant factor (flow rate- 1 mL min-1)
Fig.10.(c) shows a graphical representation of flow rate (C) and pH of buffer (B), while amount of ACN (A) is maintained constant at its optimum value 70 % v/v. An increase in pH of buffer showed increase in number of theoretical plates (Y3), while, increase in flow rate showed antagonistic effect on response. Combination of flow rate and pH of buffer showed antagonistic effect on response.
Figure 10(c): Three-dimensional plot for theoretical plates as a function of pH of buffer and flow rate.
Constant factor (amount of buffer)
Fit summary: Quadratic model was suggested by the software
ANOVA: ANOVA of developed CCD model for theoretical plates (Y3).
Values of "Prob > F" (p- value) less than 0.0500 indicate model terms are significant. In this case B, AC, B2 and C2 are significant model terms.
Table 22: Significance of p value on model terms of theoretical plates Model terms p value Effect of factor Remarks A (X1) 0.0043 -388.5 Significant
B (X2) 0.4460 +240.4 Insignificant
C (X3) 0.3866 -211 Insignificant
AB (X1X2) 0.1936 -419.2 Insignificant
AC (X1X3) 0.3302 +0.50 Insignificant
BC (X2X3) 0.4769 -78.1 Insignificant
A2 (X21) 0.7040 -210.2 Insignificant
B2 (X22) 0.4282 +387.2 Insignificant
C2 (X23) 0.0030 +73.2 Significant
Overall model 0.0134 - Significant
For response Y3, factor pH of buffer was having synergistic effect with p value 0.4460. Therefore we can conclude that increment in pH of buffer was responsible for increment in theoretical plates and thus showed the direct relationship between them.
Combination of amount of ACN and flow rate was responsible for significant increase in theoretical plates with significant p value of 0.0043. Therefore direct relationship between this combination and response is observed. Exponential terms (X22) and (X23) also showed direct relationship with response having significant p values 0.4282 and 0.0030 respectively. Factor pH of buffer and its exponential term differs from zero with a great margin therefore they were having more significant effect than other factors. Therefore it is concluded that pH of buffer and its exponential term was responsible for significant change in response i.e. nos. of theoretical plates. 10, 11,12,13,14.
3.5 Analytical Method Development
Different mobile phases were investigated to develop the suitable HPLC method for the analysis of Efavirenz in formulations. For the selection of media the criteria employed was sensitivity of the method, ease of sample preparation, miscibility of the drug, cost of solvents and applicability of method to various purposes. Retention time and peak area of EFV in the selected medium at respective wavelengths were determined and compared with the reference standards and formulation also.9,10
Chromatogram of Efavirenz
Figure 11: A typical chromatogram of Efavirenz The applied chromatographic conditions permitted a good separation of Efavirenz in a short retention time of 5.642min. (Fig.11), no drug decomposition was observed during the analysis. The LC method was validated for the parameters reported below.
3.6 System suitability study
According to USP, system suitability tests are integral part of liquid chromatographic methods. Retention time, peak area and number of theoretical plates were calculated for
standard solutions. The obtained data was found to be within acceptable limits.
Table 23: System suitability parameters
Sr. No. Parameters Observation 1 Retention time 5.6
2 Peak area 764985.5
3 Theoretical plates 8182.42
3.7 Analytical Validation
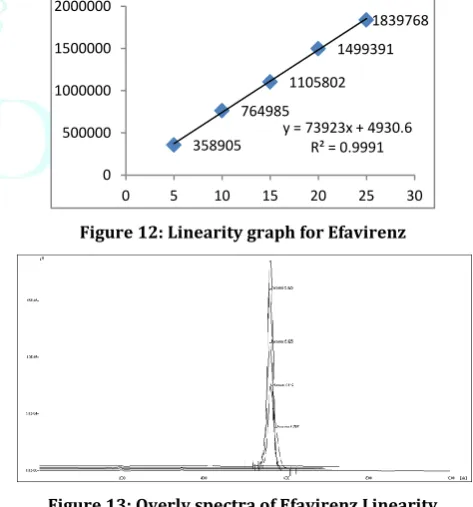
3.7.1 Preparation of Calibration Curve
Stock solution was prepared using 10mg of Efavirenz in 10ml of methanol and further dilutions were done with mobile phase. Solutions were sonicated for 5 min in Ultrasonic clean bath and manually 20µl was injected through the Rheodyne injector. Five concentrations were taken 5-25µg/ml for the calibration curve at 292nm. Linearity graph for Efavirenz is shown in Figure no 12 and Overly spectra of Efavirenz Linearity shown in figure no 13.6
Figure 12: Linearity graph for Efavirenz
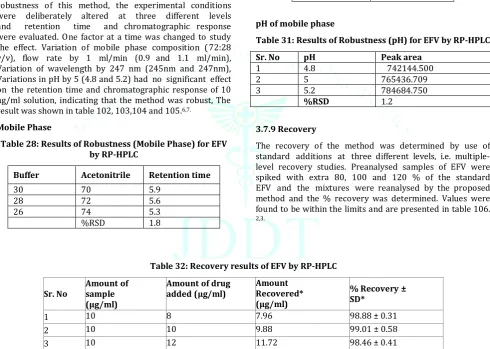
Figure 13: Overly spectra of Efavirenz Linearity 3.7.2 Selectivity
10 tab of EFV formulation were triturated in mortar pestle and 35mg (10 mg of pure drug) of tab including other excipients was transferred in 10 ml volumetric flask and volume was adjusted with methanol. Peak area and retention time of formulation was compared with the API of the drug. Typical peak of Efavirenz is shown in figure no 14.7
358905 764985
1105802 1499391
1839768
y = 73923x + 4930.6 R² = 0.9991
0 500000 1000000 1500000 2000000
.
Figure 14: A typical chromatogram of Efavirenz [Concentration 15ug/ml]
3.7.3 Sensitivity
The sensitivity of measurement of EFV by use of the proposed method was estimated in terms of the limit of detection (LOD) and the limit of quantification (LOQ). The LOD and LOQ were calculated by the use of signal to noise
ratio. In order to estimate the LOD and LOQ values, the blank sample was injected six times and the peak area of this blank was calculated as noise level. The LOD was calculated as three times the noise level, while ten times the noise value gave the LOQ. LOD and LOQ were found to be 0.126 and 0.420.9
3.7.4 Accuracy
Accuracy of analytical procedure expresses the closeness of agreement between the value which is accepted either as a conventional true value or an accepted reference value and the value found. This is sometimes termed trueness. Accuracy should be established across the specified range of 98-102 %.
For accuracy three concentrations of five replicates were prepared and injected to get the peak area. Results obtained are shown in table 101.11
Table 24: Accuracy results of EFV by RP-HPLC Concentration
(ug/ml) Peak area Concentration Found (µg/ml) Accuracy
7 276510 7.034880 100.498296
17 671362.4 17.25204161 101.4825
22 854793 21.99847332 99.9930
3.7.5 Precision
The precision of an analytical procedure expresses the closeness of agreement (degree of scatter) between the series of measurements obtained from multiple sampling of the same homogeneous sample under the prescribed
conditions. Method of precision was accessed on two levels, intra and intermediate precision. Solutions of known concentration were prepared in replicates and were injected to get the peak area. Results obtained are shown in table 99. 12
Table 25: System Precision results for EFV by RP-HPLC
Sr. No. Concentration (µg/ml) Intraday precision (Area) Interday precision (Area)
1 20 1504212 1512836
2 20 1504696 1516408
3 20 1525934 1538275
4 20 1499974 1502956
5 20 1506282 1519144
6 20 1485784 1495784
Mean 1504480.333 1514233.833 Std. Dev. 12911.11344 14672.11126 %RSD 0.858177615 0.968946205
3.7.6 Specificity
Chromatogram of EFV showed peak at a retention time of 5.018 min. The mobile phase designed for the method resolved the drug very efficiently; The Retention time of Efavirenz was 5.020 ± 0.0078min. The wavelength 292
nm was selected for detection because; it resulted in better detection sensitivity for the drug. The peak for Efavirenz from the tablet formulations was identified by comparing its retention time and Area of peak with those of standard Efavirenz. Recovery was found to be 99.28 ± 0.004. The result was shown in table 107.13
Table 26: Recovery results of EFV by RP-HPLC
Sample Label Claim mg Amount found* (mg) Recovery ± SD* (%) Retention time
Tab 600 599.96 99.28 ± 0.004 5.6 ± 0.0078 min
3.7.7 Repeatability
Demonstration of precision was done under two categories. The injection repeatability (System Precision) was assessed by using six injections of the standard solution o f EFV
Table 27: Repeatability results for EFV by RP-HPLC
Sr. no Concentration µg/ml Peak Area
1 20 1490913
2 20 1497975
3 20 1499391
4 20 1516768
5 20 1499974
6 20 1516768
Mean 1503631.5
Std. Dev 10679.4255 % RSD 0.710242204
3.7.8 Robustness
Robustness is a measure of capacity of a method to remain unaffected by small, but deliberate variations in the method conditions, and is indications of the reliability of the method. A method is robust, if it is unaffected by small changes in operating conditions. To determine the robustness of this method, the experimental conditions were deliberately altered at three different levels and retention time and chromatographic response were evaluated. One factor at a time was changed to study the effect. Variation of mobile phase composition (72:28 v/v), flow rate by 1 ml/min (0.9 and 1.1 ml/min), Variation of wavelength by 247 nm (245nm and 247nm), Variations in pH by 5 (4.8 and 5.2) had no significant effect on the retention time and chromatographic response of 10 μg/ml solution, indicating that the method was robust, The result was shown in table 102, 103,104 and 105.6,7.
Mobile Phase
Table 28: Results of Robustness (Mobile Phase) for EFV by RP-HPLC
Buffer Acetonitrile Retention time
30 70 5.9
28 72 5.6
26 74 5.3
%RSD 1.8
Wavelength
Table 29: Results of Robustness (Wavelength) for EFV by RP-HPLC
Wavelength Peak area
245 742144.500
247 735436.709
249 724684.750
%RSD 1.2
Flow rate
Table 30: Results of Robustness (Flow rate) for EFV by RP-HPLC
Flow rate Retention time 0.9 ml/min 6.1
1 ml/min 5.6 1.1 ml/min 5.1
%RSD 1.7
pH of mobile phase
Table 31: Results of Robustness (pH) for EFV by RP-HPLC Sr. No pH Peak area
1 4.8 742144.500
2 5 765436.709
3 5.2 784684.750
%RSD 1.2
3.7.9 Recovery
The recovery of the method was determined by use of standard additions at three different levels, i.e. multiple-level recovery studies. Preanalysed samples of EFV were spiked with extra 80, 100 and 120 % of the standard EFV and the mixtures were reanalysed by the proposed method and the % recovery was determined. Values were found to be within the limits and are presented in table 106. 2,3.
Table 32: Recovery results of EFV by RP-HPLC
Sr. No Amount of sample (µg/ml)
Amount of drug
added (µg/ml) Amount Recovered* (µg/ml)
% Recovery ± SD*
1 10 8 7.96 98.88 ± 0.31
2 10 10 9.88 99.01 ± 0.58
3 10 12 11.72 98.46 ± 0.41
4. SUMMARY AND CONCLUSION 7.1 Determination of Efavirenz by HPLC.
In this project, as per our objective RP-HPLC method was developed by implementing QbD methodology (RSM and 3 level factorial design) on analytical column- reversed phase Waters XBridge C18 (250mm×4.6mm×5μm) with mobile phase Amonium format: Acetonitrile (28:72 v/v). The flow rate used was 1 mL /min and UV detection was carried out at 247 nm. The retention time for Efavirenz was found to be 5.6 min. Before method optimization, screening studies were carried out on different mobile phases, varying composition and pH. Based on the results obtained from these studies, suitable mobile phase with appropriate composition and pH
was selected and utilized for method development using QbD methodology.
The RP-HPLC method developed for estimation of Efavirenz was validated as per ICH guidelines using various parameters.
Linearity for the drug by the proposed method was determined to study its ability to elicit test results which are directly proportional to the concentration of analyte in the sample response and was found to be in concentration range 5 to 25 μg/mL (R2 = 0.998).
guidelines, where δ is the standard deviation of the response (y-intercept) and S is the slope of the calibration plot. LOD was found to be 0.126μg/ mL and LOQ was found to 0.420 μg/ mL
System suitability test ensures that the analytical system is working properly and can give accurate and precise results. System suitability tests includes resolution, tailing factor, number of theoretical plates, capacity factor etc. The results of all system suitability parameters were acceptable in their limits defined by official guidelines.
The proposed high-performance liquid chromatographic method has also been evaluated over the accuracy, precision and robustness and proved to be convenient and effective for the quality control of Efavirenz. Developed method was found simple and cost effective for the quality control of Efavirenz.
Moreover, the lower solvent consumption along with the short analytical run time of 10.0 min leads to a cost effective and environmentally friendly chromatographic procedure. Thus, the proposed methodology is rapid, selective, requires a simple sample preparation procedure, and represents a good procedure for Efavirenz.
Table 33: Results of the quantitative determination of Efavirenz.
Sr.
no Parameters HPLC observations 1 Concentration range (μg mL-1) 5-25
2 Regression equation y = 73923x + 4930.6 3 Correlation coefficient 0.998
4 LOD (μg mL-1) 0.126
5 LOQ (μg mL-1) 0.420
5. FUTURE SCOPE
QbD methodology can be applied for Bioanalytical method development and its validation for estimation of EFV. QbD methodology can be applied for stability indicating studies of EFV.
REFERENCES
1. Udaykumar RB, Stability- indicating HPLC method for the determination of efavirenz in bulk drug and in pharmaceutical dosage form, African Journal of Pharmacy and Pharmacology, 2009; 3(12):643-650.
2. Savie IM, Experimental design to quality by design in pharmaceutical legislation, Accreditation and Quality Assurance, 2012;17:627-633.
3. Rajkotwala AS, Shaikh SS, QbD Approach to Analytical Method Development and Validation of Piracetam By HPLC, World Journal of Pharmacy and Pharmaceutical Sciences, 2016; 5(5):1771-1784
4. Venkata RY, Pal KA, Validated stability indicating analytical method and invitro dissolution studies of efavirenz formulation by RP-HPLC, International Journal of Pharmacy and Pharmaceutical Sciences, 2012; 4(l5):572-576.
5. Appala R, Simultaneous estimation of tenofovir disoproxil, emtricitabine and efavirenz in tablet dosage form by RP-HPLC, Oriental Journal of Chemistry, 2008; 24(2):645-650.
6. Brajendra SR, Method Development and Validation Of RP-HPLC Method In The Detection Of Efavirenz In Bulk Drug And Tablet Formulation, International Research Journal Of Pharmacy, 2012; 3(7):297-300.
7. Behnken DW, Some new three level designs for the study of quantitative variables, Technometrics, 1960; 2:455-475. 8. Bruns RE, Scarminio IS, Neto BB, Statistical design-
Chemometrics, Amsterdam, 2006:338-350.
9. Bhavsar SA, RP-HPLC method for simultaneous estimation of tenofovir disoproxil fumarate, lamivudine, and efavirenz in combined tablet dosage form, Pharmaceutical Methods, 2012; 3(2):73–78.
10. Campana AM, Rodriguez, LC, Gonzalez, AL. Sequential response surface methodology for multioptimization in analytical with three-variable Doehlert designs, Analytical Chemica Acta, 1997; 348:237-246.
11. Doehlert, DH, Uniform shell designs, Journal of the Royal Statistical Society, 1970; 19:231-239.
12. Ermer J, Hans-JP, Validation in pharmaceutical analysis Part II: central importance of precision to establish acceptance criteria and for verifying and improving the quality of analytical data, Journal of Pharmaceutical and Biomedical Analysis, 2005; 37:859-870.
13. Fabre H, Robustness testing in liquid chromatography and capillary electrophoresis, Journal of Pharmaceutical and Biomedical Analysis, 1996; (14):1125-1132.