Page 209 www.ijiras.com | Email: contact@ijiras.com
Growth Of Child Mortality Rate And Its Determinants In
Scheduled Castes & Scheduled Tribes Concentrated States In India
Dr. Uttam Kumar Sikder
Assistant Professor (Stage 3), Department of Economics & Politics, Visva-Bharati University, West Bengal, India
I. INTRODUCTION
In this paper I want to explore the growth rate and major determinants of child mortality rate in the Scheduled Castes and Scheduled tribe concentrated states in India, namely Himachal Pradesh, Punjab, Rajasthan, Madhya Pradesh, Orissa, West Bengal, Arunachal Pradesh, Manipur, Meghalaya, Gujarat, Andhra Pradesh and Karnataka. According to UNICEF India Report (2015) the risk is even higher for children born in Scheduled Tribe (ST) family as compared to Scheduled Cast (SC). Not only that this risk is higher for SC and ST compared to General Caste family. This is the rationale behind the present study.
India has realised impressive gain in child survival over the last two decades. However, the current pace, the country is unlikely to achieve Millennium Development Goa (MDG) 4 which aims to reduce under-five mortality by two thirds between 1990 to 2015- unless the related socio economic, maternal and demographic, and environmental determinants
are urgently addressed. Six states, though, namely Kerala, Tamil Nadu, Maharashtra, Punjab, Himachal Pradesh and West Bengal are likely to achieve the goal.
II. OBJECTIVES OF THE STUDY
In keeping with the above considerations the broad study is to highlight nature and extent of access to health of child. Specially, objective of the study may be stated as below.
To examine interstate Growth performance over time of CMR in SC – ST concentrate states in India.
To examine the factors which are responsible of the variation of CMR in respect to the access to the benefit of health care facilities by infant?
Abstract: In this paper I want to explore the growth rate and major determinants of child mortality rate in the Scheduled Castes and Scheduled tribe concentrated states in India, namely Himachal Pradesh, Punjab, Rajasthan, Madhya Pradesh, Orissa, West Bengal, Arunachal Pradesh, Manipur, Meghalaya, Gujarat, Andhra Pradesh and Karnataka. According to UNICEF India Report (2015) the risk is even higher for children born in Scheduled Tribe (ST) family as compared to Scheduled Cast (SC). Not only that this risk is higher for SC and ST compared to General Caste family. This is the rationale behind the present study.
The results revealed that in case of India the rate of decline of CMR in ST category of households is less compared to that of General category. For the states Rajasthan, Madhya Pradesh and Orissa the rate of decline in CMR of SC – ST household is lower relative to General which is clear sign of the indication of deprivation of oppressed classes. The pooled regression results show that it is the social demographic variables that have a close association with child mortality indicators. Most of our estimates namely, percentage of children age 12-23 who received all vaccination, percentage of delivery assisted by skilled health personnel, Dum1 and constant are found to significant at satisfactory level.
Page 210 www.ijiras.com | Email: contact@ijiras.com
III. DATA, METHODOLOGY AND ECONOMETRICS MODEL
The Descriptive Analysis of the Percentage Change in Child Mortality Rate
The data set used in my study is entirely based on secondary sources of data collected through three different rounds of National Family health survey (NFHS) data.
The percentage change or growth rate over two different periods is defined by the following formula.
gt= {(Yt--Yt-1)/Yt-1} ×100 …………..………....1 Where, gt = % change in mortality indicator
t, t-1= current and base period respectively.
Taking child mortality as a dependent variable, pooled regression models have been attempted by utilizing data available through three rounds of National Family Health Survey (VIZ, MFHS-I, NFHS-II and NFHS-III).Since these three rounds refer to three different time points we have a time series at our disposal being whatever small. Further we have considered the first fifteen SCs/STs concentrated states in India out of twenty nine states according to ascending order of magnitudes of such concentration out of which three viz., Tripura, Sikkim and Mizoram have to be dropped from our regression framework due to untenable data gaps and in consistency of information. Thus treating the remaining twelve states as cross sectional units of observation we have done the pooling of time series and cross sectional data to carry on the proposed pooled regression exercise.
The advantage of using pooled data is to have grater information less collinearity, more degrees of freedom and more efficiency. In particular through the repealed cross section of observations pooled data give a frame work to study a dynamic process of change.
Econometric Frame work of Child Mortality Rate
The child mortality rate is defined as the probability of dying of a child between the fourth birth day of his/her life and fifth birthday of his/her life.
It depends on various socio-economic and demographic indicators which can reduce the child mortality rate. The increase in access to health facilities leads to decrease in child mortality. This rate is high for the socio-economically oppressed classes. In our present study we shall develop an analytical / econometric framework of child mortality rate by using pooled regression model.
If we consider a general linear pooled multiple regression models, where child mortality rate (CMR) is determined by a set of quantitative and qualitative variables and disturbance term, we can write it as follows. The Pooled Regression model including only explanatory variables discussed above is known as fixed effects (regression) model (FEM) in econometric literature. The term “fixed effect” is due to the fact that although the intercept may differ across states (here the twelve states), each entry’s intercept does not over time, that is, it is time invariant. Note that if we write the intercept as α1it, it would suggest that intercept of each entry of each state is time variant. It may be noted that the FEM assumes that the slope coefficients of the repressor’s do not vary across individuals or time.
CMRit= γ27+ γ28PCAVit+ γ29PIMHit+ γ30PMCHEit+ γ31PIFHit+ γ32PFCHEit+ γ33PDAHPit+ γ33PHISDWit+ γ35PNSDPit+ γ36Dam1t+ γ37Dum2t+ VIT...(3.6.39) Where, PCAV: Percentage of children age 12-23 months who received all vaccination at any time before the survey
PIMH: Percentage of Illiterate Male in Household PMCHE: Percentage of Males ages six and above who completed high school education and /or above.
PIFH: Percentage of Illiterate Females of age six years and above in Households
PFCHE: Percentage of Females of ages six years and above who completed High School and above Education.
PDAHP: Percentage of Deliveries Assisted by Health Personnel
PHISDW: Percentage of Households with Improved Sources of Drinking Water
PNSDP: Per Capita Net State Domestic Product at factor cost at constant Prices (1999-2000)
Dam 1 = {1, if effect of 1992-93 is considered 0, otherwise}
Dum 2 = {1, if effect of 1998-99 is considered 0, otherwise}
Dum 3 = {1, if effect of 2005-06 is considered 0, otherwise}
IV. DISTURBANCE TERM
It is important to note that since we have three time points, we have introduced only twoDummy Variables to avoid falling into dummy variable trap i.e. a situation of perfect collinearity. Here we are treating time point 2005-06 as the basic or reference category.
Before proceeding further, it may be useful to visualize the difference between pooled regressions model and LSDV model. If we run a regression of CMR of chosen explanatory variables we can get a biased slope estimate. How do we actually allow for the (fixed effect) intercept to vary among the states? We can easily do that by using dummy variable technique, particularly differential intercept dummy technique.
V. SPECIFICATION OF THE HYPOTHESIS HYPOTHESIS 1
The percentage of children aged 12-23 months who received all vaccination (PCAV) will have a positive effect on IMR, since it reduces infant mortality rate. We want to test the null hypothesis H0 : γ28 = 0 against alternative hypothesis H1 : γ28< 0.
HYPOTHESIS 2
Page 211 www.ijiras.com | Email: contact@ijiras.com
HYPOTHESIS 3
The increase in the percentage of males aged six and above who completed high school and above education is expected to reduce infant mortality rate. We want to test the null hypothesis H0 : γ30 = 0 against alternative hypothesis H1 : γ30< 0.
HYPOTHESIS 4
The female literacy is expected to reduce infant mortality rate. So, increase in percentage of illiterate female in households (PIFH) tends to decreases in infant mortality rate and vice-versa. We want to test the null hypothesis H0 : γ31 = 0 against alternative hypothesis H1 : γ31< 0.
HYPOTHESIS 5
The female education is expected to reduce infant mortality rate. We may think that the educated women in society shall be empowered in the decision making of the family. This will definitely enable the women to exert thing power and opinion that would affect the child healthcare. Therefore, the percentage of female of age six and above who completed high school and above (PFCHE) is inversely related to infant mortality rate. We want to test the null hypothesis H0 : γ32 = 0 against alternative hypothesis H1 : γ32< 0.
HYPOTHESIS 6
The institutional pregnancy delivery by skilled health personnel may be reducing infant mortality rate. So, percentage of deliveries assisted by health personnel (PDAHP) is inversely related to IMR. We want to test the null hypothesis H0 : γ33 = 0 against alternative hypothesis H1 : γ33< 0.
HYPOTHESIS 7
If we increase the coverage of percentage of households with improved sources of drinking water (PHISDW), infant mortality rate should reduce. We want to test the null hypothesis H0 : γ34 = 0 against alternative hypothesis H1 : γ34< 0.
HYPOTHESIS 8
It is natural to expect that the increase in PNSDP of a state shall reduce the infant mortality rate. We want to test the null hypothesis H0 : γ35 = 0 against alternative hypothesis H1 : γ35< 0.
HYPOTHESIS 9
We cannot predict a priori of the impact of any particular year (1992-93 / 1998-99 / 2005-06) on the infant mortality rate unless the model is completely estimated. We want to test the null hypothesis H0 : γ36 = 0 against alternative hypothesis H1 : γ36 ≠ 0.
VI. RESULTS AND DISCUSSIONS
States/India
CMR
SC ST GEN
India -70.25 -32.44 -105.55 Himachal Pradesh -114.29 - -36.00
Punjab 43.75 - -8.82
Rajasthan -52.97 -52.97 -140.8 Madhya Pradesh -74.0 -74.0 -72.14 Orissa 30.16 30.16 -25.00
West Bengal - - -6.67
Arunachal Pradesh - - -
Manipur - - -
Meghalaya - - -
Gujarat -104.35 -0.12 -50.29 Andhra Pradesh -245.9 30.00 -131.25
Karnataka -311.1 -14.71 21.11
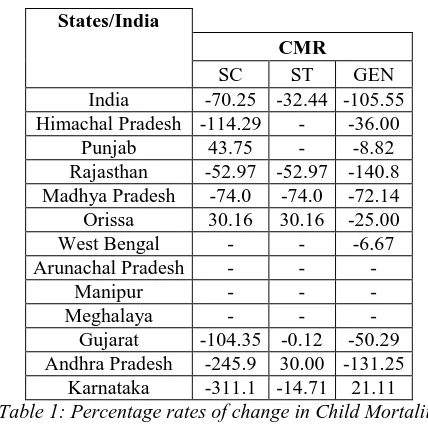
Table 1: Percentage rates of change in Child Mortality between 1998-99 and 2005-06 by SC-ST, India and Its
Selected Twelve SC-ST Concentrated States
PERCENTAGE RATES OF CHANGE IN CHILD MORTALITY BETWEEN 1998-99 AND 2005-06 BY SC-ST, INDIA AND ITS SELECTED TWELVE SC-ST CONCENTRATED STATES
It is seen that in three states, namely Arunachal Pradesh, Manipur and Meghalaya the data are not available according to social group wise. Whereas for the state West Bengal, Himachal Pradesh, and Punjab the data is not available according to all social group. The Table – 1 at once revealed that in case of India the rate of decline of CMR in ST category of households is less compared to that of General category. For the states Rajasthan, Madhya Pradesh and Orissa the rate of decline in CMR of SC – ST household is lower relative to General which is clear sign of the indication of deprivation of oppressed classes.
PAIR WISE CORRELATION COEFFICIENT BETWEEN CMR AND ALL EXPLANATORY VARIABLES
Page 212 www.ijiras.com | Email: contact@ijiras.com
matrices which represents the pair wise correlation coefficients between dependent variables CMR and explanatory variables.
pnsdp 0.7279* 1.0000 phisdw 1.0000 phisdw pnsdp
pnsdp -0.5746* -0.4672* 0.5192* -0.5940* 0.6744* 0.6078* 0.6328* phisdw -0.4192* -0.1696 0.2706 -0.2077 0.2643 0.4840* 0.5504* pdahp -0.6221* -0.3753* 0.6067* -0.3787* 0.6007* 0.4911* 1.0000 pcav -0.6597* -0.4291* 0.2932 -0.5129* 0.3645* 1.0000 pfche -0.5000* -0.7312* 0.9079* -0.7220* 1.0000 pifh 0.5373* 0.7670* -0.5881* 1.0000 pmche -0.4523* -0.7449* 1.0000 pimh 0.5009* 1.0000 cmr 1.0000
cmr pimh pmche pifh pfche pcav pdahp . pwcorr cmr pimh pmche pifh pfche pcav pdahp phisdw pnsdp,star(5)
Now we turn to our analyse about the nature of degree of association between CMR and all other explanatory variables which we considered in model. The results show that all explanatory variables are correlated with CMR separately all though their magnitudes differ with each other. The correlation between CMR and Dummy 1 and Dummy 2 are positive and found to be very low in terms of their absolute value. Both PIMH and PIFH are found to be negative and their values are respectively 0.5009 and 0.5373 in absolute terms. These two values are statistically significant at 5 % level. We also found that the CMR and remaining explanatory variables namely, PCAV, PMCHE, PFCHE, PDAHP, PHISWD and PNSDP inversely related and they all are statistically significant at 5% level. The correlation matrix between CMR and all other explanatory variables is depicted below.
ROBUST MULTIPLE CORRELATION RESULT OF CHILD MORTALITY RATE
I have run stepwise all possible robust regressions of CMR on different explanatory variables in the model. Among these all possible regressions we have chosen the best performing LSDV on the basis of the value of coefficient of determination (R-Squared). The results of this regression are reported below with the help of the following table.
Table-4.5.2: Model 2 (Pooled Regression Model): Determinants of Child Mortality Rate
In terms of coefficient of determination (R-Squared), the overall goodness-of –fit of the chosen model is quite satisfactory as it is observed to be 0.6844.Hence about 68% variation of CMR can be explained in terms of explanatory variables included in our model. The observed F value points to an overall satisfactory performance of our multiple regression models. Further as mean VIF value is 7.26 which
falls below 10, the model suffers from less multicolliniarity effect. On the basis of the value of VIF of each explanatory variable it is found that Dam 1, PIMF, PIFH, PHISWD, PDAHE, PCAV, Dum 2 has significantly low multicollinearity effect. On the other hand the value of VIF of the explanatory variables PMCHE and PFCHE exceeds 10 which imply the multicoliniarity effects of these variables are severe.
On the basis of t statistic and p value the percentage of children aged 12-23 months who received all vaccination at any time before the interview (PVAC), PDAHP, Dam 1 and constant are statistically significant at 5%, 5%, 10% and 1% level of respectively. Among all statistically significant explanatory variables PCAV and PDAHP have shown negative signs according to our general assumptions. The coefficient of Dam 1 has negative sign where as it is positive for Dam 2. The inverse relationship between Dam 1 and CMR can be explained by the fact that there are unavoidable factors in 1991-92 which may affect the CMR. The political crisis of introducing new economic policy may affect the CMR.
The significant positive association between CMR and PCAV is explained by the fact that public health intervention through universal immunization programme regarded as a major cause to reducing the child mortality in our country.
The significant inverse relationship between CMR and PDAHP is the result of available pregnancy delivery infrastructure as well as the availability of the skilled health personnel. The estimated coefficient of PFCHE is positive which violates our general assumption whereas we found that the estimated coefficients of PIMH and PIFH are positive which is consistent with our general assumption even if they are insignificant. The estimated coefficients of PMFC, PHISDW and PNSDP are negative according to our general assumption but they are statistically insignificance. Positive relationship between CMR and Dam implies the year 1998-99 has a significant effect on CMR.
VII. CONCLUSIONS
The pooled regression results show that it is the social demographic variables that have a close association with child mortality indicators. Most of our estimates namely, percentage of children age 12-23 who received all vaccination, percentage of delivery assisted by skilled health personnel, Dum1 and constant are found to significant at satisfactory level.
However both positive and negative dummy variable impact is observed for respective time reference points. We may infer that while public health of effort has made some positive impact on child health between different rounds of NFHS, its sustainability depends on complementing such measures with increased income entitlements of households.
VIII. RECOMMENDATIONS
Page 213 www.ijiras.com | Email: contact@ijiras.com
existing health care system but is some short of requirement. Hence government sector should increase their role to promote health care system for SC –ST concentrated states in India.
ACKNOWLEDGEMENTS
I am indebted to my friend-philosopher and guide Professor Manik Lal Adhikary to prepare this research paper. I also indebted to my father Bodhisattva Makhan Lal Sikder and my mother Srimati Labanya prova Sikder who continuously taught me about courage in my life in each and every dimension.
REFERENCES
[1] NFHS (1992-93), “National Family Health Survey II”, International Institute of Population Science, Mumbai, India
[2] NFHS (1998-99), “National Family Health Survey II”, International Institute of Population Science, Mumbai, India.
[3] NFHS (2005-06), “National Family Health Survey II”, International Institute of Population Science, Mumbai, India
[4] National Commission Report for SCs/STs (2000).
[5] National Commission for Scheduled Tribe (2012), “Ministry of Society Justice and Empowerment”, GOI. [6] National Commission for Scheduled Tribe (2012),
“Ministry of Society Justice and Empowerment”, GOI. Goon, A.M.; Gupta, M.K. and Dasgupta, B., “Fundamentals of Statistics” Vol. 2, pp. 434-435 and 438-440
[7] Government of India (1983), “National Health Policy”, Government of India, New Delhi.
[8] Human Development Report (1996), “Published for the United National Development Programme (UNDP)”, New York, OUP.
[9] Ahjuja, R. (2004), “Health Insurance for the poor in India”, working paper No. 2, Indian Council for Research on International Economics Relation.
[10] Ahjunja, R. and Jutting, J. (2003), “Design of incentives in community based health insurance” ZEF – Discussion paper on development policy, No. 63, Bonn, Center for development research.
[11] Akhtar, R. (2000), “Urban Health in the Third World.” Delhi: APH Publishing Cooperation.