Commodity Derivatives Exchanges in India: A Study of Select
Exchanges
- Dr. (Mrs.) Prashanta Athma* - Ms. M. Sagarika **
Abstract
The financial markets, instruments and participants provide the investment environment to the investor. Return on investment is always subject to the risk attached. Investors do require a hedging mechanism to offset the risk of investing in shares and debentures. Derivatives provide an effective solution to the problem of risk caused by uncertainty and volatility in the underlying asset. In India, the emergence and growth of the Derivatives Market is relatively a recent phenomenon. Since its inception in June 2000, Derivatives Exchanges has exhibited exponential growth both in terms of volume and number of traded contracts. Hence, the study is undertaken to analyze the trends and progress of Commodity Derivative Trading in National Commodity & Derivatives Exchange Limited (NCDEX) and Multi Commodity Exchange of India Ltd (MCX) and evaluate the performance of these two Commodity Exchanges.
The parameters chosen for analyzing the trends in the performance of commodity exchanges are number of commodities traded, volume of commodities traded, and the value of these traded commodities over a period of time and the awareness programs conducted.
MCX out beats NCDEX in terms of value of contracts traded whereas it is vice-versa in the number of contracts traded. One interesting point to observe is that the CAGR in traded value in case of both commodity exchanges is higher than that of the CAGR in the number of contracts traded.
Awareness programs conducted to farmers is more than the number of programs to the non farmers and MCX conducted more number of awareness programs compared to the NCDEX. The performance of MCX is best compared to NCDEX.
Keywords: Investment, Derivatives: Financial Derivative: Commodity Derivative, MCX: NCDEX
* Professor and Head, Dept. of Commerce, University College for Women, Osmania University, Koti, Hyderabad.
1. Introduction
Investment refers to the commitment of funds that is expected to generate additional money. Individuals as well as Institutions do make investments. Individuals have savings which are to be invested. Institutions have occasions when they have to invest the idle funds. Investment process encompasses as to how an investor makes decision about securities to invest in and when they should be made. Investment decisions are to be implemented in the financial markets which are a part of financial system. All activities of sale and purchase of investments take place in the financial markets. The financial markets, instruments and participants provide the investment environment to the investor.
Financial market facilitates business firms as well as Government to raise needed funds by issuing and selling different instruments. Capital market is a market for long term financial assets and money market is a market for short term financial assets. Investor always makes investment in expectation of return. However, return is always subject to the risk attached. Investors do require a hedging mechanism to offset the risk of investing in shares and debentures. There has been a quest for finding out suitable hedging mechanism. Some of these are forward contracts, futures and options. These are collectively called as Derivatives because these contracts derive their value from some underlying asset which, if, it is a financial asset, the derivative is called a Financial Derivative and if the underlying asset is a Commodity then it is called as Commodity Derivative. The underlying asset may be financial or non-financial.
Variations in the prices of agricultural and non-agricultural commodities are induced, over time, by demand-supply dynamics. The last two decades have witnessed manifold increase in the volume of international trade and business due to the wave of globalization and liberalization sweeping across the world. This has led to rapid and unpredictable variations in the financial assets prices, commodities, interest rates and exchange rates, and subsequently, to exposing the corporate world to an unwieldy financial risk. Increased financial risk causes losses to an otherwise profitable organization. This underlines the importance of risk management to hedge against uncertainty.
Derivatives provide an effective solution to the problem of risk caused by uncertainty and volatility in the underlying asset. Derivatives are risk management tools that help an organization to effectively transfer risk. In the present highly uncertain business scenario, the importance of risk management is much greater than ever before.
2. Need for the Study
Due to borderless economy, the removal of stringent regulations and the relaxation of rules, Indian economy is fast developing to compete with the world over. Also to comply by the WTO regulations and to avoid hegemony from outsiders, India has taken a strong stand to develop its commodity markets. The present study is undertaken to analyze the trends and progress of commodity derivative trading in India and compare the trading in National Commodity & Derivatives Exchange Limited (NCDEX) and Multi Commodity Exchange of India Ltd (MCX).
3. Review of Literature
Andy Waldock in his paper “The New Normal Commodity Volatility” (2011) explains the effect of Commodity Index Traders (CIT’s) and Exchange Traded Funds (ETF’s) on the commodity markets wherein the Commodity Index Traders have the same goal as mutual fund managers. They attempt to mirror the index their fund is matched to. A mutual fund manager of large cap stocks may try to match the S&P 500’s performance as their benchmark. A Commodity Index Trader may try to mirror the Goldman Sachs Commodity Index (GSCI) or, as it was known on the trading floor the, “Girl Scout Cookie Index.”
Sandy fe in her article “Commodity Trading” (2011) mentioned the evolution of technology in trading commodities and explained how a trader should start dealing in commodity derivatives and also mentioned the pros and cons of technology in commodity trading.
Lan Turner in his article “The Influences of Cycles on Commodity Trading” (2011) stated that commodity trading market cycles greatly influence while a person can identify the best opportunity in order to purchase specific investments. One have to recognize the best time to purchase specific commodities, where the cycle has the reverse effect of possibility where an individual could identify the best time to sell their investments made .When you could recognize companies which depend on specific commodities to generate a profit, they will also be exposed to the effects of seasonality and even cycling.
Sahoo and Kumar in their article titled “Efficiency and Futures Trading- Price Nexus in Indian Commodity Futures Markets” (2009) examined the efficiency and future trading price nexus for five top selected commodities namely gold, copper, petroleum crude, Soya oil and chana (chickpea) in commodity futures markets in India. Trading in commodity derivatives on exchange platforms is an instrument to achieve price discovery, better price risk management, besides helping macro economy with better resource allocation. The author suggests that the commodity futures market is efficient for all five commodities, though could not support that futures market leads to higher inflation.
amount of risk, whereas a large number of speculators also find a level playing filed. He has notices that the commodity markets in India are progressing at a slower pace.
Neil Schofield in his book “Commodity Derivatives: Markets and Applications” (2007) provides a complete and accessible reference for anyone working in, or studying commodity markets and their associated derivatives. Each chapter focuses on how the products could be used along the physical supply chain and seeks to identify the main market risks and how they can be hedged. The book then brings into perspective how the structuring banks hedge their own resultant exposure and examines the attraction of OTC investment structures for the wholesale market.
Narendra.L.Ahuja in his paper “Commodity Derivative Market in India: Development , Regulation and Future Prospects” (2006) tried to explore the progress that India has achieved in a short period of time from the year 2002 in the derivatives markets and also put forth several issues that have to be answered to further the growth of derivative markets in India. Organized commodity derivatives in India started as early as 1875, barely about a decade after they started in Chicago. However, many feared that derivatives fuelled unnecessary speculation and were detrimental to the healthy functioning of the markets for the underlying commodities. As a result, after independence, commodity options trading and cash settlement of commodity futures were banned in 1952. The commodities remained dormant for about four decades until 2002, When the commodities futures market in India were reintroduced thereafter has experienced an unprecedented boom in terms of the number of modern exchanges, number of commodities allowed for derivatives trading as well as the value of futures trading in commodities.
D. S. Kolamkar in his article “Regulation and Policy issues for Commodity Derivatives in India” (2004) tried to give evolution and history about the commodity markets in India. The emergence of forward market commission and the developments that took place in commodity markets and the policy liberalization in the physical and derivative commodity sector. Suggested for the use of modern systems and practices for enhancing the commodity derivatives.
Research Gap
The above studies shows that the work is done on Commodity Volatility, evolution of technology in trading commodities, commodity trading market cycles, efficiency and future trading price nexus, efficacy and performance of commodity derivatives in steering the price risk management and the progress India has achieved in the derivatives markets. There is a research gap relating to the analysis of the trends and progress; performance of the major Commodity Exchanges and the awareness programs. Hence the study is undertaken to fill the research gap.
4. Objectives of the Study
The objectives of the study are to
2. To compare the performance of National Commodity & Derivatives Exchange Limited (NCDEX) and Multi Commodity Exchange of India Ltd (MCX).
5. Scope of the Study
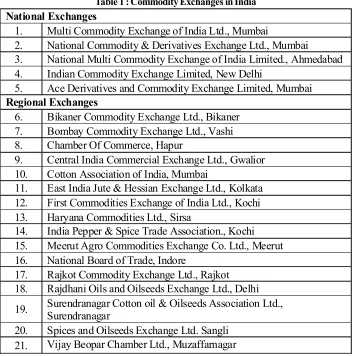
There are 21 Commodity Exchanges in India, of which, 16 are Regional Exchanges and 5 are National Exchanges. As regional exchanges are either not online or having limited membership or trade only in few commodities, not much trading is done; therefore the study excludes trading in regional exchanges. Out of the five national exchanges, the major trading is done in MCX and NCDEX; therefore, the study confines only to commodity trading in MCX and NCDEX.
6. Period of the Study
The study covers a period of eight years from 2004 to 2011. The starting period is 2004 as NCDEX started its operations from December 2003 and MCX from November 2003.
7. Research Methodology
Data Source
The study is based on the secondary data .The sources of data includes the annual reports, brochures of the two exchanges and their websites.
Sample Design: There are five national commodity exchanges
• Multi Commodity Exchange of India Ltd., Mumbai
• National Commodity & Derivatives Exchange Ltd., Mumbai
• National Multi Commodity Exchange of India Limited., Ahmedabad
• Indian Commodity Exchange Limited, New Delhi
• Ace Derivatives and Commodity Exchange Limited, Mumbai
Out of these five exchanges, major trading is done in MCX and NCDEX. Therefore the study is limited to these two exchanges.
Tools for Analysis
To analyze the data, simple statistical tools like averages and percentages are employed. Apart from this, compound annual rate of growth is used for analyzing the data.
Parameters for Evaluation
8.
Commodity Exchanges in India
Presently, there are 21 Commodity Exchanges in India which are regulated by Forward Market Commission under the administrative control of Ministry of Consumer Affairs and Public Distribution. Out of 21 commodity exchanges, five are National Commodity Exchanges and 16 are Regional Commodity Exchanges in India which are given in Table 1.
Table 1 : Commodity Exchanges in India
National Exchanges
1. Multi Commodity Exchange of India Ltd., Mumbai
2. National Commodity & Derivatives Exchange Ltd., Mumbai
3. National Multi Commodity Exchange of India Limited., Ahmedabad 4. Indian Commodity Exchange Limited, New Delhi
5. Ace Derivatives and Commodity Exchange Limited, Mumbai Regional Exchanges
6. Bikaner Commodity Exchange Ltd., Bikaner 7. Bombay Commodity Exchange Ltd., Vashi 8. Chamber Of Commerce, Hapur
9. Central India Commercial Exchange Ltd., Gwalior 10. Cotton Association of India, Mumbai
11. East India Jute & Hessian Exchange Ltd., Kolkata 12. First Commodities Exchange of India Ltd., Kochi 13. Haryana Commodities Ltd., Sirsa
14. India Pepper & Spice Trade Association., Kochi 15. Meerut Agro Commodities Exchange Co. Ltd., Meerut 16. National Board of Trade, Indore
17. Rajkot Commodity Exchange Ltd., Rajkot 18. Rajdhani Oils and Oilseeds Exchange Ltd., Delhi
19. Surendranagar Cotton oil & Oilseeds Association Ltd., Surendranagar
20. Spices and Oilseeds Exchange Ltd. Sangli 21. Vijay Beopar Chamber Ltd., Muzaffarnagar
Source: Compiled from www.fmc.gov.in.
Forward Markets Commission (FMC) regulates future trading in India. It is a statutory body set up by the Ministry of Consumer Affairs, Food and Public Distribution, Govt. of India in 1953 under the Forward Contracts (Regulation) Act, 1952.
All Forward Contracts except those entered into between members of a
recognised association or through or with such a member are rendered illegal in case
of those Commodities to which Sec. 15 have been applied.
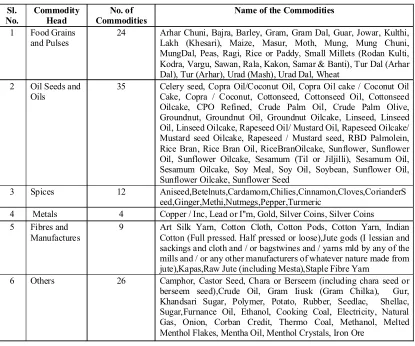
Commodities Recognised by FMC
The Commodities recognised by FMC over a period of time are given in the Table 2.
Table 2 : Commodities Recognised by FMC
Sl. No.
Commodity Head
No. of Commodities
Name of the Commodities
1 Food Grains and Pulses
24 Arhar Chuni, Bajra, Barley, Gram, Gram Dal, Guar, Jowar, Kulthi, Lakh (Khesari), Maize, Masur, Moth, Mung, Mung Chuni, MungDal, Peas, Ragi, Rice or Paddy, Small Millets (Rodan Kulti, Kodra, Vargu, Sawan, Rala, Kakon, Samar & Banti), Tur Dal (Arhar Dal), Tur (Arhar), Urad (Mash), Urad Dal, Wheat
2 Oil Seeds and Oils
35 Celery seed, Copra Oil/Coconut Oil, Copra Oil cake / Coconut Oil Cake, Copra / Coconut, Cottonseed, Cottonseed Oil, Cottonseed Oilcake, CPO Refined, Crude Palm Oil, Crude Palm Olive, Groundnut, Groundnut Oil, Groundnut Oilcake, Linseed, Linseed Oil, Linseed Oilcake, Rapeseed Oil/ Mustard Oil, Rapeseed Oilcake/ Mustard seed Oilcake, Rapeseed / Mustard seed, RBD Palmolein, Rice Bran, Rice Bran Oil, RiceBranOilcake, Sunflower, Sunflower Oil, Sunflower Oilcake, Sesamum (Til or Jiljilli), Sesamum Oil, Sesamum Oilcake, Soy Meal, Soy Oil, Soybean, Sunflower Oil, Sunflower Oilcake, Sunflower Seed
3 Spices 12 Aniseed,Betelnuts,Cardamom,Chilies,Cinnamon,Cloves,CorianderS eed,Ginger,Methi,Nutmegs,Pepper,Turmeric
4 Metals 4 Copper / Inc, Lead or I''m, Gold, Silver Coins, Silver Coins 5 Fibres and
Manufactures
9 Art Silk Yarn, Cotton Cloth, Cotton Pods, Cotton Yarn, Indian Cotton (Full pressed. Half pressed or loose),Jute gods (I lessian and sackings and cloth and / or bagstwines and / yarns mld by any of the mills and / or any other manufacturers of whatever nature made from jute),Kapas,Raw Jute (including Mesta),Staple Fibre Yarn
6 Others 26 Camphor, Castor Seed, Chara or Berseem (including chara seed or berseem seed),Crude Oil, Gram Iiusk (Gram Chilka), Gur, Khandsari Sugar, Polymer, Potato, Rubber, Seedlac, Shellac, Sugar,Furnance Oil, Ethanol, Cooking Coal, Electricity, Natural Gas, Onion, Corban Credit, Thermo Coal, Methanol, Melted Menthol Flakes, Mentha Oil, Menthol Crystals, Iron Ore
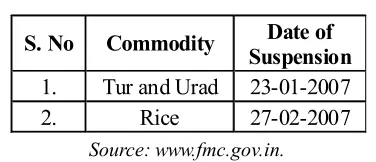
Commodities Suspended
FMC not only recognizes the commodities to be traded in the various Commodity Exchanges but also suspends their trading due to various reasons like the volatility in prices of the commodities, low quality or quantity of the commodities or non fulfillment of the stipulations if any. Table 3
Table 3 : Commodities Suspended in Future Trading
S. No Commodity Date of Suspension 1. Tur and Urad 23-01-2007
2. Rice 27-02-2007
Source: www.fmc.gov.in.
During the year 2007, three commodities viz., Tur and Urad and Rice were suspended in Future Trading because of the wide volatility in the price and these commodities being staple food.
Performance Evaluation of MCX and NCDEX
The performance of the major Commodity Exchanges viz., MCX and NCDEX is evaluated on the basis of number of commodities, value of the commodities traded and quantity of commodities traded.
Multi Commodity Exchange (MCX)
Multi Commodity Exchange (MCX) is an independent commodity exchange based in India. It was established in 2003 and is based in Mumbai. Multi Commodity Exchange of India Ltd (MCX) is a state-of-the-art electronic commodity futures exchange. The demutualised Exchange set up by Financial Technologies (India) Ltd (FTIL) has permanent recognition from the Government of India to facilitate online trading, and clearing and settlement operations for commodity futures across the country.
Having started operations in November 2003, today, MCX holds a market share of over 80% of the Indian commodity futures market, and has more than 2,100 registered members operating through over 1, 80,000 trading terminals, across India. The Exchange was the sixth largest commodity futures exchange in the world, in terms of the number of contracts traded in the year 2010.
National Commodity & Derivatives Exchange Limited (NCDEX)
National Commodity & Derivatives Exchange Limited (NCDEX) is a professionally managed on-line multi commodity exchange. The shareholders of NCDEX comprises of large national level institutions, large public sector bank and companies.
NCDEX is the only commodity exchange in the country promoted by national level institutions. This unique parentage enables it to offer a bouquet of benefits, which are currently in short supply in the commodity markets. The institutional promoters and shareholders of NCDEX are prominent players in their respective fields and bring with them institutional building experience, trust, nationwide reach, technology and risk management skills.
NCDEX is a public limited company incorporated on April 23, 2003 under the Companies Act, 1956. It obtained its Certificate for Commencement of Business on May 9, 2003. It commenced its operations on December 15, 2003.
The Number of Contracts Traded (in Lots) in MCX and NCDEX form 2004 to 2011 and the Compound Annual Growth Rate (CAGR) are presented in the Table 4.
Table4 : Contracts Traded in MCX and NCDEX
Year Traded Contracts (in Lots)
MCX NCDEX
2004 2621019 168152293 2005 20349975 583887294
2006 45635534 675743832
2007 68945925 487244381
2008 94310537 336883509 2009 161173737 442849319
2010 197206801 564790949
2011 346192367 805536682
Total 936435895 4065088259
CAGR 84.12% 21.63%
Source: www.mcxindia.com/ and www.ncdex.com/
NCDEX, the trading in agricultural commodities is more. The measurement of units is different in case of agricultural commodities and metals and bullions. The quantity traded is less in case of metals and bullions whereas the value traded would be high and it is vice-versa in case of agricultural commodities.
From the Table, it can be observed that there is a continuous increasing trend in the contracts traded in case of MCX whereas in case of NCDEX there are fluctuations in contracts traded during the study period. The CAGR during the study period 2004-2011 is 84.12% in case of MCX which is in no comparison with NCDEX i.e., 21.63%. This reflects that the performance of MCX is best.
The reasons for better performance could be due to certification (ISO standards including ISO 9001:2008, ISO 14001:2004 and ISO/IEC 27001:2005) by various organizations for a majority of commodities traded in MCX and the existence of commodity subgroups of metals and bullions traded in MCX. In case of NCDEX, certification is only for agricultural commodities.
MCX is ranked as No.1 in silver trading, No.2 in Gold, Copper & Natural Gas trading and No.3 in Crude Oil trading over the world.
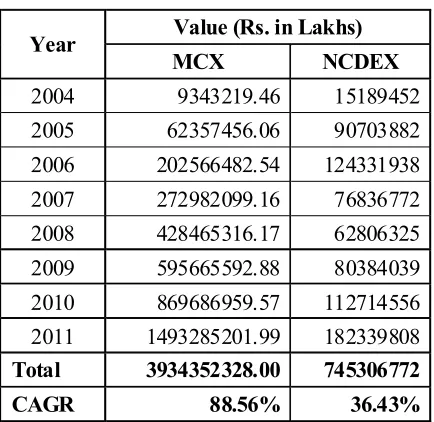
The Value of Contracts Traded (in Lakhs) in MCX and NCDEX form 2004 to 2011 and the Compound Annual Growth Rate are presented in Table 5.
Table 5 : Traded Value in MCX and NCDEX
Year Value (Rs. in Lakhs)
MCX NCDEX
2004 9343219.46 15189452
2005 62357456.06 90703882 2006 202566482.54 124331938 2007 272982099.16 76836772 2008 428465316.17 62806325 2009 595665592.88 80384039 2010 869686959.57 112714556 2011 1493285201.99 182339808 Total 3934352328.00 745306772
CAGR 88.56% 36.43%
The Value of Contracts Traded in MCX and NCDEX presented in Table 5 reflects that the Value Traded is very high in case of MCX compared to NCDEX due to the fact that metals and bullions traded in MCX is higher than that of NCDEX. The value of metals and bullions (MCX) far exceeds the value of agricultural commodities (NCDEX). It can also be observed that there is a continuous growth in case of MCX whereas there are fluctuations in case of NCDEX. The CAGR is 88.56% in MCX which far exceeds the growth rate of 36.43% in case of NCDEX.
One interesting point to observe is that the CAGR in traded value in case of both commodity exchanges is higher than that of the CAGR in the number of contracts traded.
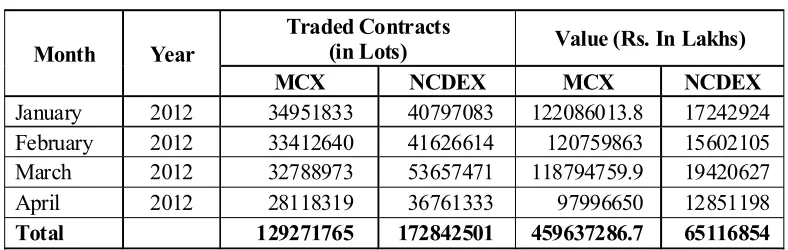
The Quantity and Value of Contracts Traded during the First Quarter of 2012 i.e., from January 2012 to March 2012 of MCX and NCDEX are presented in Table 6.
Table 6 : Quantity and Value of Contracts Traded: MCX and NCDEX
Month Year
Traded Contracts
(in Lots) Value (Rs. In Lakhs)
MCX NCDEX MCX NCDEX
January 2012 34951833 40797083 122086013.8 17242924 February 2012 33412640 41626614 120759863 15602105 March 2012 32788973 53657471 118794759.9 19420627
April 2012 28118319 36761333 97996650 12851198
Total 129271765 172842501 459637286.7 65116854
Source: www.mcxindia.com/ and www.ncdex.com/
The quantity and value of contracts traded from January 2012 to April 2012 is presented in Table 6 reemphasis that MCX out beats NCDEX in terms of value of contracts traded whereas it is vice-versa in the number of contracts traded.
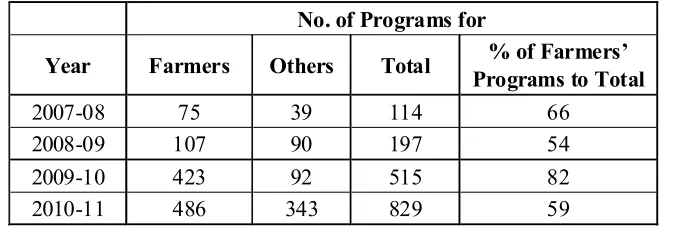
Awareness Programs organized by the Commodity Exchanges (2010-11)
organized for various stakeholders of the commodity futures market. Of this, 486 programs were held exclusively for farmers. In the year 2009-10, 515 awareness programs were held, of which 423 were exclusively for the farmers. These awareness programs have resulted in creating awareness among the various constituents about commodity futures trading and the benefits thereof. The programs were organized in association with various organizations/universities having connectivity with the farmers, viz. agricultural universities, NABCONS , farmer cooperatives and federations, GSKs, National & Regional Base Commodity Exchanges, etc.
The efficient functioning of the commodity futures market warrants active participation of physical market stakeholders. This would enable it to serve as a meaningful and effective platform for price discovery and price risk management and provide significant economic inputs to the physical market players, especially farmers, to support their production and marketing related decision making process.
The awareness programs conducted for the farmers and non farmers for the years 2007-2011 is provided in Table 7.
Table 7 : Year wise Summary of Awareness Programs conducted for Farmers / Non- farmers
No. of Programs for
Year Farmers Others Total % of Farmers’ Programs to Total
2007-08 75 39 114 66
2008-09 107 90 197 54
2009-10 423 92 515 82
2010-11 486 343 829 59
Source : Complied from www.fmc.gov.in.
There is a substantial growth in the number of programs conducted to both farmers and non farmers (Others).When compared to Non Farmers (Others), the number of programs conducted to Farmers is more. Though there are fluctuations in the percentage of Farmers Programs to total, the number of programs conducted for Farmers is more than 50% of the total Awareness Programs conducted.
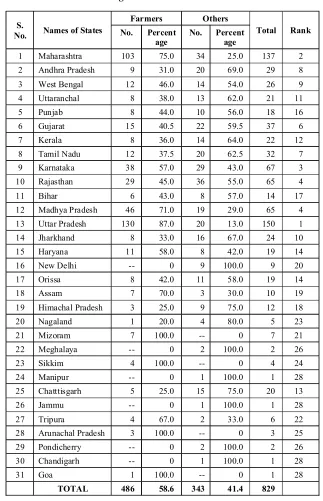
Awareness Programs: State-wise Analysis
Table 8 : Awareness Programs for Farmers / Non- farmers: State-wise
S.
No. Names of States
Farmers Others
Total Rank No. Percent
age
No. Percent age
1 Maharashtra 103 75.0 34 25.0 137 2
2 Andhra Pradesh 9 31.0 20 69.0 29 8
3 West Bengal 12 46.0 14 54.0 26 9
4 Uttaranchal 8 38.0 13 62.0 21 11
5 Punjab 8 44.0 10 56.0 18 16 6 Gujarat 15 40.5 22 59.5 37 6
7 Kerala 8 36.0 14 64.0 22 12
8 Tamil Nadu 12 37.5 20 62.5 32 7
9 Karnataka 38 57.0 29 43.0 67 3
10 Rajasthan 29 45.0 36 55.0 65 4
11 Bihar 6 43.0 8 57.0 14 17
12 Madhya Pradesh 46 71.0 19 29.0 65 4
13 Uttar Pradesh 130 87.0 20 13.0 150 1
14 Jharkhand 8 33.0 16 67.0 24 10
15 Haryana 11 58.0 8 42.0 19 14
16 New Delhi -- 0 9 100.0 9 20
17 Orissa 8 42.0 11 58.0 19 14
18 Assam 7 70.0 3 30.0 10 19
19 Himachal Pradesh 3 25.0 9 75.0 12 18
20 Nagaland 1 20.0 4 80.0 5 23
21 Mizoram 7 100.0 -- 0 7 21
22 Meghalaya -- 0 2 100.0 2 26
23 Sikkim 4 100.0 -- 0 4 24
24 Manipur -- 0 1 100.0 1 28
25 Chatttisgarh 5 25.0 15 75.0 20 13
26 Jammu -- 0 1 100.0 1 28
27 Tripura 4 67.0 2 33.0 6 22
28 Arunachal Pradesh 3 100.0 -- 0 3 25
29 Pondicherry -- 0 2 100.0 2 26
30 Chandigarh -- 0 1 100.0 1 28
31 Goa 1 100.0 -- 0 1 28
TOTAL 486 58.6 343 41.4 829
Awareness Programs are conducted to both Farmers and Non Farmers as Future Trading is done in both Agricultural and Non Agricultural Commodities. These programs create awareness about the Future Trading, Commodities included in the Future trading and the benefits they would reap through Derivative Trading.
Out of total 829 Awareness Programs conducted, more than 50% (486) of the programs are to the Farmers. In case of 13 states, the number of Awareness Programs conducted to the Farmers is more compared to the Non Farmers; whereas in case of 18 states, the number of Awareness Programs to Non Farmers is more compared to Farmers.
In case of Mizoram, Sikkim, Arunachal Pradesh and Goa, the Awareness Programs were conducted only to Farmers (100%) and in case of Meghalaya, Manipur, Jammu, Pondicherry and Chandigarh; the Awareness Programs were conducted only to Non Farmers (100%).
Uttar Pradesh, Maharashtra, Karnataka, Rajasthan, Madhya Pradesh and Gujarat occupied the top 6 positions and Meghalaya, Pondicherry, Manipur, Jammu, Chandigarh and Goa occupied last 6 positions in terms of the total number of Awareness Programs conducted.
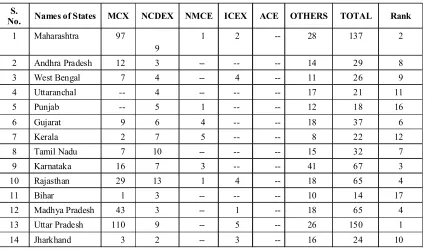
Awareness Programs by Commodity Exchanges: State-wise Analysis.
The State-wise awareness programs conducted by the various Commodity Exchanges during the year 2010-11 are provided in Table 9.
Table 9 : Awareness Programs by various Commodity Exchanges: State-wise
S.
No. Names of States MCX NCDEX NMCE ICEX ACE OTHERS TOTAL Rank
1 Maharashtra 97
9
1 2 -- 28 137 2
2 Andhra Pradesh 12 3 -- -- -- 14 29 8
3 West Bengal 7 4 -- 4 -- 11 26 9
4 Uttaranchal -- 4 -- -- -- 17 21 11
5 Punjab -- 5 1 -- -- 12 18 16
6 Gujarat 9 6 4 -- -- 18 37 6
7 Kerala 2 7 5 -- -- 8 22 12
8 Tamil Nadu 7 10 -- -- -- 15 32 7
9 Karnataka 16 7 3 -- -- 41 67 3
10 Rajasthan 29 13 1 4 -- 18 65 4
11 Bihar 1 3 -- -- -- 10 14 17
12 Madhya Pradesh 43 3 -- 1 -- 18 65 4
13 Uttar Pradesh 110 9 -- 5 -- 26 150 1
15 Haryana 3 3 -- -- -- 13 19 14
16 New Delhi 2 1 2 4 -- -- 9 20
17 Orissa 3 3 -- -- -- 13 19 14
18 Assam -- 3 -- -- -- 7 10 19
19 Himachal Pradesh
-- -- -- -- -- 12 12 18
20 Nagaland -- 1 -- 4 -- -- 5 23
21 Mizoram -- -- -- -- -- 7 7 21
22 Meghalaya -- 2 -- -- -- -- 2 26
23 Sikkim -- -- -- -- -- 4 4 24
24 Manipur 1 -- -- -- -- -- 1 28
25 Chatttisgarh -- 2 -- -- -- 18 20 13
26 Jammu -- 1 -- -- -- -- 1 28
27 Tripura 1 -- -- 1 -- 4 6 22
28 Arunachal Pradesh
-- -- -- -- -- 3 3 25
29 Pondicherry -- 2 -- -- -- -- 2 26
30 Chandigarh 1 -- -- -- -- -- 1 28
31 Goa -- -- -- -- -- 1 1 28
TOTAL 347 103 17 28 -- 334 829
Rank 1 3 5 4 2
Source: Compiled from www.fmc.gov.in.
MCX, NCDEX, NMCE, ICEX and ACE are the 5 national Commodity Exchanges and others include 16 Regional Commodity Exchanges, various Educational Institutions and other organizations including training and research institutions, viz., NABARD, NIAM, MANAGE, Agricultural Universities etc. However, ACE has not conducted any Awareness Programs during 2010-2011. A total Number of 829 Awareness Programs have been conducted by the various Commodity Exchanges in India and several other institutions, boards, universities, etc., out of which a major number of Programs are conducted by MCX (347) followed by Others including Regional Commodity Exchanges (334), NCDEX (103), ICEX (28) and NMCE (17).
Uttar Pradesh, Maharashtra, Karnataka, Rajasthan, Madhya Pradesh and Gujarat occupied the top 6 positions and Meghalaya, Pondicherry, Manipur, Jammu, Chandigarh and Goa occupied last 6 positions in terms of the total Number of Awareness Programs conducted.
Awareness Programs are expected to fulfill the following objectives
Provide in-depth knowledge about the markets and equip the trainers with necessary knowledge about the markets so that they, in turn, can train/ create awareness about the market at the grassroots level.
Build up a pool of skilled man power to man the market intermediaries and other related institutions, viz., exchanges, broking houses, warehousing agencies etc.
Sensitize the policy makers about the utility of the futures markets in providing policy inputs and to make use of them for timely and appropriate policy changes.
The programs are designed to meet the specific requirements of each category of participants.
Development of commodity futures market by spreading awareness about the role and benefits of the commodity futures market & ensuring informed participation by stakeholders in the market.
To improve the outreach of the commodity futures market and ensure that the economic benefits of price discovery and price risk management are available to all the participants.
Maximum emphasis is being given to awareness creation among the farmers.
To get the timely support of the department / agency for undertaking the identified developmental activities of the FMC
Apart from emphasizing the utility of the markets, the programs educate the participants about how to participate in the market, the precautions to be taken in this regard and the use of information generated by the market in their decision making process.
The programs are being conducted at different locations all over the country.
Meeting and exceeding the targets set for creation of awareness and capacity building for market participants.
9.
Conclusion
Multi Commodity Exchange of India Ltd (MCX) is a state-of-the-art electronic commodity futures exchange. National Commodity & Derivatives Exchange Limited (NCDEX) is a professionally managed on-line multi commodity exchange.
The Number of Contracts Traded in NCDEX far exceeds the Number of Contracts Traded in MCX due to the fact that the metals and bullions traded in MCX is more whereas in case of NCDEX, the trading in agricultural commodities is more.
NCDEX i.e., 21.63%.
The Value of Contracts Traded is very high in case of MCX compared to NCDEX due to the fact that metals and bullions traded in MCX is higher than that of NCDEX. The value of metals and bullions (MCX) far exceeds the value of agricultural commodities (NCDEX). There is a continuous growth in case of MCX whereas there are fluctuations in case of NCDEX. The CAGR is 88.56% in MCX which far exceeds the growth rate of 36.43% in case of NCDEX.
One interesting point to observe is that the CAGR in traded value in case of both commodity exchanges is higher than that of the CAGR in the number of contracts traded.
There is a substantial growth in the number of awareness programs conducted to both farmers and non farmers though the number of programs conducted to farmers is more compared to non farmers.
MCX played a major role in conducting the Awareness Programs compared to NCDEX. Overall, the performance of MCX is best.
References
1. Andy Waldock, (2011), The New Normal Commodity Volatility, www.indiafutures.com. 2. Neil Schofield, (2007), Commodity Derivatives: Markets and Applications, John Wiley &
Sons Ltd, Wiley Finance Series.
3. Sandy fe, (2011), Commodity Trading, The Journal of Finance, 2011.
4. Lan Turner, (2011), The Influences of Cycles On Commodity Trading, LanGet Updates on ForexGet, 2011.
5. Sahoo and Kumar, (2009), Efficiency and Futures Trading- Price Nexus in Indian Commodity Futures Markets, Global Business Review.
6. S.M.Lokare, (2007), Commodity Derivatives and Price Risk Management: An Empirical Anecdote from India, Reserve Bank of India Occasional Papers, 2007.
7. Narendra.L.Ahuja, (2006), Commodity Derivative Market in India: Development, Regulation and Future Prospects, International Research Journal of Finance and Economics, issue 2, 2006.
8. D. S. Kolamkar,(2004), Regulation and Policy issues for Commodity Derivatives in India, FMC official article, 2004.