Research Article
CODEN: IJPNL6
DEVELOPMENT AND VALIDATION OF STABILITY INDICATING RP-HPLC
METHOD FOR SAXAGLIPTIN AND METFORMIN IN TABLET DOSAGE FORM
Asiya Begum*, Shilpa K, A. Ajitha, V. Uma Maheshwar Rao
Department of pharmaceutical analysis and quality assurance, CMR college of Pharmacy,
Kandlakoya(v), Medchal, Hyderabad.
*Corresponding author e-mail: [email protected]
ABSTRACT
A sensitive selective and precise stability indicating-high performance liquid chromatographic (HPLC) method was developed for Saxagliptin and Metformin in Tablet dosage form. An isocratic separation was carried out using Zorbax C18 (250 x 4.6 mm, 5 μm) column and Potassium dihydrogen Phosphate: Methanol (60:40 v/v) as mobile phase.With quantification carried out at a wavelength of 248nm. The stability studies under stress condition of hydrolysis (acid, base), oxidation, photolysis and thermal degradation were also carried out for Saxagliptin and Metformin.The Retention time of Saxagliptin and Metformin were observed to be 3.241and 2.191 minutes, respectively with theoretical plate count and asymmetry as per the ICH limits. The % assay of Saxagliptin and Metformin were 99.640% and 99.021%. The flow rate was found to be 1ml/min .The linear regression analysis data for the calibration plots showed a good linear relationship for Saxagliptin and Metformin over a concentration range of 50-1500 μg/ml with correlation co-efficient of 0.999 for Saxagliptin and 0.999 for Metformin. The limit of detection and Quantitation were found to be 2.857,2.918& 9.52,9.72μg/ml, respectively.the method was validated as per ICH guidelines and it was found to be acccurate, precise and selective stability-indicating high performance liquid chromatographic (HPLC) for the determination of Saxagliptin and Metformin in tablet dosage form.
Keywords: Saxagliptin, Metformin, HPLC, Stability
INTRODUCTION
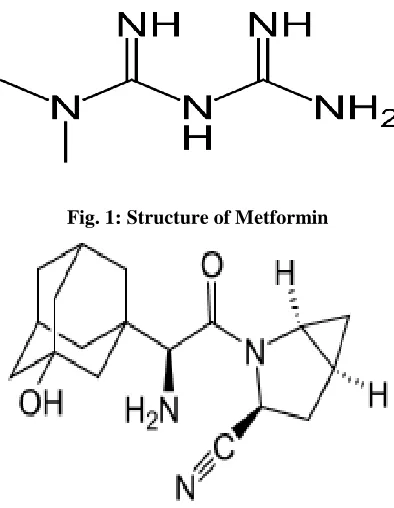
Metformin is N,N-Dimethylimidodicarbonimidic diamide, reduce hepatic glucose output and increase uptake of glucose by the periphery, including skeletal muscle. Metformin may act via 3 mechanisms: Reduction of hepatic glucose production by inhibiting gluconeogenesis and glycogenolysis in muscle; modestly increasing insulin sensitivity, improving peripheral glucose uptake and utilisation; delaying intestinal glucose absorption.
Saxagliptin is (1S,3S,5S)-2-[(2S )-2-amino-2-(3-hydroxy-1-adamantyl)acetyl]-2-azabicyclo [3.1.0] hexane-3-carbonitrile, a new oral hypoglycemic (anti-diabetic drug) of the new dipeptidyl peptidase-4 (DPP-4) inhibitor class of drugs. DPP-4 is an enzyme that breaks down incretion hormones glucagon-like peptide 1 (GLP-1). As a DPP-4 inhibitor, Saxagliptin
slows down the breakdown of incretion hormones, increasing the level of these hormones in the body. A Saxagliptin/Metformin extended-release tablet is a dipeptidyl peptidase-4 (DPP-4) inhibitor and biguanide combination. It works by increasing the amount of insulin released by your body. It decreases the amount of sugar that the liver produces and the intestines absorb. It also helps to make your body more sensitive to the insulin that you naturally produce.
The US Food and Drug Administration (FDA) November 8, 2010 , has approved the first and only once-daily combination tablet featuring Saxagliptin and extended-release (XR) Metformin HCl to improve glycemic control in adults with type 2 diabetes mellitus.
The literature survey reveals that several, HPLC, fluorescence,uv-vissible methods [11-17] , have been reported for the analysis of Saxagliptin and
International Journal of Pharmacy
Metformin a single drug or in combination in pharmaceutical dosage form. This paper describes simple, precise, accurate and sensitive- HPLC method development and validation as well as stability studies (hydrolysis, oxidation, photo-degradation and thermal photo-degradation) as per international conference on harmonization guidelines. .
MATERIALS AND METHODS
Instrumentation: The separation was carried out on HPLCsystem with Waters 2695 alliance with binary HPLC pump,Waters 2998 PDA detector, Waters Empower2 software and c18 Zorbax column (250mmx4.6mm, particle size5μm).
Reagents and Chemicals: Saxagliptin and Metformin pure drug samples were provided by Rainbow Pharma Training Lab Hyderabad. Potassium dihydrogen phosphate and Methanol were of HPLC grade . Fixed dose combination Tablet (Brand name: Kombiglyze XR) containing 5mg of Saxagliptin and 500mg of Metformin were procured from local pharmacy, Hyderabad, India.
Chromatographic Conditions: The mobile phase consisting of Potassium dihydrogen phosphate and Methanol(HPLC grade) were filtered through 0.45μ membrane filter before use, degassed and were pumped from the solvent reservoir in the ratio of 60:40v/v was pumped into the column at a flow rate of 1.0ml/min. The column temperature was 30°C. The detection was monitored at 248nm and the run time was 8min. The volume of injection loop was 3μl prior to injection of the drug solution the column was equilibrated for at least 30 min. with the mobile phase flowing through the system.
Preparation of standard solution: Accurately weigh 500mg of Metformin and 5mg of Saxagliptin into a 50ml of volumetric flask and dissolve the sample using water and sonicate it for 15min then finally make up the volume to 50ml.Now pipette out 1ml of this solution into 25ml of volumetric flask and make up the volume upto mark using mobile phase as shown in figure 3.
Preparation of sample solution: Accurately weighed 2 tablets and calculated average weight of those tablets and crushed. Transfer the tablet powder weigh about 1175.35mg of sample into 50ml of volumetric flask added with methanol and water and sonicated for 30mins and make up the volume with water and filtered through the0.45μm millipore filter paper Transfer above solution 5ml into 25ml
volumetric flask and make up the volume with mobile phase chromatogram is shown in figure 4.
Development and Validation of HPLC method:
Present study was conducted to obtain a new, affordable, cost-effective and convenient method for HPLC determination of Saxagliptin and Metformin in tablet dosage forms. The experiment was carried out according to the official specifications of ICH- 1996, Global Quality Guidelines- 2002. The method was validated for the parameters like system suitability, selectivity, linearity, accuracy, precision, and robustness.
System suitability: A standard solution was prepared using Saxagliptin and Metformin working standard as per the test method and was injected six times into the HPLC system. The parameters namely USP plate count, peak asymmetry factor and resolution for the standard solutions were calculated.
Selectivity: Specificity was checked for the interference of impurities in the analysis of blank solution and injecting sample solution under optimized chromatographic conditions to demonstrate separation of both Saxagliptin and Metformin from impurities.
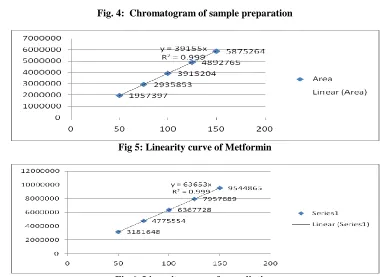
Linearity: Linearity of the method was determined by constructing calibration curves. Standard solutions of Saxagliptin and Metformin at different concentrations level level (50%, 75%, 100%, 125%, and 150%) were used for this purpose. Before injection of the solutions, the column was equilibrated for at least 30min with the mobile phase. Each measurement was carried out in six replicates to verify the reproducibility of the detector response at each concentration level. The peak areas of the chromatograms were plotted against the concentrations of Saxagliptin and Metformin to obtain the calibration curves. The five concentrations of the standard were subjected to regression analysis to calculate calibration equation and correlation coefficients.
Accuracy: Accuracy is the closeness in agreement between the accepted true value or a reference value and the actual result obtained. Accuracy studies are usually evaluated by determining the recovery of a spiked sample of the analyte into the matrix of the sample to be analyzed.
recorded. The precision is expressed as the % RSD of Peak areas and it should not be more than 2%.
Robustness: The robustness of the method was assessed by altering the some experimental conditions such as, by changing the flow rate from 0.9 to1.1 ml/min, amount of diluents (10% to 15%) the temperature of the column (28°C to 32°C) and pH of the mobile phase.
Limit of detection and limit of quantitation: Limit of detection and limit of quantitation represent the concentration of analyte that would yield signal to noise ratio of 3 for LOD and 10 for LOQ respectively. To determine LOQ and LOD serial dilutions of mixed standard solution of Saxagliptin and Metformin was made from standard solution. The samples were injected in LC system and measured signal from the samples was compared with those of blank samples.
Stress Degradation Studies of Bulk Drug: Stress degradation studies were carried under condition of acid, base, neutral hydrolysis, oxidation, dry heat and photolysis. For each study, two samples were prepared. The blank subjected to stress in the same manner as the drug solution. Dry heat and photolytic degradation were carried out in solid state.
Alkaline hydrolysis: 1 ml working standard solution o (1000 μg/ml) was mixed with 1 ml of 0.1 N methanolic NaOH and 8 ml of Methanol. The solution was kept for 30 min in dark place. The 1 ml of resulting solution was diluted with mobile phase to 10 ml (10 μg/ml) and then was injected into the system.
Acidic hydrolysis: 1 ml working standard solution (1000 μg/ml) was mixed with 1 ml of 0.1 N methanolic HCl and 8 ml of methanol. The solution was kept for 30 min in dark place. The 1 ml of resulting solution was diluted with mobile phase to 10 ml (10 μg/ml) and then was injected.
Oxidation: 1 ml working standard solution (1000 μg/ml) was mixed with 1 ml of 30 % solution of H2O2 and 8 ml of methanol. The solution was kept for 30 min in dark place. The 1 ml of resulting solution was diluted to 10 ml with mobile phase (10 μg/ml) and then was injected.
Degradation under dry heat: Dry heat studies were performed by keeping drug sample in oven (1000 C) for a period of 1 hour. Sample was withdrawn after 1 hour and processed as per standard solution preparation procedure mentioned under Preparation
of Standard stock solution to get 10μg/ml as final concentration and was injected.
Photo-degradation studies: Photolytic studies were also carried out by exposure of drug to UV light up to 200 watt hours/square meter and subsequently to cool fluorescent light to achieve an illumination of 1.2 million Lux.Hr.Sample was withdrawn after exposure and processed as per standard solution preparation procedure mentioned under Preparation of Standard stock solution to get 10 μg/ml as final concentration and was injected.
RESULTS AND DISCUSSION
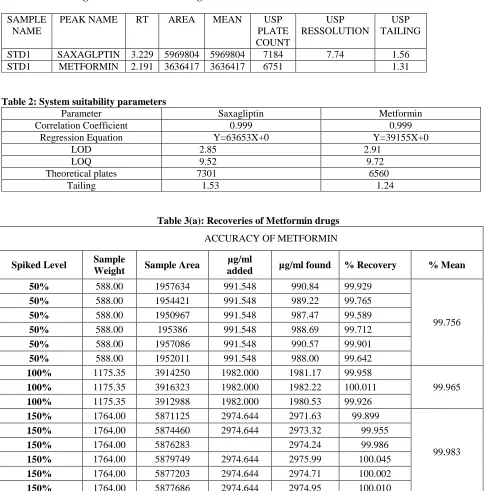
Method Development System suitability: The system suitability tests were carried out to evaluate the resolution and reproducibility of the system for the analysis. Table1 summarized the test results of system suitability study.
Linearity: The linearity of the developed method was determined in triplicate at different concentrations ranging from50%, 75%, 100%, 125%, and 150% were used for Saxagliptin and Metformin. The Regression coefficient (R2) was 0.99 for both drugs, showing good linearity. The results confirmed the linearity of the standard curves over the range studied and the excellent reproducibility
Accuracy Accuracy was determined by the recovery studies at three different concentrations (corresponding to 50, 100 and 150% of the test solution concentration) by addition of known amounts of standard to pre-analysed sample preparation. For each concentration, three sets were prepared and injected. The recovery studies were carried out six times and the percentage recovery and standard deviation of the percentage recovery were calculated. From the data obtained in added recoveries of standard drugs were found to be accurate as shown in table 2(a & b).
Precision: Method Precision was determined by injecting six replicates of drug sample solution. The retention times and peak areas of six replicates are recorded. The precision is expressed as the % RSD of Peak areas and it should not be more than 2% shown in table 4.
Limit of detection and limit of quantification:
Limit of detection and limit of quantification represent the concentration of analyte that would yield signal to noise ratio of 3 for LOD and 10 for LOQ respectively. To determine LOQ and LOD serial dilutions of mixed standard solution of Saxagliptin and Metformin was made from standard solution. The samples were injected in the system and measured signal from the samples was compared with those of blank samples. LOD and LOQ was calculated from linear curve using formulae LOD= 3.3 * σ / slope, LOQ= 10 * σ / slope (Where σ = the standard deviation of the response and S = Slope of calibration curve) shown in table 6.
FORCED DEGREDATION STUDIES: A study
was conducted to demonstrate the effective separation of degradents. Seprate portions of drug products and placebo was exposed to induced degradation under stressed conditions like acid(2N HCL),base(2N NaOH),Peroxide(5%H2O2),UV
Light(200wts.hr/cm2 for 55hrs,heat(1050 for 48 hrs).Stressed samples into HPLC system using photo
diode array(PDA) detector for above test method conditions. The chromatograms of stressed samples were evaluated.
CONCLUSION
The proposed RP-HPLC method was validated as per International Conference on Harmonization (ICH) guidelines, and found to be applicable for routine quality control analysis for the simultaneous estimation of Saxagliptin and Metformin using isocratic mode of elution. The results of linearity, precision, accuracy and specificity, proved to be within the limits. The proposed method is highly sensitive, reproducible, reliable, rapid and specific. Hence, this method can easily and conveniently adopt for routine quality control analysis of Saxagliptin and Metformin in its pharmaceutical dosage forms.
ACKNOWLEDGEMENT
The authors are thankful to Rainbow Pharma Training Lab, Kukatpally, Hyderabad.
Fig. 1: Structure of Metformin
Fig. 3: Chromatogram of standard preparation
2.
19
1 3.24
1
AU
0.00 0.20 0.40 0.60 0.80 1.00
Minutes
0.00 0.50 1.00 1.50 2.00 2.50 3.00 3.50 4.00 4.50 5.00
Fig. 4: Chromatogram of sample preparation
Fig 5: Linearity curve of Metformin
Table 1: Chromatogram data of standard drugs.
SAMPLE NAME
PEAK NAME RT AREA MEAN USP PLATE COUNT
USP RESSOLUTION
USP TAILING STD1 SAXAGLPTIN 3.229 5969804 5969804 7184 7.74 1.56 STD1 METFORMIN 2.191 3636417 3636417 6751 1.31
Table 2: System suitability parameters
Parameter Saxagliptin Metformin Correlation Coefficient 0.999 0.999
Regression Equation Y=63653X+0 Y=39155X+0 LOD 2.85 2.91
LOQ 9.52 9.72 Theoretical plates 7301 6560
Tailing 1.53 1.24
Table 3(a): Recoveries of Metformin drugs
ACCURACY OF METFORMIN
Spiked Level Sample
Weight Sample Area
µg/ml
added µg/ml found % Recovery % Mean
50% 588.00 1957634 991.548 990.84 99.929
99.756
50% 588.00 1954421 991.548 989.22 99.765
50% 588.00 1950967 991.548 987.47 99.589
50% 588.00 195386 991.548 988.69 99.712
50% 588.00 1957086 991.548 990.57 99.901
50% 588.00 1952011 991.548 988.00 99.642
100% 1175.35 3914250 1982.000 1981.17 99.958
99.965
100% 1175.35 3916323 1982.000 1982.22 100.011
100% 1175.35 3912988 1982.000 1980.53 99.926
150% 1764.00 5871125 2974.644 2971.63 99.899
99.983
150% 1764.00 5874460 2974.644 2973.32 99.955
150% 1764.00 5876283
2974.644
2974.24 99.986
150% 1764.00 5879749 2974.644 2975.99 100.045
150% 1764.00 5877203 2974.644 2974.71 100.002
Table 3(b): Recoveries of Saxagliptin drugs
ACCURACY OF METHYLCOBALAMIN
Spiked level
Sample weight
Sample Area µg/ml added µg/ml found % Recovery % Mean
50% 588.00 3181180 9.976 9.96 99.893 99.985 50% 588.00 3184646 9.976 9.98 100.002
50% 588.00 3186776 9.976 9.98 100.069 50% 588.00 3185510 9.976 9.98 100.029 50% 588.00 3185742 9.976 9.98 100.036 50% 588.00 3180897 9.976 9.96 99.884
100% 1175.35 6363757.00 19.940 19.93 99.970 99.947 100% 1175.35 6361200.00 19.940 19.93 99.930
100% 1175.35 6361955.00 19.940 19.93 99.942
150% 1764.0 9540806 29.927 29.89 99.864 99.872 150% 1764.0 9540078 29.927 29.89 99.857
150% 1764.0 9542123 29.927 29.89 99.878 150% 1764.0 9540626 29.927 29.89 99.863 150% 1764.0 9540930 29.927 29.89 99.866 150% 1764.0 9544492 29.927 29.90 99.903
Table-4: Precision studies of Saxagliptin and Metformin
S.No Sample Weight Sample Area-1 Sample Area-2 % Assay % Assay
1 1176.00 3912371 6368994 98.956 99.697 2 1176.00 3916122 6366580 99.051 99.659 3 1176.00 3912689 6364965 98.964 99.634 4 1176.00 3912237 6361053 98.953 99.573 5 1176.00 3916865 6362443 99.070 99.595 6 1279.36 3919368 6367828 99.133 99.679 Average
Assay:
99.021 99.640
STD 0.075 0.048 % RSD 0.075 0.049
Table 5(a): Robustness of Saxagliptin
Sample Name Peak Name RT AREA USP TAILING USP PLATE
COUNT 1 TEMP1 SAXAGLIPTIN 3.202 6174662 1.53 7018
2 TEMP2 SAXAGLIPTIN 3.200 6210297 1.54 7210
3 FLOW1 SAXAGLIPTIN 4.003 8616889 1.55 7696
Table 5(b): Robustness of Metformin
Sample Name Peak Name RT AREA USP TAILING USP PLATE
COUNT 1 TEMP1 METFORMIN 2.200 4101740 1.30 6869
2 TEMP2 METFORMIN 2.201 4125529 1.31 7031
3 FLOW1 METFORMIN 2.756 5793369 1.29 7224
4 FLOW2 METFORMIN 1.829 3427648 1.32 6439
Table 6: LOD and LOQ of Saxagliptin and Metformin
DRUG LOD(μg/ml) LOQ(μg/ml) Saxagliptin 2.85 9.52
Metformin 2.91 9.72
Table-6: Forced Degradation of Saxagliptin
Table-7:Forced Degradation of Metformin
S.NO Sample Weight Sample Area 1 %Assay %Degradation
Acid 1176 2531753 64 -35 Base 1176 2848071 72 -27 Peroxide 1176 2727720 69 -30 Light 1176 3616563 91 -8 Heat 1176 3524063 89 -10 Average Assay 2541361.7
STD 1319785.7
REFERENCES
1. Indian Pharmacopoeia; Indian Pharmacopoeia commission, Ghaziabad, volume- II, p. 1250; 2010.
2. British Pharmacopoeia; British Pharmacopoeia Commission Office, London, volume- I, p 758- 759; 2011. 3. Martindale- The Extra Pharmacopoeia; 31st Edn; The Royal Pharmaceutical Society, London, p. 310; 1996. 4. The Merck Index- An Encyclopedia of Chemicals, Drugs and Biological;; Merck Co. Inc., whitehouse, 14th Edn
p. 3429; 2001.
5. Tripathi KD. Essentials of Medical Pharmacology; Jaypee Brothers Medical Publishers Ltd, New Delhi, chapter- 33, 6th Edn; p. 441.
6. Instrumental method of chemical analysis B.K.Sharma Pg no 286-370
7. Gurdeep R. Chatwal, Sham K. Anand; Instrumental Methods of Chemical Analysis; 5th edition, Himalaya Publishing House; 2002.
S.NO Sample Weight Sample Area 1 %Assay %Degradation
Acid 1176 5021256 79 -21 Base 1176 5236073 82 -18 Peroxide 1176 5115763 80 -20 Light 1176 6032525 94 -6 Heat 1176 5936685 93 -7 Average Assay 4557050
8. The Merck Index- An Encyclopedia of Chemicals, Drugs and Biological; Merck Co. Inc., Whitehouse, 14th Edn; p. 6047; 2001.
9. Hardman JG., and Limbird LE. Goodman & Gilman’s Manual of Pharmacology and Therapeutics;; McGraw-Hill, New Delhi, p. 1505-1510; 10th Edn 2001.
10. ICH–Guidelines, Validation of Analytical Procedures: Methodology; ICH Harmonized Tripartite Guidelines, Q2(R1), Geneva, Switzerland, p. 5-17; 2005.
11. N.V.M.S. Bhagavanji, development and validation of stability indicating liquid chromatographic method for the simultaneous estimation of metformin and saxagliptin in combined dosage form, VSRD International Journal of Technical & Non-Technical Research, Vol. 3 No. 11 November 2012.
12.Patil Prafulla Prakash, Kalkotwar Ramesh, Patil Vikas , Jadhav Vijay., Patil Nilesh, a new rp – hplc method for determination of metformin hcl and saxagliptin in tablet dosage form, IJPBS ,Volume ,Issue 4 ,OCT-DEC ,2012,161-167 .
14.Serife Evrim Kepekci Tekkeli, Mustafa Volkan Kızıltaş, Demet Dinçel, an hplc for the determination of saxagliptin in human plasma with fluorescence detection, Journal: Journal of Advances in Chemistry vol. 5, no. 3, December05 ,2013.
15. Narendra Nyola, Govinda Samy Jeyabalan, Development and validation of uv-vis specctroscopy method for simultaneous estimation of saxagliptin hydrochloride and metformin hydrochloride in active pharmaceutical ingrident, J Pharm Educ Res Vol. 3, Issue No. 2, December 2012.
16.Srikanth Inturi,Ravikanth Inturi, Israel kumar Tagaram, validated novel lc determination of saxagliptin in pure bulk and pharmaceutical dosage forms, ijprd, 2011; vol 3(8): november 2011