e-ISSN: 2278-067X, p-ISSN: 2278-800X, www.ijerd.com Volume 8, Issue 1 (July 2013), PP. 38-45
Evalutation of Reservior Impacts on Soil Quality Using
Remote Sensing and Gis: A Model Study
M.Sujatha
1, SS. Asadi
2, P.Bramhaji Rao
31
Assistant Professor, Division of Ecology and Environment, KL University, Green fields,Vaddeswaram-522502,Guntur(D.t) A.P, India, Email:[email protected]
2
Associate Professor, Dept.of. Civil Engineering, KL University, Green fields,Vaddeswaram-522502,Guntur(D.t) A.P, India, Email:[email protected]
3
Assistant Professor, Dept.of.Environmental Sciences, Acharya Nagarjuna University, Guntur (D.t) A.P, India.
Abstract:- The problem of soil quality in and around reservoirs is attracting attention for the last couple of years due to the unscientific and unplanned irrigation practices that are bringing a myriad problem. Modern
industrialization practices such as chemical industries and indiscriminate use of fertilizers in agricultural activity containing toxic substances contribute to the environmental degradation. Such anthropogenic activities invariably result in the depletion of soil quality,
Deterioration of soil quality, contamination of drinking water and various health hazards. Hence there is need to study in a comprehensive way about the soil quality issues in the catchment area.
The present study is an attempt made to analyze the physico-chemical parameters and to generate the Soil Quality Index in and around the tandava Reservoir. The soil samples collected at the predetermined locations are analyzed for physico-chemical parameters for the generation of attribute database. Based on the analysis results spatial distribution maps of selected soil quality parameters namely Bulk Density, Moisture content, Organic matter, C%, pH, EC, Ca, Mg, SO4, Nitrate, Phosphorus, Potassium and Texture are prepared using curve-fitting method in GIS software. The physico-chemical analysis properties and computation of SQI are helpful in the grouping of soil samples into excellent, good, poor, very poor and unfit. The spatial distribution of SQI generated in the current study will be of much use for the planners in the management and monitoring of land resources.
Keywords:- Soil Quality, Spatial distribution, Soil Quality Index
I. INTRODUCTION
Soil is a living system that represents a finite resource vital to life on earth. It forms the thin skin of unconsolidated mineral and organic matter on the earth’s surface. It develops slowly from various parent materials and is modified by time, climate, macro- and microorganisms, vegetation, and topography. Soils are complex mixtures of minerals, organic compounds, and living organisms that interact continuously in response to natural and imposed biological,
Chemical and physical forces. People are dependent on soils, and conversely, good soils are dependent on people and the use they make of the land. Soils are the natural bodies in which plants grow. They provide the starting point for successful agriculture. Rapid increase in human population increased the stress on natural resources including soil. Soil degradation impacts agricultural production and adversely affects other natural resources.
Soil pollution is often thought of as resulting from chemical contamination such as use of excessive amounts of pesticides and fertilizers that can result in surface water and / or ground water contamination. However, there are other forms of soil pollution or degradation, including erosion, compaction, and salinity. Soils have often been neglected when they are used for on-site land disposal of waste chemicals and unwanted materials. Most soils are capable, to some degree, of adsorbing and neutralizing many pollutants to harmless levels through chemical and biochemical processes. Healthy soils give us clean air and water, bountiful crops and forests, product rangeland, diverse wild life, and beautiful land scapes. Soil does all this by performing five essential functions of regulating water, sustaining animal and plant life, filtering potential pollutants, cycling nutrients and supporting structures.
II. STUDY AREA
2.1Objectives Of The Study
1) To prepare the thematic maps of the study area, which form the spatial database using remote sensing and GIS techniques.
2) To create attribute digital database consisting of selected soil quality parameters derived from the analysis of soil samples collected from predetermined locations in the study area and computation of soil quality index. 3) To develop spatial distribution maps showing variations in soil quality index by integrating the spatial digital data and attribute data in the process of building its topology on ARCGIS platform.
III. METHODOLOGY
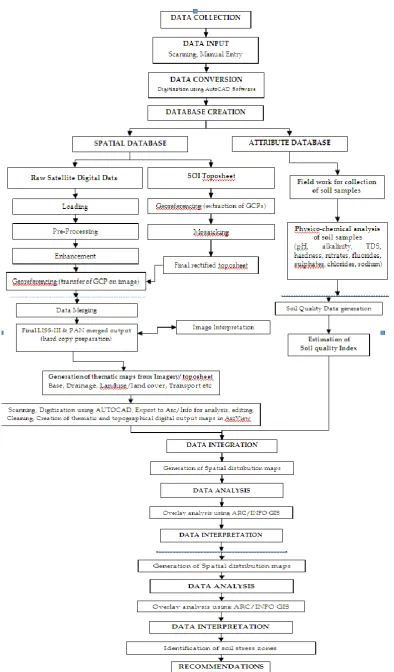
3.1 Data collection: Different data products required for the study include Survey of India (SOI) toposheets bearing with numbers 65k/6 on 1:50,000 scale. Fused data of IRS–1D PAN and LISS-III satellite imagery obtained from National Remote Sensing Agency (NRSA), Hyderabad, India. Collateral data collected from related organizations, comprises of soil quality and demographic data.
3.2 Database creation:
Satellite imageries are georeferenced using the ground control points with SOI toposheets as a reference and further merged to obtain a fused, high resolution (5.8m of PAN) and colored (R,G,B bands of LISS-III) output in EASI/PACE Image processing software. The study area is then delineated and subsetted from the fused data based on the latitude and longitude values and a final hard copy output is prepared for the generation of thematic maps using visual interpretation technique . These thematic maps (raster data) are converted to vector format by scanning using an A0 flatbed deskjet scanner and digitized using AutoCAD software for generation of digital thematic maps using Arc/Info and ARCVIEW GIS software. The GIS digital database consists of thematic maps like land use/land cover, drainage, road network using Survey of India (SOI) toposheets and fused data of IRS - ID PAN and IRS-ID LISS-III satellite imagery.
3.2.1 Spatial Database: Thematic maps like base map and drainage network maps are prepared from the SOI toposheets on 1:50,000 scale using AutoCAD and Arc/Info GIS software to obtain a baseline data maps of the study area was prepared using visual interpretation technique from the fused satellite imagery (IRS-ID PAN + IRS-ID LISS-III) and SOI toposheets along with ground truth analysis. All the maps are scanned and digitized to generate a digital output.
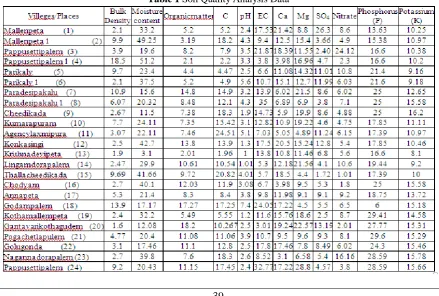
3.2.2 Attribute database: Fieldwork is conducted and ground water samples are collected from 24 predetermined locations based on the land use and drainage network maps in the study area. Care is taken in collecting the soil samples for uniform distribution and density of sampling locations. The soil samples were analyzed for various physico-chemical parameters adopting standard protocols (APHA, AWWA, WPCF 1998). The soil quality data thus obtained forms the attribute database for the present study (Table 1).
3.3 Integration of spatial and attribute database
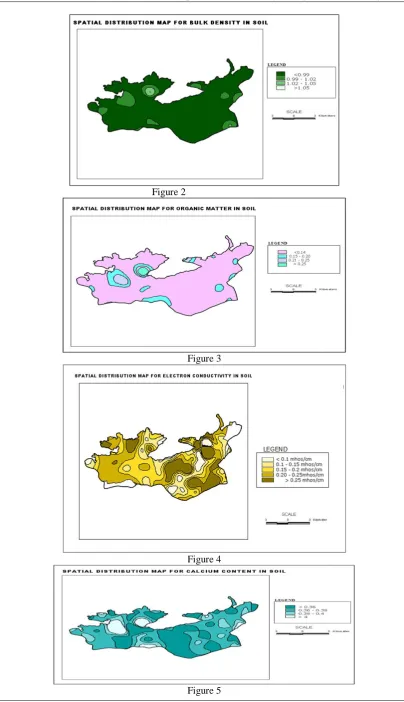
The spatial and the attribute database thus generated are integrated for the preparation of spatial distribution maps of selected soil quality parameters like Bulk Density,Moisture content,Organic matter, pH, EC, Sulphates,calcium,Magnesium,carbon,nitrates potassium,phosphorus and Soil Quality Index (SQI). The soil quality data (attribute) is linked to the sampling location (spatial) in ARCGIS and maps showing spatial distribution were prepared to easily identify the variation in concentrations of the above parameters in the ground water at various locations of the study area using curve fitting technique of ARCGIS software.
3.4 Spatial Modelling and Surface Interpolation through IDW
Though there are a number of spatial modelling techniques available with respect to application in GIS, spatial interpolation technique through Inverse Distance Weighted (IDW) approach has been used in the present study to delineate the locational distribution of soil pollutants or constituents. This method uses a defined or selected set of sample points for estimating the output grid cell value. It determines the cell values using a linearly weighted combination of a set of sample points and controls the significance of known points upon the interpolated values based upon their distance from the output point thereby generating a surface grid as well as thematic isolines. Important soil quality indicating parameters and their distribution patterns were studied with the help of cartographic techniques. The generated figures are self-explanatory and obviously convey the quality of each parameter for all the samples. Thus, GIS enables us to look into the cause and effect relationship with visual presentation.
3.5 Estimation of Soil Quality Index (SQI)
Soil Quality Index (SQI) is a very useful and efficient method for assessing the quality of soil. It is a useful tool for communicating the information on overall quality of soil. Five soil attributes namely acidity (pH), Organic Matter (OM), Phosphorus (P), Potassium (K), and Electrical Conductivity (EC), have been combined to construct an index to represent the soil quality.
The soil quality index has been constructed by the following method given by 13. SQI = ( DpH + DOM + DP + DK + DEC ) / 5 Where,
D pH = 1 if pH > 6.5 and 0 otherwise DOM = 1 if OM > 2 and 0 otherwise DP = 1 if P > 20 and 0 other wise DK = 1 if K > 80 and 0 otherwise DEC = 1 if EC < 2 and 0 otherwise
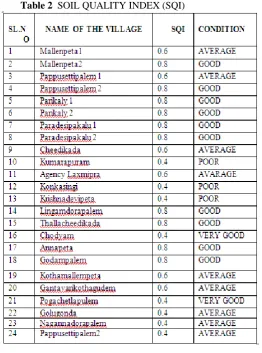
The Soil Quality Index (SQI) is computed for all sites of the study area. SQI is bounded between 0 to 1, and the higher the SQI the better the quality of soil. Based on the SQI values, the soil quality scale is rated as good (>0.7), average (0.4 – 0.7) and poor (0 – 0.4).
IV. RESULTS AND DISCUSSION
In the present study soil samples have been taken 24 samples well distributed locations in the study area. The samples have been analyzed for different parameters like Bulk Density,Moisture content,Organic matter, pH, EC, Sulphates, calcium,Magnesium, nitrates, carbon, potassium, phosphorus. .
Physico-chemical analysis of 24 samples in the study area reveals minimum bulk density of 1.6 and maximum of 18.5 at sample no.4.Maximum variation of 15.5% in a year occurs at sample no.4 and minimum variation of 2.1 sampleno.1 and 1.6% in a year occurs at sample no.1Bulk density values of all the samples are well within the permissible limits.
Organic matter value of 0.8 is observed as minimum in sample no.4 and the maximum value was found to be 17.27 at sample no.18. Organic matter values observed in all the samples of study area are lower than the desired values. The variation of organic matter in a year is higher on downstream side when compared to upstream side of the study area.
The moisture content value of 3.1 is observed as minimum in sample no.13 and the maximum value was found to be 41.66 at sample no.15.
The Electrical Conductivity (EC) values of soil in study area is range of minimum 3.8 at sample no.4. and the maximum value was found to be 32.77 at sample no.24.all the samples in the study area are within the permissible limits.
Minimum pH value of 1 was observed in sample no.13, and a maximum pH value of 7.4 was observed in sample no.18.
Sulphates minimum value of 1.72 was observed in sample no.1 and a maximum value of 263 was observed in sample no.1 , magnesium minimum value of 4.4 was observed in sample no.15 and a maximum value of 22.57 was observed in sample no.20
sample no.19. Potassium (K) value of 8.1 was observed as minimum in sample no.13 and maximum value of 15.78 was found in samples no.23 Carbon value of 2.2 was observed as minimum in sample no.4 and maximum value of 24.51 was found in samples no.11.
V. CONCLUSIONS
Based on the all above parameters, SQI was computed to determine the soil quality and categorized into good, average and poor From the analysis results and soil quality rating scale , it revealed that eleven samples (41.65%) were of good with SQI ranging from (>7), six samples i.e.24% are rated as average (SQI of 0.4 to 0.7) and eight samples i.e.33.36% are considered poor with SQI ranging between (0 to 0.4). On downstream side of study area 26% samples are good, 16.5%
arameters is essential in determining the effect on soil quality. The overall study reveals that soil quality parameters organic matter, potassium and phosphorous are with in the permissible limits of study area. 57% oaverage and 58.4% are poor. While on upstream side of study area, 58.2% of samples are good, 33.4% average and 8.35% are poor.
Soil quality is largely a function of chemical proportion such as organic matter, calcium, magnesium, sulfur, pH, nitrate, potassium and phosphorous. Assessment of these pf the samples collected around industries are of poor/average quality, while remaining 43% are of good quality. The areas of poor soil quality are observed to be located on down stream of study area and good water quality is observed on upstream of the study area.
Table 2 SOIL QUALITY INDEX (SQI)
REFERENCES
[1] Karlen, D.L., Andrews, S.S., and Doran. J.W., Soil quality, current concepts and applications, Advances in agronomy, 2001, 74, 1-40.
[2] Thomos. M., Lillesand and Ralph W., Keifer, Remote sensing and image interpretation, Fourth edition, John Willey and sons, Inc, Newyork, 2000.
[4] Doran, J.W., and Parkin, T.B., Qualitative indicators of soil quality, A minimum data set, 25-37, pub.49, SSSA, Madison, WI, 1996.
[5] Doran, J.W., and Parkin T.B., Defining and Assessing soil quality, p 1-22.SSSA, Pub 35, 1994.
[6] Eswaran, H., Beinroth, F.H., Reich, P.F., and Quandt, L.A.,. Soils: their properties, classification, distribution and management. NRCS, 1999.
[7] Fritton, D.D., and G.W., Olson., Bulk density of fragi pan soil in natural and distributed profiles, SSSA, proc, 1972, 36,686-89.
[8] Herrick, J.E., soil quality an indication for sustainable land management, Applied soil ecology, 2000, 15, 75-83.
[9] Hrinink, J.T.M., Soil requirements for use in urban environments, Soil till, Res, 1998, 47, 157-162. [10] Karlen, D.L., Eash N.S., and Unger, P.W., Soil and crop management effects on soil quality indicators,
AJAA, 1992, 7, 48-55.
[11] District Census Handbook of Nellore, Directorate of Census Operations, Andhra Pradesh, Census of India, 1991.
[12] APHA, AWWA, WPCF, Standard Methods for the Examination of Water and Wastewater, 20th edition, American Public Health Association, Washington DC, New York, 1998.
[13] Abassi, S.A., Water quality indices: state –of-the art, Journal IPHE, 1999, 21, 22-25.
[14] Larson, W.E., and Pierce, F.J., Construction and enhancement of soil quality, SSSA, 1991, 35, 176. [15] Nyle C.Brady., The nature and properties of soils, 12th edition, EEE, Prenctic-Hall, 2002.
[16] Parr, J.F., Papendic, R.I., Hornic, S.B., and R.E., Mayer, Soil quality, Attributes and relationship to alternative and sustainable agriculture, AJAA, 1992, 7, 5.
[17] Ramakrishnan, S.S., and Guruswamy, V., GIS applications in soil data analysis, Journal of environmental quality, 2000, 25, 433-439.
[18] Anji Reddy, M., Textbook of Remote Sensing and Geographical Information Systems, B.S. Publications, Hyderabad, 2004.
[19] Karlen, D.L., Andrews, S.S., and Doran. J.W., Soil quality, current concepts and applications, Advances in agronomy, 2001, 74, 1-40.
[20] Thomos. M., Lillesand and Ralph W., Keifer, Remote sensing and image interpretation, Fourth edition, John Willey and sons, Inc, Newyork, 2000.
[21] Brejda John J., and Thomas B., Moor man, Identification and interpretation of regional soil quality factor for the central high plains of mid western USA, in sustaining the global farm, 10th international soil conservation organization, Purdue University, 2001.
[22] Doran, J.W., and Parkin, T.B., Qualitative indicators of soil quality, A minimum data set, 25-37, pub.49, SSSA, Madison, WI, 1996.
[23] Doran, J.W., and Parkin T.B., Defining and Assessing soil quality, p 1-22.SSSA, Pub 35, 1994.
[24] Eswaran, H., Beinroth, F.H., Reich, P.F., and Quandt, L.A.,. Soils: their properties, classification, distribution and management. NRCS, 1999.
[25] Fritton, D.D., and G.W., Olson., Bulk density of fragi pan soil in natural and distributed profiles, SSSA, proc, 1972, 36,686-89.
[26] Herrick, J.E., soil quality an indication for sustainable land management, Applied soil ecology, 2000, 15, 75-83.
[27] Hrinink, J.T.M., Soil requirements for use in urban environments, Soil till, Res, 1998, 47, 157-162. [28] Karlen, D.L., Eash N.S., and Unger, P.W., Soil and crop management effects on soil quality indicators,
AJAA, 1992, 7, 48-55.
[29] District Census Handbook of Nellore, Directorate of Census Operations, Andhra Pradesh, Census of India, 1991.
[30] APHA, AWWA, WPCF, Standard Methods for the Examination of Water and Wastewater, 20th edition, American Public Health Association, Washington DC, New York, 1998.
[31] Abassi, S.A., Water quality indices: state –of-the art, Journal IPHE, 1999, 21, 22-25.
[32] Larson, W.E., and Pierce, F.J., Construction and enhancement of soil quality, SSSA, 1991, 35, 176. [33] Nyle C.Brady., The nature and properties of soils, 12th edition, EEE, Prenctic-Hall, 2002.
[34] Parr, J.F., Papendic, R.I., Hornic, S.B., and R.E., Mayer, Soil quality, Attributes and relationship to alternative and sustainable agriculture, AJAA, 1992, 7, 5.
[35] Ramakrishnan, S.S., and Guruswamy, V., GIS applications in soil data analysis, Journal of environmental quality, 2000, 25, 433-439.
Figure 2
Figure 3
Figure 4