DOI:10.21276/ijprhs.2018. 2018. 02.31
Gandhi S and Rathi M CODEN (USA)-IJPRUR, e-ISSN: 2348-6465
Original Article
Development and Validation of Stability Indicating
HPLC Method for Estimation of Dapsone
Santosh V Gandhi
*, Madhuri S Rathi
AISSMS College of Pharmacy, Kennedy Road, Near R. T. O., Pune 411001, Maharashtra, India
A R T I C L E I N F O A B S T R A C T
______
1. INTRODUCTION
Dapsone (DAP) chemically bis (4-aminophenyl) sulphone is an antibiotic commonly used in combination with rifampicin and clofazimine for the treatment of leprosy1. It is a second-line medication for the treatment and prevention of pneumocystis pneumonia and for the prevention of toxoplasmosis in those who have poor immune function. Additionally, it has been used for acne, dermatitis herpetiformis and various other skin conditions2. Literature survey reveals that few analytical methods have been reported for the estimation of Dapsone in pharmaceutical
International Journal of Pharma Research and Health Sciences
Available online at
www.pharmahealthsciences.net
Received: 20 Mar 2018
Accepted: 12 Apr 2018 Objective:reverse phase high performance liquid chromatography (RP-HPLC) method for estimation ofThe aim of the present study was to develop a validated stability indicating Dapsone. Experimental approach: An isocratic, RP-HPLC method was developed using neosphere C18(150 x 4.6 mm, 3.5 μm) column using 10 mM ammonium acetate buffer (pH 3) and methanol (60:40 v/v) as mobile phase at flow rate of 1 ml/min at detection wavelength of 295 nm.Findings and discussion:The retention time (RT) of drug was 4.3 ± 0.328 min. The method was validated with respect to linearity, precision, accuracy and robustness. The data of linear regression analysis indicated a good linear relationship over the range of 2-12 μg/ml concentrations with a correlation coefficient (R2) of 0.997. Dapsone was subjected to different stress testing conditions.
Conclusion: The developed method was found to be simple, sensitive, selective, accurate, and precise for analysis of Dapsone and can be adopted for routine analysis of drug in bulk and pharmaceutical dosage form.
Keywords:High performance liquid chromatography (HPLC), Dapsone, Stability indicating, Validation.
Corresponding author *
Dr. Santosh V. Gandhi Professor
dosage form including UV-Vis spectroscopy3 , high performance liquid chromatography (HPLC)2-6 and TLC4. Although reports are available on stability indicating HPLC methods, the information provided is incomplete as well as results are contrast. Hence we tried to develop stability indicating HPLC method for Dapsone. The present work describes a simple, stability indicating HPLC method for the determination of Dapsone in bulk and tablet dosage form according to ICH guidelines.
2. MATERIALS AND METHODS Reagents and chemicals
The formulation Dapsone tablets I.P labeled to contain Dapsone 100 mg was procured from local market. Methanol (HPLC grade), ammonium acetate (HPLC grade) were purchased from S.D. Fine Chemical Laboratories, Mumbai. HPLC grade water is collected at college using ELGA water purification system. Hydrochloric acid (HCl), acetic acid (CH3COOH), hydrogen peroxide (H2O2), and sodium
hydroxide (NaOH); all AR grade were purchased from Loba Chemie Pvt. Ltd., Mumbai.
Chromatographic condition
HPLC system used was JASCO system equipped with model
PU 2080 Plus pump, Rheodyne sample injection port (20 μl),
JASCO UV 2075 Plus detector and Borwin chromatography software (version 1.5). A chromatographic column neosphere C18 (150 x 4.6 mm, 3.5 μm) was used, for
separation using 10 mM ammonium acetate buffer (pH 3): methanol (60:40 v/v) as mobile phase at a flow rate of 1 ml/min and detection at 295 nm. The representative chromatogram is shown in Fig. 1.
Fig 1.: Chromatogram of Dapsone (10 µg/ml)
Preparation of 10 mM ammonium acetate buffer (pH 3) and mobile phase
10 mM ammonium acetate buffer (pH 3) was prepared by dissolving 770 mg of ammonium acetate in 400 ml of HPLC grade water. Solution is filtered through a 0.45µ m HPLC certified nylon filter. HPLC grade water was added to 950 ml and pH of the solution was checked and pH was adjusted to 3 by acetic acid. Then volume is made upto 1000ml using HPLC grade water. Mobile phase was prepared by mixing ammonium acetate buffer and methanol in the ratio of 60:40 v/v. It was then filtered and sonicated for 10 min.
Preparation of standard stock solution
Standard stock solution of drug was prepared by dissolving 10 mg of drug in 10 ml of methanol to get concentration of
1000 µ g/ml. From this solution further dilutions were made in methanol to get final concentration of 4 µ g/ml.
Selection of detection wavelength
From the standard stock solution (1000 μg/ml) further
dilutions were made using methanol and scanned over the range of 200-400 nm and the spectra was obtained. It was observed that the drug showed linear, stable and considerable absorbance at 295 nm.
Preparation of sample
solution-A tablet containing 100 mg of dapsone (Dapsone tablets I.P) was weighed and powdered. A quantity of powder equivalent to 10 mg of dapsone was transferred to a 10 ml volumetric flask containing 5ml of methanol. The mixture was ultra sonicated for 10 min and the resulting sample stock solution was filtered with Whatman filter paper 41 and the volume was made up with the methanol to get concentration of 1000 µ g/ml. Further dilution was done to get concentration (4 µ g/ml).
STRESS DEGRADATION STUDIES OF BULK DRUG7:
Stability studies were carried out to provide evidence on how the quality of drug varies under the influence of a variety of environmental conditions like hydrolysis, oxidation, temperature, etc. Dry heat and photolytic degradation was carried out in the solid state.
Alkaline hydrolysis
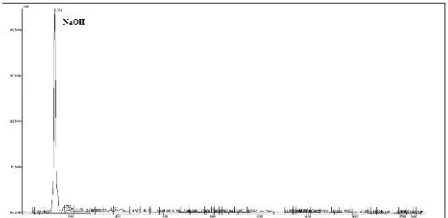
Alkaline sample was prepared by taking 1ml of drug stock solution (1000 µ g/ml) and 1ml of 2.5N methanolic NaOH in a 10ml volumetric flask. The drug was insoluble in NaOH hence methanol is used as cosolvent for solublization. This solution is kept at room temperature for 48 hours. Then solution is neutralized with HCl and the final dilution is made with mobile phase to get the concentration of 10 µ g/ml. Alkali degradation blank is prepared in the same way without using analyte. Under alkaline hydrolysis, percent recovery obtained for dapsone was 30.16% with no peak of degradant. The representative chromatograms are shown in Fig. 2 and Fig. 3.
. Fig 3: Chromatogram of DAP after alkaline degradation.
Acid hydrolysis
Acid sample was prepared by taking 1ml of drug stock solution (1000 µ g/ml) and 1ml of 5 N HCl in a 10ml volumetric flask. This solution is kept for 48 hours at room temperature. Then solution is neutralized with methanolic NaOH and the final dilution is made with mobile phase to get the concentration of 10 µg/ml. Acid degradation blank is prepared in the same way without using analyte. Under acid hydrolysis, percent recovery obtained for dapsone was 48.23% with peak of degradant (D1) at 13.507 min. The
representative chromatograms are shown in Fig. 4 and Fig.5.
Fig 4: Chromatogram of blank after acid degradation.
Fig 5: Chromatogram of DAP after acid degradation.
Degradation under oxidative condition
Oxidation sample was prepared by taking 1ml of drug stock solution (1000 µ g/ml) and 1ml of 30% H2O2 in a 10ml
volumetric flask. This solution is kept for 48 hours at room temperature. Then the final dilution is made with mobile phase to get the concentration of 10 µ g/ml. The blank is prepared in the same way without using analyte. Under oxidative degradation, percent recovery obtained for dapsone was 53.05% with no peak of degradant. The representative chromatogram is shown in Fig. 6 and Fig 7.
Fig 6: Chromatogram of blank after oxidation with 30% v/v H2O2
Fig 7: Chromatogram of DAP after oxidation with 30% v/v H2O2
Degradation under dry heat
Dry heat study was performed by keeping drug sample in oven (800 C) for a period of 48 hours. A sample was withdrawn after 2 days, dissolved in methanol to get solution of 1000 µ g/ml and further diluted with mobile phase to get 10 µ g/ml as final concentration and was injected. Under dry heat degradation condition, percent recovery obtained for dapsone was 84.77% with no peak of degradant. The representative chromatogram is shown in Fig. 8.
Fig. 8: Chromatogram of DAP after dry heat degradation.
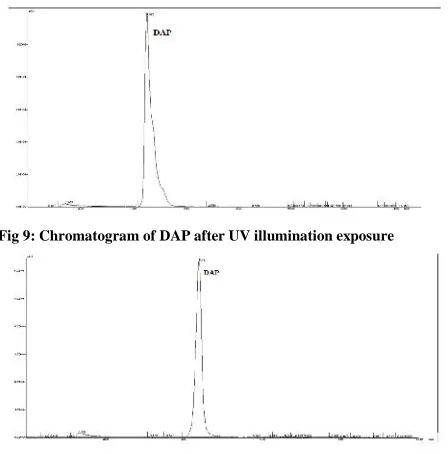
Photo-degradation studies:
dapsone was recovered with no peak of degradant after exposure to fluorescence light. Although colour change was seen from white to light brown, no peak of degradant was found. The representative chromatogram is shown in Fig.9 and Fig 10, respectively.
Fig 9: Chromatogram of DAP after UV illumination exposure
Fig. 10: Chromatogram of DAP after fluroscent light exposure
VALIDATION OF ANALYTICAL METHOD8: Specificity
The specificity of the method was ascertained by peak purity profile studies. The peak purity values were found to be more than 997, indicating the no interference of any other peak of degradation product, impurity or matrix.
Linearity
From the standard stock solution (1000 μg/ml) of dapsone, solution was prepared containing 100 μg/ml. This solution
was further used to prepare range of solution containing six different concentrations. The linearity (relationship between peak area and concentration) was determined by analyzing six solutions over the concentration range of 2-12 µ g/ml, the equation of calibration curve was found to be y = 16494x + 23697. The peak area of drug was plotted against the corresponding concentrations to obtain the calibration curve as shown in Fig. 11
Fig.11: Linearity curve of DAP (2-12 µg/ml)
Precision
The precision of the method was demonstrated by intra-day and inter-day variation studies. In the Intra-day studies, 3 replicates of 3 different concentrations were analyzed in a day and percentage RSD was calculated. For the inter day variation studies, 3 different concentrations were analyzed on 3 consecutive days and percentage RSD was calculated. The results obtained for intraday and inter day variations are shown in Table 1.
Table 1: Intraday and Interday variation studies data for Dapsone Conc.
(µg/ml)
Intra-day precision Inter-day precision Avg. area % RSD Avg. area % RSD
4 699397.4 0.531 697482.9 0.550
6 949942.4 0.641 953629.5 0.233
8 1337777 1.775 1315719 1.069
Limit of detection (LOD) and limit of quantitation (LOQ)
From the linearity data the LOD and LOQ was calculated, using the formulaLOD = 3.3 σ/S and LOQ = 10 σ/S where, σ = standard deviation of the y intercept of linearity
equations and S = slope of the calibration curve of the analyte. LOD was found to be 0.067μg/ml. LOQ was found
to be 0.204μg/ml.
Assay
A tablet containing 100 mg of dapsone (Dapsone tablets I.P) formulation analysis was carried out as mentioned under section preparation of sample solution. Procedure was repeated for six times. Sample solution was injected and area was recorded. Concentration and % recovery was determined from linear equation. The results obtained are shown in Table 2.
Table 2: Assay of marketed formulation Sr. No. Peak Area Amount
Recovered
(μg/ml)
%Recovery Mean ± % RSD
1 679401.5 3.975 99.381
99.709 ± 0.945
2 675685.8 3.952 98.817
3 681312.9 3.986 99.670
4 692969.3 4.057 101.437
5 676918.8 3.960 99.004
6 683135.7 3.997 99.947
Accuracy
To check accuracy of the method, recovery studies were carried by spiking the standard drug to the Dapsone tablets I.P containing 100 mg of dapsone sample solution, at three different levels around 50, 100 and 150 %. Basic concentration of sample solution chosen was 4 µ g/ml. % recovery was determined from linearity equation. The results obtained are shown in Table 3.
Table 3: Accuracy of Dapsone Level% Sample
(μg/ml)
Standard
(μg/ml)
%Recovery (Mean ±%RSD)
50 4 2 99.498 ± 0.535
100 4 4 99.871 ± 0.935
Robustness-Robustness of the method was checked by carrying out the analysis under conditions during which mobile phase composition (± 2% Composition), detection wavelength (± 2 nm), flow rate (± 0.05 ml/min) were altered and the effect on the area were noted. Robustness of the method checked after deliberate alterations of the analytical parameters showed that areas of peaks of interest remained unaffected by small changes of the operational parameters indicating that the method is robust.
3. RESULTS AND DISCUSSION
The developed method was found to be simple, sensitive, specific, accurate, and repeatable for analysis of Dapsone in bulk and pharmaceutical dosage form without any interference from the excipients. The results indicated the suitability of the method to study stability of Dapsone under various forced degradation conditions. Summary of validation parameters is represented in Table 4.
Table 4 : Summary of Validation Parameters
Sr. No.Validation
parameters Dapsone
1.
Linearity equation R2
Range
y =16494x + 23697 R2
= 0.997 2-12 µg/ml
2.
Precision (%RSD)
Intraday 0.982
Interday 0.617
3. Assay 99.709 ± 0.945
4.
Accuracy Mean ± %RSD
50 99.498 ± 0.535
100 99.871 ± 0.935
150 100.522± 0.825
5. Limit of detection 0.067 µg/ml 6. Limit of quantitation 0.204 µg/ml 7. Specificity Specific
8. Robustness Robust
4. CONCLUSION
A simple, precise, accurate, reproducible and stability indicating HPLC method without interference from the excipients or from degradation products has been developed and validated for the determination of Dapsone as bulk drug and in tablet dosage form. The developed method can be used for quantitative analysis of Dapsone in pharmaceutical dosage form. The method was developed by using easily available and cheap solvents for analysis of drug hence can be considered as economic.
5. ACKNOWLEDGEMENT
Authors are thankful to the Principal and Management, AISSMS College of Pharmacy, Pune for providing required facilities for research work.
6. REFERENCES
1. Govt. of India Ministry of Health and Family welfare,
2. Kaila, Nitin. Dapsone: Formulation development and stability testing of extemporaneous suspension prepared from dapsone tablets at the medical dictionary from international journal of pharmaceutical compounding 5/1/03. Page no. 1-5.
3. Sarsam LA. Spectrophotometric and high performance liquid chromatographic methods for the determination of dapsone in a pharmaceutical preparation, Rafidain journal of sciences. 2013; 24(1): 128-145.
4. Salama N, Ries M, Toubar J, Hamide M, Walash M. Validated TLC and HPLC stability indicating methods for the quantitative determination of dapsone, Journal of planar chromatography- Modern TLC. 25(1). 65–71 5. Colome LM, Freitas GM, Bastiani JM, Pereira TCB,
Bajerski L, Bender EA, Haas SE. Validation of analytical method by HPLC for determination of dapsone in polymeric nanocapsules based on crude rice brain oil. J App Pharm Sci, 2017; 7 (07): 230-233. 6. Afshar M, Navidpour L, Beheshti-Maal L.An
ecofriendly and stability indicating RP-HPLC method for determination of dapsone: Application to pharmaceutical analysis, Chiang Mai J Sci. 2016; 43(3):620-629.
7. ICH guidelines, for stability testing of new drug substances and products Q1A (R2), 2004.
8. ICH guidelines for validation of analytical procedures: text and methodology Q2 (R1) 2005
Conflict of Interest: None