An Efficient Routing Algorithm for Tolerant
Systems based on Mobility
Mr. L. Manjunath Associate Professor
Department of Electronics & Communications Engineering CVR College of Engineering, Hyderabad
Abstract
The paper gives an efficient algorithm for routing based on the usage of the node mobility in the Disruptive Tolerant systems (DTS). DTS are featured by lack of a continuous path between the start node and the end node, which may be temporarily or permanently present. The information is conveyed by transmitting the information by intermediate nodes based on store-carry-forward mechanism. Our algorithm is based on the capability to use the information about mobility of nodes and respective contacts of the nodes. Our work is based on the assumption that higher node mobility will result in higher number of contacts with other nodes and higher probability in sending information to the destination. Our proposed algorithm was simulated using The One simulation tool. Finally we differentiate the performance parameters of our algorithm with other famous algorithms used for routing.
Keywords: Delay & Disruption tolerant Systems, MANETs, Wireless communication, routing protocols, Mobile networks ________________________________________________________________________________________________________
I. INTRODUCTION
Internetwork over the period of time has achieved a large success in the communication between devices. The predominant reason for this success is because of the usage of uniform sets of protocols by all users connected in the networks. The devices connected to the Internetwork use protocols which belong to the TCP/IP protocol stack. The communication in an Internetwork is based on several assumptions, like the existence of a continuous, both-way path connecting the source and destination nodes in order to allow end-to-end communication. In spite of the huge success of these networks, they cannot be adapted to any environmental condition due to the budget associated with setting up of the necessary infrastructure, as well as the specifics of the environment which can be characterized by the large delays, interruptions in the transmissions, limited buffer, and energy resources of nodes.
Delay and Disruptive Tolerant Systems (DTS) can be featured by the lack of the probability of establishing a path between any pair of nodes at the time. In the DTS, communication uses store-carry-and-forward mechanism. This is implemented by using nodes physically carrying information called information ferries or information mules.
DTS provides the ability to share communication in specific situations. Examples of common applications are ability to exchange information in rural areas in India and other regions where there are no fixed network infrastructure[1],virtual warning signs[2] assuming the possibility of warning drivers about the current traffic situations, projects for the observation of wild animals[3], monitoring of the pollution of water or road noise[4], or exchanging information through inter- planetary space[5].
This research gives the option of using the mobility of carriers and contacts between mobile devices for wireless messaging. In the following sections we will be presenting sequentially the literature survey (Chapter 2), a routing protocol design using mobility feature (Chapter 3), and the results of simulation (Chapter 4). The work was briefed up in Chapter 5.
II. LITERATURE SURVEY
Works on wireless DTS are conducted exclusively focus on routing protocols.
One of the basic and most popular routing algorithms in DTS is Epidemic routing (ER) [6]. The algorithm operates on the principle of “flooding” network. The Epidemic routing node that received the information forwards it to all nodes encountered by him. The information is thus propagated through the network, so that all nodes have a copy of the sent information by the source node. This means that each information is stored in the node’s local cache. Epidemic routing algorithm provides a messaging with the minimum possible delay [7], due to the fact that there are many paths used to deliver the information. The chief disadvantage of Epidemic routing algorithm is they need a huge amount of resources such as buffer capacity, bandwidth, and energy resources of nodes.
Another routing algorithm is the Prophet [9], which is based on the assumption of non -random motion of nodes. It is also assumed that the nodes appear in some locations more often than others, and hence the probability of appearance of node in the visited locations in the past is more likely to occur in the future. Nodes maintain the probability of meeting the other nodes in the network and based on this information they communicate with more appropriate nodes, which have higher probability value. Other important works are focused on scheduling in vehicular DTS [10], multi-cast solution [11,12].
Most algorithms are based on green technology assumptions for ad hoc networks [13]. Other works are based on multilayer clusters, routing quality games, spatial reusability. To the best of knowledge, no listed works are similar to our algorithm.
III. ROUTING ALGORITHM USING MOBILITY OF NODES
The main objective of DTS routing algorithm is to obtain a large rate of delivered information, while maintaining low overhead. The algorithms such as Epidemic Routing or Prophet can reach a high percentage of delivered information but at the cost of a very huge number of sent information that cause high overhead. Algorithms such as Spray and Wait and Spray and Focus enable the reduction of overhead information but do not reach such a high probability of deli very.
Presented in our research, the replication algorithm achieves high probability of information delivery while maintaining low overhead. The improvement introduced in this algorithm is based on noticing and using the properties of the network whereby the greater mobility of nodes is associated with a higher probability of meeting another node, greater coverage of network expansion, which results in better propagation of sent information. This characteristic can involve many different networks; it appears to be particularly important in an urban environment, where multiple nodes move: people who are owners of mutually exchanging information with each other, smart- phones, and vehicles such as cars, buses, and trams equipped with the appropriate communication interfaces.
The day to day routine of humans is rather schematic; he/she gets up in the morning, at a specified time, and leaves the home, and then goes to workplace by foot, car, or by using other public transport. Then, usually a person spends a particular period of time at workplace, then returns home by chosen way of transport. In the evening, people may go shopping, go out to meet companions, enjoy the music, read books, or remain in their houses. The above mentioned activity in the majority of cases can be assigned to a large part of society. It is repeated periodically, every day.
It should be noted that this can contribute to the prediction of human activity in the daytime. To determine the level of activity, there is a need to specify how much mobile node is in a certain period of time. It has been assumed that the nodes in the network are aware of their speed. To determine the speed of a node in a given period of interval, GPS can be used. Another solution may be an application that recognizes human activity using a smart phone contained or worn in the pocket. As mentioned previously, our algorithm uses replication. It restricts the number of information in the network, so that it becomes possible to reduce the use of network resources. Routing algorithm makes decisions about relaying information to the other nodes based on the mobility, sending information to the nodes that will show greater mobility in the coming future. Information about the mobility of a node is the local metric of each node. It is calculated as a weighted moving average (WMA) with instantaneous speed node samples taken from a rate of one minute according to the formula:
WMA = np0+ (n-1) P1+…+ Pn-1 (1)
n + (n-1) +…+ 2+1
WMA assigns different weights to the data from individual periods. In the formula, p0 is the last value which assigned weight is n.
The weighted moving average is evaluated for each hour of the movement in the day separately, so we can get a level of mobility of a movement at different periods of the day, which can change over the day time.
Each node depending on its current and future mobility has been assigned one of three mobility classes: (a) the first class: the least mobile nodes, e.g., people walking; (b) the second class: nodes having an average mobility, for example cyclists, people jogging; (c) the third class: the nodes, which are highly mobile, e.g., moving vehicles.
The nodes are not statically assigned to the mobility class; depending on changes in its mobility in certain periods of the day, assigned class may change.
Algorithm:
information and assign this packet half the number of replicas. The source node also reduces the number of replicas of the information by half. Otherwise, the information is not passed to encountered node.
Based on the how many replicas are assigned to the packets, a node may be able to transmit the information many times
& for each time it assigns only half the current number of replicas to the information. At a given point of time, there may exist a situation where in a given node has only one replica assigned to given information. From that instant of time, when sending information in addition to the node mobility class, the nodes encountered previously are also taken into account. The logic is to select relay node that encountered destination node of the information. Each node maintains the data about which nodes met in the past. If the time elapsed since the last meeting a pair of nodes is greater than the length of the time wind ow, then information about their encounter is lost.
Algorithm:
if NodeY is within the transmission range of NodeX then Update meeting NodeY by NodeX in the local table of met nodes for all information Zi in the local buffer of node X do
if the number of replicas of information zi> 1 then
if the mobility class of node X==1 then if mobility class of node Y > 1 then
assign zi information half of the information replicas and send it to node Y
end if
else if mobility class of node Y > = mobility class of node X then
assign zi information half of the information replicas and send it to node Y
end if
else if the information zi was not sent yet then
else if Node Y has the id of the recipient Node of the information zi then
send xi information to the Node Y
end if end if end for end if
IV. SIMULATIONS
In this unit, we study and compare the performance of the proposed algorithm with three popular routing algorithms: Epidemic [19], Spray and Wait [21], and the Prophet [22]. The simulations were carried out using the tool “Simulator The One”. At the starting, we will be describing the mobility model and parameters used for the simulation followed by the results of simulation.
Mobility Model:
In the performed simulations, we used the city map of a town called Kurnool in Andhra Pradesh of India, about the size of
8,000 × 6,000 m2. In order to be more realistic in the simulation, we selected Working Day Movement (WDM) model of
mobility. Simple models such as Random Walk, Random Way point, or more complex Random Map Based Movement does not reflect such features as the relationship between the carriers which maybe human being or their repeated behavior.
The Working Day Movement model makes the movement of nodes even more realistic. In this model, the movement assumes
that human beings–carriers move in accordance with specific routines, e.g., walking to work, shopping. Thanks to this node which often meets with a specific group. The node is not able to meet on their way all nodes due to its mo tion introduced locality. Workplace, location of the home in which the human resides makes that node movement, often limited to visit certain locations.
WDM model divides its simulation time for days; within every day, there are three node following activities: (1) home activity, (2) Activity related to Workplace and (3) Refreshing activities such as amusement and enjoyment.
The three above listed activities varies proportionately and can have individual character for various groups of people. However, these are the activities which can be attributed to the typical day of a huge number of people.
Simulation Parameters:
The behavior of the nodes has been further diversified by setting up different hours of the morning node’s waking up. Nodes leave their homes between the 6 and 13.The working time was set at 25,200 seconds (7 hour). Break time in office has the Pareto distribution, a factor of 0.5 and its minimum value is 10 seconds. Office is the are a of the square size of 100 × 100 m. Each node may perform the evening activity with a possibility equal to 0.5; the size of the groups during the evening activity is from one to three nodes. The nodes are equipped with a Bluetooth radio interface. The B uses have large speed radio interfaces of 10MbPS and 100 metres range.
Table – 1 Simulation parameters Parameters Description Simulation area 8,000m×6000m Number of nodes 600
Radio range 10m,100m Buffer space 1 Mb, 50Mb Packet payload 1–200Kb
TTL 1 day
Simulation Results:
Each simulation is repeated several times to achieve more accurate and independent from the initial position of nodes results. The simulations are performed with different grain generator, and the same configuration is repeated for different routing algorithms. The results are estimated with the 95 % confidence intervals. Comparing the effectiveness of simulated algorithms is taken into account the following criteria: probability of information delivery, efficiency, overhead ratio, number of hops, and average delay.
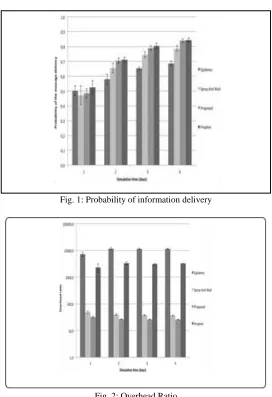
Figure 1 shows the dependence of the probability of delivery of information to the length of simulation time. For all algorithms with time increase, the probability of information delivery also increases, the maximum value is reached after a simulated 4 days. After the first day of the simulation, all algorithms obtain similar results, which change over time. In the case of the Epidemic routing, the lowest probability is probably connected with buffer overflows as a result of the transmission of the information to all nodes encountered, causing rejecting new information. The proposed algorithm and the Prophet exceed a threshold of about 80 % delivered information after 4 days of simulation.
Overhead ratio is interpreted as the number of relayed information needed to deliver single information to the destination node. The results for the overhead ratio of different algorithms are shown in Fig. 2. Algorithms Epidemic routing and Prophet have high overhead ratio.
The proposed algorithm achieves the best performance among all algorithms. The overhead ratio is lower than the Spray & wait, which reduces the number of transmissions. The number of replicas assigned to each created information in the Spray and Wait in the simulation is 32. The proposed algorithm assigns information 16 replicas for nodes belonging to the first mobility class, 8 replicas for nodes belonging to the second class, and one for the third class.
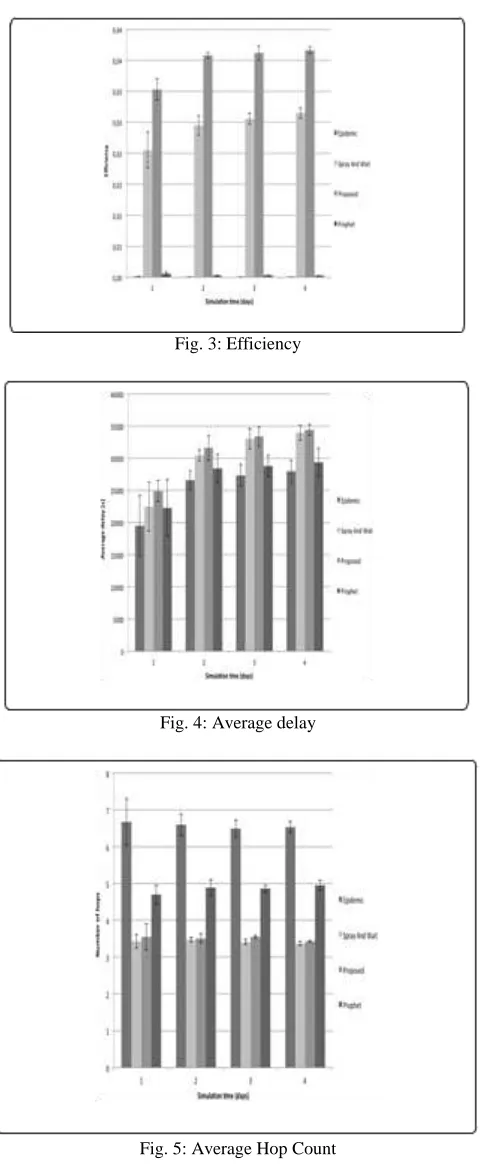
Number of information sent by the nodes in the network can have a big impact on the probability of information de- livery. Unfortunately, a large number of information sent is associated with greater overhead ratio, these two metrics are dependent on each other. It would be good to know how information that are sent by the nodes affect the number of delivered information. Therefore, we introduced a new metric defined as the efficiency of the algorithm. Efficiency is the ratio of the number of the information delivered to the number of all transmissions of the information. The results of the efficiency of the tested algorithms are shown in Fig. 3. As the graph shows, the proposed algorithm achieves the highest degree of efficiency. A high value has also Spray and Wait. The lowest value has Epidemic routing because of the very large number of transmissions. Prophet algorithm, which reached a very high probability of information delivery, also due to the large number of transmissions has a very low efficiency
Average delay is the average time that elapses from the creation of information until its delivery. The simulation results of the average delay of delivery of information are shown in Fig. 4. As expected, the lowest value achieves Epidemic routing, thanks to the fact that an information is quickly and repeatedly copied on the network, resulting in greater opportunity to reach the destination node. Prophet gets higher than Epidemic delay but lower than Spray and Wait, and the proposed algorithm. A high average delay of Spray and Wait and the proposed algorithmic likely due to their strong reducing the amount of network transmissions, so the information is relayed by a smaller number of nodes, extending the time of delivery to the destination node.
Hop count metric determines the number of hops from the source and the destination node. This repre- sents also transmission cost, telling how many nodes are on average involved in delivering the information. Results of the simulation are shown in Fig. 5. The highest number of hops has Epidemic routing, due to copying information to all nodes encountered. A large number of the trans- missions because the Prophet algorithm to have a high value of hop count metric, but lower than Epidemic routing. Spray and Wait and the proposed algorithm have very similar, low value of the number of hops.
V. CONCLUSIONS
bandwidth, or storage? Excessive use of resources can lead to overloading and thus rejecting packets. In our work, we showed that by sending a small number of information addressed to the selected nodes, we can get good results in social DTS. The proper Selection of nodes in the proposed algorithm is based on the features of mobility of nodes and contacts between nodes.
Our Algorithm selects nodes, which have a larger mobility, thus increasing the probability of encountering larger number of nodes, including the destination node of the information. Another factor to consider when transmitting information is contacts between nodes. In the second phase of the algorithm, there are selected nodes, which have been in contact with the destination node of the information in the recent past. Our simulation results showed that the proposed algorithm achieves better results of overhead ratio and effectiveness, with comparable or greater probability of information delivery in relation to other algorithms such as Epidemic routing, representing the technique of “flooding” Spray and Wait, which is an example of limited replication algorithms and the Prophet representing a group of probabilistic algorithms.
VI. SIMULATION GRAPHS
Fig. 1: Probability of information delivery
Fig. 3: Efficiency
Fig. 4: Average delay
Fig. 5: Average Hop Count
REFERENCES
[1] A Pentland, R Fletcher, A Hasson, DakNet: rethinking connectivity in developing nations. Computer, IEEE Publishing Society, 78–83 (2004).
doi:10.1109/MC.2004.1260729
[2] C Maihöfer, R Eberhardt, Time-stable geocast for ad hoc networks and its application with virtual warning signs. Comput. Commun. 27(11), 1065–1075
(2004). doi:10.1016/j.comcom.2004.01.024
[3] P Juang, H Oki, Y Wang, M Martonosi, LS Peh, D Rubenstein, and Energy-efficient computing for wildlife tracking: design tradeoffs and early experiences
with ZebraNet. Proceedings of the 10th international conference on Architectural support for programming languages and operating systems, 2002, pp. 96– 107. doi:10.1145/605397.605408
[4] P McDonald, D Geraghty, I Humphries, S Farrell, V Cahill, Sensor networking with delay tolerance. Proc. 16th Int. Conf. Comput. Commun. Netw, 2007,
[5] S Burleigh, A Hooke, L Torgerson, K Fall, V Cerf, B Durst, K Scott, H Weiss, Delay-tolerant networking: an approach to interplanetary internet. IEEE Commun. Mag., 128–136 (2003). doi:10.1109/MCOM.2003.1204759
[6] A Vahdat, D Becker, Epidemic routing for partially connected ad hoc networks. Technical Report, Raport CS- 200006 (Duke University, Durham, 2000)
[7] X Zhang, G Neglia, J Kurose, D Towsley, and Performance modeling of epidemic routing. Computer Networks: The International Journal of Computer and
Telecommunications Networking 51, 2867–2891 (2007). doi:10.1016/j.comnet.2006.11.028
[8] T Spyropoulos, K Psounis, CS Raghavendra, Spray and wait: an efficient routing scheme for intermittently connected mobile networks. Proceedings of the
2005 ACM SIGCOMM workshop on Delay-tolerant networking, 2005, pp. 252–259. doi:10.1145/1080139.1080143
[9] A Lindgren, A Doria, O Schelén, Probabilistic routing in intermittently connected networks. ACM SIGMOBILE Mobile Computing and Communications
Review, 19–20 (2003). doi:10.1145/961268.961272
[10] Y Zeng et al., Directional routing and scheduling for green vehicular delay tolerant networks. Wirel. Netw 19(2), 161–173 (2013)
[11] P Li et al., CodePipe “An opportunistic feeding and routing protocol for reliable multicast with pipelined network coding” (INFOCOM, 2012), pp. 100–108.
doi: 10.1109/INFCOM.2012.6195456.
[12] P Li et al., Reliable multicast with pipelined network coding using opportunistic feeding and routing. IEEE Transactions on Parallel & Distributed Systems
25(12), 3264–3273 (2014)
[13] S Yuning et al., A biology-based algorithm to minimal exposure problem of wireless sensor networks. IEEE Trans. Netw. Serv. Manag. 11(3), 417–430