Optimization of Geometric Parameters for Adaptive
Wedge Brake Performance Using Central Composite
Design
Nouby M. Ghazaly
1, K. R. M. Mahmoud
2, Mostafa M. Makrahy
2, k. A. Abd El-Gwwad
2and Ali M. Abd-El-Tawwab
2 1Mechanical Engineering Dept., Faculty of Engineering, South Valley University, Qena-83523,Egypt2
Automotive and Tractor Eng. Dept., College of Engineering, Minia University, El-Minia – 61111, Egypt *Corresponding Author: E-mail: [email protected]
Abstract-- The aim of this study is to find the optimal geometric parameters of the wedge disc brake performance using experimental and statistical studies. A standard response surface methodology called central composite design is applied to study four geometric parameters each with three levels. A total of thirty experimental tests are run using the brake dynamometer to evaluate the main and interaction effect of these variables namely; number of rotor holes, number of friction material slots, friction material length and friction material thickness. The variability in dependent variables is explained by coefficient of determination. The model equation is used to predict the optimum value and subsequently to clarify the interaction between the parameters within the specified range. The experimental results indicate that the proposed mathematical model successfully describes the performance of adaptive wedge brakes within the limits of the geometric parameters that are being investigated.
Index Term-- wedge disc brake; central composite design; geometric parameters; brake performance
1. INTRODUCTION
The most significant safety aspect of an automobile is its brake system, which must slow the vehicle quickly and reliably under varying conditions. There are many types of brake systems that have been used since the inception of the motor car, but in principle they are all similar. Brakes are energy-converting machine elements belonging to the class of couplings which consist of rotating parts (rotor) and stationary parts including; calliper housing with its piston and anchor bracket. The main function of brake system is to retard the vehicle by transforming the kinetic energy of the vehicle into heat by the process of friction, and this heat must be effectively and efficiently dissipating to the surroundings by the brake components [1].
The primary requirements of the brake system are performance, robustness and durability [2]. Many researchers define brake system requirements as being: (1) function (braking distance, load stability); (2) comfort (vibration & noise); (3) ergonomics (actuation force &
Much progress has been made using different numerical and experimental approaches. However, brake performance still needs much work to carry out. This is due to the fact that disc brake performance strong dependence on many parameters including materials and geometry of brake components, component interaction, many operating and environmental conditions [3-6]. The need of a new method to find out the contributions of the operating, environmental conditions structural modifications and their interactions is required. One of the earliest researchers who attempted to integrate experimental or numerical approaches with design of experiments (DOE) to assess effectively the contributions of different parameters and their interaction was nouby et al. [6-12].
Response surface methodology (RSM) based on DOE is the most used statistical technique for determining the relationship between various input parameters and output responses [13-15]. RSM is a collection of mathematical and experimental techniques that requires sufficient number of experimental data to analyse the problem and to develop mathematical models for several variables and output performance characteristics. The main advantage of RSM is the reduced number of experimental trials needed to evaluate multiple parameters and their interactions. It is often employed to fit a polynomial model to the given data and to obtain the optimal factors [14,15]. RSM has an important application in the process design and optimization as well as the improvement of existing design. This methodology is more practical compared to theoretical models as it arises from experimental methodology which includes interactive effects of the variables and eventually it depicts the overall effects of the parameters on the process. There are several types of RSM designs include full factorial designs, central composite design (CCD) and Box- Behnken design (BBD). Many books and papers discussing various techniques of RSM have been published in [16-19].
of thirty experimental tests are run using brake dynamometer to evaluate the main and interaction effect of these variables namely; number of rotor holes, number of friction material slots, friction material length and friction material thickness. The variability in dependent variables is explained by the coefficient of determination (R2) and the model equation is used to predict the optimum value and subsequently to clarify the interaction between the parameters within the specified range.
2. CENTRAL COMPOSITE DESIGN
For developing an adequate relationship between input parameters and output performance characteristics, RSM has been employed. CCD is an example of an RSM that is widely used for fitting a second-order response surface. CCD has been described as a statistical technique that is widely used for the optimization approaches. A regression analysis is performed in order to describe the data collected whereby an observed, empirical variable (response) is approximated based on a functional relationship between the desired responses (Y) and one or more independent input variables (xi). The least square technique is being used to fit a model equation containing the input variables by minimizing the residual error measured by the sum of square deviations between the actual and the estimated responses. The second order polynomial equation of the response has been assumed as:
∑
∑
∑
This assumed surface Y contains linear, squared and cross product terms of variables x1, x2,… …xi. The model parameters can be estimated most effectively if proper experimental designs are used to collect the data. The calculated coefficients or the model equation need to however be tested for statistical significance.
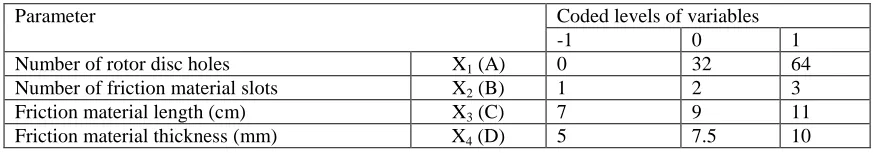
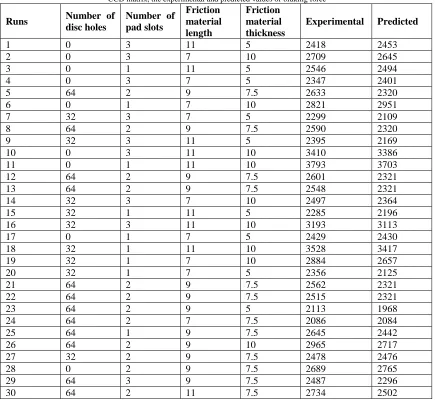
In this study, a 3-level four parameter central composite experimental design is used to identify the best combinations of the design parameters which involved in the experimental tests to obtain high brake performance. The parameters number of rotor disc holes, number of friction material slots, friction material length (cm), and friction material thickness (mm) are input variables, the parameter levels are coded as −1 (low level), 0 (central point), and 1 (high level). Independent variables and their levels for the CCD used in this study are shown in Table 1. These experiments are run according to a random sequence or run order provided by the design of experiments fractional parametrical technique. Thirty tests are performed and used to find out the relationship between braking force of the adaptive wedge disc brake and the geometric parameters using CCD according to the scheme mentioned in Table II. The actual levels of the variables for each of the experiments in the design matrix are carried out and experimental results
obtained as given in Table II.
Table I
Coded and actual values of variables of the experimental design
Parameter Coded levels of variables
-1 0 1
Number of rotor disc holes X1 (A) 0 32 64
Number of friction material slots X2 (B) 1 2 3
Friction material length (cm) X3 (C) 7 9 11
Table II
CCD matrix, the experimental and predicted values of braking force
Runs Number of disc holes
Number of pad slots
Friction material length
Friction material thickness
Experimental Predicted
1 0 3 11 5 2418 2453
2 0 3 7 10 2709 2645
3 0 1 11 5 2546 2494
4 0 3 7 5 2347 2401
5 64 2 9 7.5 2633 2320
6 0 1 7 10 2821 2951
7 32 3 7 5 2299 2109
8 64 2 9 7.5 2590 2320
9 32 3 11 5 2395 2169
10 0 3 11 10 3410 3386
11 0 1 11 10 3793 3703
12 64 2 9 7.5 2601 2321
13 64 2 9 7.5 2548 2321
14 32 3 7 10 2497 2364
15 32 1 11 5 2285 2196
16 32 3 11 10 3193 3113
17 0 1 7 5 2429 2430
18 32 1 11 10 3528 3417
19 32 1 7 10 2884 2657
20 32 1 7 5 2356 2125
21 64 2 9 7.5 2562 2321
22 64 2 9 7.5 2515 2321
23 64 2 9 5 2113 1968
24 64 2 7 7.5 2086 2084
25 64 1 9 7.5 2645 2442
26 64 2 9 10 2965 2717
27 32 2 9 7.5 2478 2476
28 0 2 9 7.5 2689 2765
29 64 3 9 7.5 2487 2296
30 64 2 11 7.5 2734 2502
3. EXPERIMENTAL TECHNIQUE
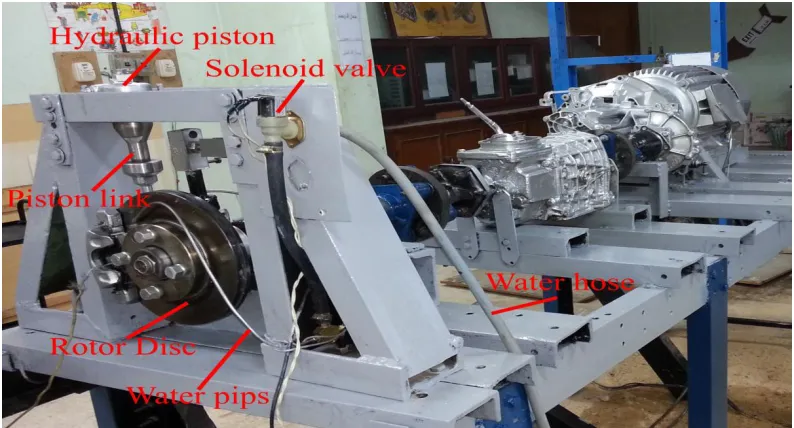
The brake test rig is designed and developed to provide the necessary disc rotation speed, applied pressure; wedge angle and quantity of water spray to evaluate the performance of the wedge disc brake system under different geometric modifications, as shown in Figure 1. The rotational speed is measured using tachometer at 6, 11.6, 22.6 and 36.3 km/hr. of vehicle speeds. The applied pressure in the range 2.5
Fig. 1. Test rig of the adaptive wedge disc brake
4. RESULTS AND DISCUSSION
The results obtained from the brake test rig of the output brake performance are performed as per the experimental plan are shown in Table 2. The statistical software package Minitab is used to generate the experimental CCD matrix, analyze the experimental data and develops the regression model. The quality of fit of the regression model
expressed as the coefficients of determination (R2), the
statistical significance determined by Fisher‟s F test, p-value,
(ANOVA) the response surface and the surface plots are all
study to estimate the model as well as to determine the regression model for further analysis as the following:
4.1 Analysis of variance
Analysis of variance (ANOVA) is applied on the experimental data to select the adequate model. This test is performed as the ANOVA procedure by calculating F- and
p-values, which F-value is the ratio between the regression mean square and the mean square error. To evaluate the goodness of the model the adequacy (statistical significance) of a quadratic model is tested through F- and p-values. It has long been known that a large F-value indicates that most of the variation can be explained by a regression equation whereas a low p -value less than 0.05 indicate that the model is considered to be statistically significant. This ratio is used to measure the significance of the model under investigation with respect to the variance of all the terms included in the error term at the desired significance level.The results of ANOVA for braking
forces from input parameters are given in Table 3. The terms having p-value less than 0.05 are considered to be significant. From Table 3, it can be seen that P value of all parameters has an effect on the brake force. C, D, CD, and BD indicated a significant effect of the independent parameters on the output response. This implies that the main effect of the friction material thickness (D), the friction material length (C), interaction between friction material thickness and friction material length (CD), interaction between friction material thickness and friction material length (BD) are the most significant parameters.
4.2 Coefficient of Determination
Additionally, checks need to be made in order to determine whether the model actually describes the experimental data. The checks performed here include determining the various coefficient of determination, R2. These R2 coefficients have values between 0 and 1. As shown in Table 4, the goodness of the modelcan be confirmed by the coefficient of determination R2(95.92 %) and the adjusted R2
Fig. 2.Correlation between predicted and experimental values of braking force
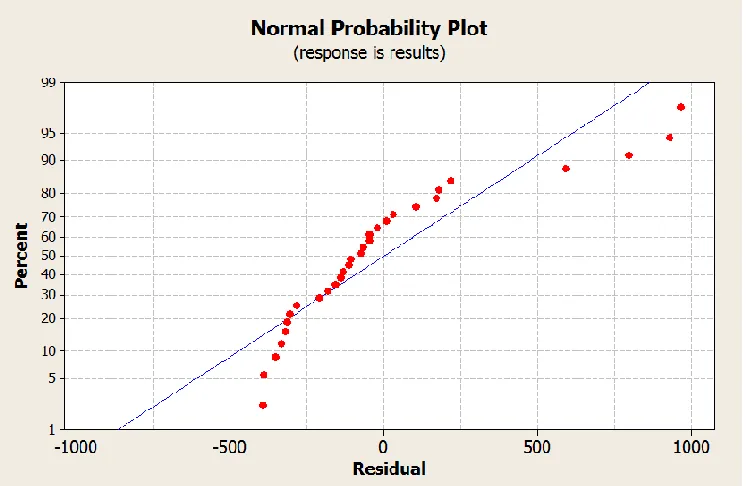
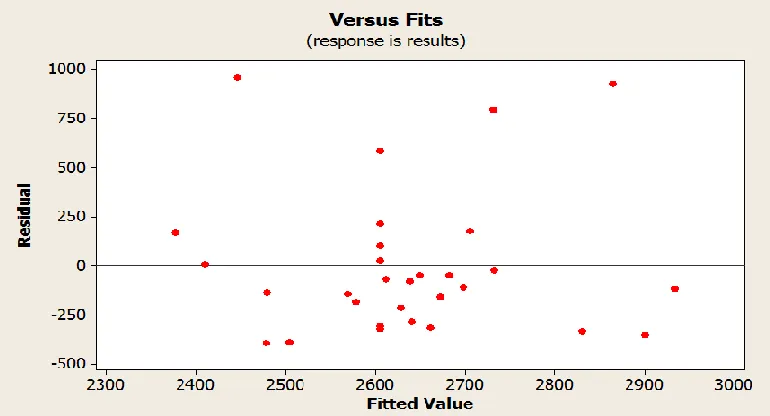
4.3 Normality Plot of Residuals
In addition to the above, the adequacy of the model is also investigated by the examination of residuals. The residuals, which are the difference between the respective, observe responses and the predicted responses are examined using the normal probability plots of the residuals, as shown in
Figure 3 and the plots of the residuals versus the predicted response, as shown in Figure 4. If the model is adequate, the points on the normal probability plots of the residuals should form a straight line. On the other hand the plots of the residuals versus the predicted response should be structureless, that is, they should contain no obvious patterns.
Fig. 3. Normal probability plots.
y = 1.0129x - 160.01
1500 2000 2500 3000 3500 4000
1800 2300 2800 3300 3800 4300
P
re
dicte
d
R
esponse
Fig. 4. Plots of the residuals versus the predicted response.
Table III
ANOVA for the model of braking force
Source DF Seq SS Adj SS Adj MS F P Significant
Regression 14 4259229 4259229 304231 25.2 0.000
Linear 4 3653529 2826138 706535 58.51 0.000 Significant
A 1 260293 67372 67372 5.58 0.032 Significant
B 1 130268 100577 100577 8.33 0.011 Significant
C 1 833483 687238 687238 56.91 0.000 Significant
D 1 2429485 1970952 1970952 163.23 0.000 Significant
Square 4 43607 43607 10902 0.90 0.487
A*A 1 3973 12296 12296 1.02 0.329
B*B 1 22681 19055 19055 1.58 0.228
C*C 1 7881 12758 12758 1.06 0.32
D*D 1 9072 9072 9072 0.75 0.40
Interaction 6 562093 562093 93682 7.76 0.001 Significant
A*B 1 162 162 162 0.01 0.909
A*C 1 772 772 772 0.06 0.804
A*D 1 478 478 478 0.04 0.845
B*C 1 586 586 586 0.05 0.829
B*D 1 70037 70037 70037 5.8 0.029 Significant
C*D 1 490059 490059 490059 40.58 0.00 Significant
Residual Error 15 181125 181125 12075
Lack-of-Fit 10 181125 1 181125 18113
Pure Error 5 0 0 0
Total 29 4440354
Table IV R2 analysis
Std. Dev.
109.886
PRESS
1188014
4.4 Validation of Regression Model
Using the experimental data, regression equations have been developed for correlating the output performance characteristics and input geometric parameters. The Empirical relationships between the independent variables namely: number of rotor disc holes (A), number of friction material slots (B), friction material length (C), and friction material thickness (D) and the output response braking force (Y) can be explained according to the regression model. Regression analysis was performed to determine the surface response as function of second order polynomial equation. The Empirical relationships between the output response and the independent variables in terms of coded parameters have been expressed by the following polynomial equation.
………... ... [1]
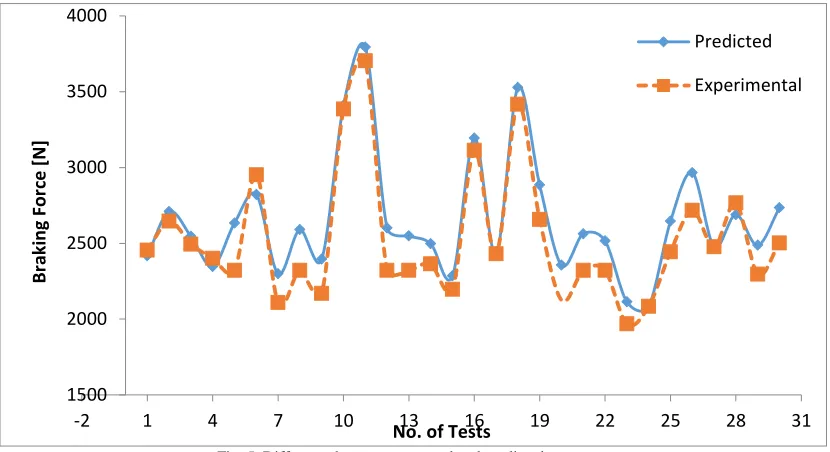
The predicted levels of braking force using Equation 1 are given in Table 2 along with experimental data. It is found that the fit of predicted versus actual experimental looks very good as shown in Figure 5.
Fig. 5. Difference between measured and predicted responses
4.5 Validation of the experimental model
In order to confirm the validity of regression equation, different combinations predicted by the point prediction feature of the statistical software Minitab are used to validate the CCD model developed. Nine combinations of the four independent variables are experimented and the observed results are compared with the predicted results. The error analysis is computed to determine the closeness between the
predicted and the observed results. It is found that the difference between the predicted results using the regression equation and experimental as shown in Table 5. It is also found that predicted responses show good agreement with actual results. The average absolute percentage deviation is found to be 7.71%. This indicates that designed model space can be navigated for prediction.
Table V
Difference between predicted and experimental results
Runs no of Disc holes Pad slots Pad length Pad thickness Results Predicted Deviation
1 0 1 11 10 3293 3703 -12.46
2 0 2 9 7.5 2539 2765 -8.92
3 0 3 7 5 2103 2401 -14.17
4 64 1 9 5 2213 2020 8.74
1500 2000 2500 3000 3500 4000
-2 1 4 7 10 13 16 19 22 25 28 31
B
raki
n
g For
ce
[N]
No. of Tests
Predicted
4.6 3D Response Surface Plots
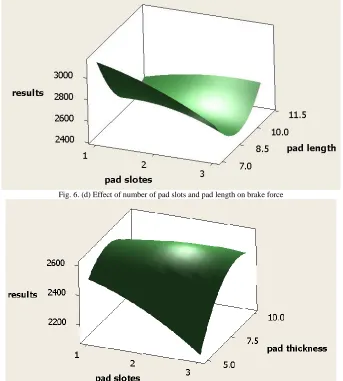
3D Surface plots of braking force that is obtained from response surface plots as a function of two parameters at a time maintaining all other parameters at a fixed level are more helpful in understanding both the main and interaction effects of the two parameters. The relationship between independent and dependent variables is graphically represented by 3D response surface generated by the model in Figure 6 (a, b, c, d, e and f) as the 3D response surface plots. The surface plots showing the effect of input parameters taken two at a time on brake force are shown in the following:
The effect of number of disc holes and number of friction material slots on brake force is shown in Figure 6 (a). The results indicate that the brake force increases with the decrease of the number of friction material slots. The increase of number of disc holes firstly, cause a decrease in the brake force then, the brake force tends to increase. From the results shown in Figure 6(b), it can be seen that the increase of the friction material length increases the brake force. The brake
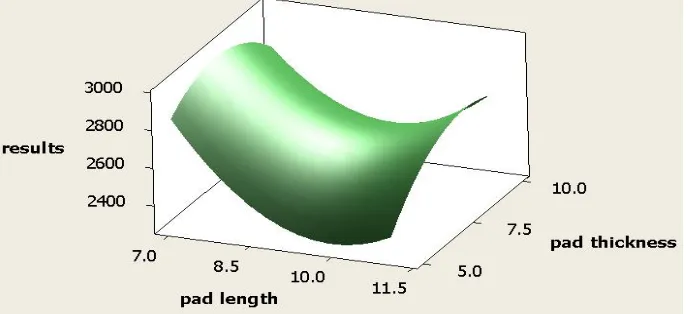
force decreases with the number of disc holes increase and it tends to increase again. The results of Figure 6(c), illustrate that the increase of the friction material thickness has an important effect to increases the brake force. In addition, the increase of the number of disc holes cause a decreases of the brake force, but it turns to increase with the number of disc holes increase. Figure 6(d) shows that, the brake force increases with the friction material length increase and with the number of friction material slots decrease. The results of Figure 6(e) show that the increase of the friction material thickness increases the brake force. But the brake force decreases with the increase of number of friction material slots. From the results presented in Figure 6(f), it can be seen that, not only the brake force increases with the friction material increase but also, it increase with the friction material length increase. The increase of the brake force is greater with the friction material increase than with the friction material increase.
Fig. 6. (c) Effect of number of disc holes and pad thickness on brake force
Fig. 6.(f) Effect of number of pad slots and pad thickness on brake force.
5. CONCLUSION
In this work, central composite design with four parameters and three levels are selected and optimized to produce high brake performance. Minitab is used to develop design of experiment. According to central composite design, the number of rotor disc holes, the number of friction material slots, the friction material length and friction material thickness are selected as the independent variables and braking force is considered as the response. The Empirical relationships between the output response and the independent variables in terms of coded parameters have been expressed. The experimental results indicate that the proposed mathematical model successfully describes the performance of wedge brakes within the limits of the geometric parameters that are being investigated. It is also concluded that the main effect of the friction material thickness, the friction material length, interaction between friction material thickness and friction material length, interaction between friction material thickness and friction material length are the most significant geometrical parameters.
REFERENCES
[1] Nouby M. Ghazaly “Study on Automotive Disc Brake Squeal Using Finite Element Analysis and Design of Experiments” PhD. Thesis, Department of Mechanical Engineering, Anna University, India, 2011.
[2] D. Littlejohn, T. Fornari, G. Kuo, B. Fulmer, A. Mooradian, K. Shipp, J. Elliot, K. Lee, and M. Richards. Performance, robustness, and durability of an automotive brake system for vehicle adaptive cruise control. SAE Technical Paper, 2004-01- 0255:1 – 8, 2004. [3] D. Chan and G.W. Stachowiak. Review of automotive brake
friction materials. Proc. Instn. Mech. Engrs. Vol. 218 Part D,
Journal of Automobile Engineering, 218(D):953–966, 2004.
[4] J. Kang and S. Choi. Brake dynamometer model predicting brake torque variation due to disc thickness variation. Proc. Instn. Mech.
Engrs. Part D: Journal ofAutomobile Engineering, 221:49–55,
2007.
[5] H.J. Soh and J.-H. Yoo. Optimal shape design of a brake caliper for squeal noise reduction considering system instability. Proc.
IMechE Part D: Automobile Engineering, 224:1 – 17, 2010
[6] M. Nouby and K. Srinivasan “Simulation of Structural Modifications of a Disc Brake System to Reduce Brake Squeal”
[7] M. Nouby, J. Abdo, D. Mathivanan, K. Srinivasan “Evaluation of Disc Brake Materials for Squeal Reduction” Journal of Tribology Transactions, Volume 54, Issue 4, July 2011, pp. 644-656. [8] J. Abdo, M. Nouby, D. Mathivanan, K. Srinivasan “Reducing disc
brake squeal through FEM Approach and Experimental Design Technique” International Journal of Vehicle Noise and Vibration, 2010 - Vol. 6, No. 2/3/4 pp. 230 - 246.
[9] M. Nouby, D. Mathivanan, and K.Srinivasan “A Combined Approach of Complex Eigenvalue Analysis and Design of Experiments (DOE) to Study Disc Brake Squeal” International Journal of Engineering, Science and Technology (IJEST), 2009, Vol. 1, No. 1, pp. 254-271.
[10] M. Nouby and Waleed F. Faris“Optimal Design of a Brake Pad for Squeal Noise Reduction Using Response Surface Methodology” International Journal of Vehicle Noise and Vibration, 2012- Vol. 8, No. 2, pp. 125 – 135.
[11] Mostafa M. Makrahy, Nouby M. Ghazaly, k. A. Abd El-Gwwad, K. R. Mahmoud and Ali M. Abd-El-Tawwab “Optimization of a New Wedge Disc Brake Using Taguchi Approach” International Journal of Modern Engineering Research (IJMER), Vol. 3, Issue. 6, Nov - Dec. 2013 pp-3461-3465.
[12] Mostafa M. Makrahy, Nouby M. Ghazaly, k. A. Abd El-Gwwad, K. R. Mahmoud and Ali M. Abd-El-Tawwab “Optimization of Operation Parameters of New Wedge Disc Brake by Taguchi Method” American Journal of Vehicle Design, 2013, Vol. 1, No. 2, 30-35.
[13] Myers, R. H. and Montgomery, D. C.: Response Surface Methodology, New York, Wiley, 11, 535–561 and 12, 570–615, 1995.
[14] Hewidy, M. S., El-Taweel, T. A., and El-Safty, M. F.: Modeling the machining parameters of wire electrical discharge machining of Inconel 601 using RSM, J. Mater. Process. Tech., 169, 328–336, 2005.
[15] Kansal, H. K., Singh, S., and Kumar, P.: Parametric optimization of powder mixed electrical discharge machining by response surface methodology, J. Mater. Process. Tech., 169, 427–436, 2005.
[16] Balkin, S. D. & Lin, D. K. J. (2000), „A neural network approach to response surface methodology‟, Communications in Statistics – Theory and Methods 29(9 & 10), 2215–2227.
[17] Haftka, R.T., Scott, E.P., Cruz, J.R., 1998. Optimization and Experiments: A Survey. Applied Mechanics Review, 51(7), 435-448.
[18] R.H Myers and D.C. Montgomery. Response Surface Methodology: Process and Product Optimization Using Designed Experiments. Wiley Interscience, New York, 2002.