Simulation and Visualization of the Positioning System of
the Brain in Virtual Reality
Ekaterina Prasolova-Førland
*, Henrik Hjelle, Hege Tunstad, Frank Lindseth
Norwegian University of Science and Technology (NTNU), Trondheim, Norway
* Corresponding author. Tel.: +4799440861; email: [email protected] Manuscript submitted December 29, 2015; accepted March 28, 2016. doi: 10.17706/jcp.12.3.258-269
Abstract: The goal of this project is to investigate how simulation and 3D visualization in virtual reality can be used to make the human navigation system understandable for the broad public. The research behind the positioning system in the rodent brain was awarded the Nobel Prize in Physiology or Medicine in 2014. The cells that make up the foundation of this navigation system have been found in many species, and are thought to be similar if not identical in humans. While these results are of significant importance, the underlying concepts might be difficult to understand for non-specialists. To present the positioning system in the brain to a broader audience, an interactive 3D visualization of the major components of this system (including hippocampus, entorhinal cortex, grid and place cells) was created in Second Life. In addition, a simplified simulation of how grid and place cells function was developed using the same platform. This educational demo was presented and evaluated by members of the general public at a number of venues and occasions, including a local science museum. Based on the evaluation results and the related work, we provide a set of recommendations for visualizing and sharing neuroscience-related knowledge in virtual reality.
Key words: Visualizing neuroscience, educational visualizations, virtual reality.
1.
Introduction
There is a growing realization by many neuroscientists that the current tendency of focusing on highly detailed questions does not allow one to fully understand brain function, dysfunction, behaviour or cognition. To achieve an increase in the understanding of brain function, it is essential to combine a deepening of knowledge with a zoomed out bird’s-eye view, in order to look for relations across knowledge domains. However, the very natures of scientific investigation and publishing are mainly targeted at making small, but very precise, additions to the fundamental knowledge base. Given the substantial amount of neuroscientific facts and observations that are published yearly, it becomes difficult, if not nearly impossible, for any single neuroscientist to be fully aware of all of the knowledge, which has accumulated over time in distinct, but related, fields. This task is even more challenging for the non-professionals that are interested in the latest developments in the field.
information about the properties and morphology of neuron types in the hippocampal formation, including layer and sub-region location of axons and dendrites, molecular markers, and electrophysiological characteristics; the Human Hippocampus 3D Model [2] establishes a high-resolution three-dimensional virtual reconstruction of the human hippocampal formation; the Temporal Lobe Connectome [3] contains fine-grained information about intrinsic and extrinsic hippocampal neuroanatomical connections; and the Rodent Brain WorkBench [4] provides a very precise, common anatomical space, in which diverse datasets can be displayed and related. The interconnectedness of the information and the possibility of allowing scientists to interactively work with this knowledge in a graphical environment make obvious the value in combining these resources. This database integration would allow scientists to quickly gain an overview of multiple hippocampus-related research fields, as well as switch between thousands of scientific details, at the click of a button. The alternative would be for scientists to awkwardly alternate among different data sets and presentation styles.
While it is important to provide the scientists with tools and visualization that makes it easier for them to get a better overview of the field, it is equally important to give a basic introduction to neuroscience to non-specialists, both for recruitment and general education purposes. At the same time, the approach of choice for non-specialists would be different, focusing on simplified visualizations and gaming elements. In particular, we focus on three-dimensional virtual worlds (3D VWs) and Virtual Reality (VR) for this purpose. VR simulations, 3D virtual worlds, and serious games have been used for educational purposes for a long time, due to their capability of providing an engaging learning experience and demonstrating concepts and settings that are not easily accessible in regular educational situations. This technology can benefit the educational process due to relatively low cost and high safety, three-dimensional representations of learners and objects, and interaction in simulated contexts with a sense of presence [5]. 3D VWs can be used in combination with other VR technologies, such as motion tracking and head-mounted displays (HMDs, e.g. Oculus Rift, oculus.com), to increase the sense of immersion and, therefore, improve the experience, making it more believable and transferable to the real life. VR is being increasingly used for developing educational medical visualizations, for example, to be used in anatomy classes [6].
In this work, we will focus on 3D visualization of the human positioning system to make it understandable for the general public. The research on the cells that constitute a positioning system in the brain, the brain’s “inner GPS”, by O’Keefe (University College London, UCL) and Edvard & May-Britt Moser (Norwegian University of Science and Technology, NTNU) was awarded the 2014 Nobel prize in physiology or medicine. The sense of place is one of the most fundamental brain functions and gives a perception of the position of the body in the environment and in relation to surrounding objects [7]. During navigation, the sense of presence is “interlinked with a sense of distance and direction that is based on the integration of motion and knowledge of previous positions” [7]. Humans depend on these spatial functions for recognizing and remembering the environment, and anchor declarative memories [8].
O'Keefe discovered that certain nerve cells in hippocampus, “place cells”, were activated when a rat was situated at a particular place in the environment, thus building up an inner map/maps of the environment in the brain [7], [9]. The Mosers discovered that certain cells the entorhinal cortex, “grid cells” were activated in a unique hexagonal spatial grid pattern when the rat passed multiple locations, together constituting a coordinate system that allows for spatial navigation [7], [10]-[12].
While the findings of the Nobel prize winners are primarily based on rodent trials, recent research shows that humans navigating within VR environments exhibit similar brain activity patterns in e.g. grid, place and direction cells [12], [13]. This research also shows [13] that visual representations of landmarks influence the formation of navigational strategies in humans.
visualization of the major components of this system (including hippocampus, entorhinal cortex, grid and place cells) was created in Second Life (SL, secondlife.com). In addition, a simplified simulation of how grid and place cells function was developed using the same platform. This educational demo was presented and evaluated by the members of general public at a number of venues and occasions, including a local science museum. Based on the evaluation results, experiences and lessons learned, we outline future directions for this project.
2.
3D Visualization of Human Positioning System for General Public: Requirements
and Implementation
The visualization developed in this project addressed two major learning goals: 1) Giving the user a basic understanding of the layout of the human navigation system; 2) Giving the user a basic understanding of how grid and place cells work in relation to human spatial navigation. A set of requirements, including general ones, requirements for the brain model, guided tour and simulation of cell activity, were developed based on these learning goals, related work, and consultations with neuroscientists:
General requirements:
• The project should contain a 3D visualization of the human navigation system (brain model) • It should contain at least three layers of the brain components
• The users should be guided through the brain
• The project should contain a simulation of grid/place cell activity • The visualization should be immersive, engaging and realistic
Brain model requirements:
• The model should be anatomically correct (to a certain degree) and contain the outer shell of the brain (cerebral cortex), the entorhinal cortex and the hippocampus within the limbic system
• It should contain grid/place cells within the entorhinal cortex and the hippocampus • The cells should include an animation to indicate cell activity
Guided tour:
• It should be possible to communicate with and manipulate the brain model, the model should be movable
• The guided tour should be adapted to use in combination with HMDs and require minimal user input • The guided tour should give the user short but understandable textual information during the tour,
explaining what the user is currently seeing in the brain model
Simulation of cell activity:
• There should be a separate simulation of place cell activity and a simulation of both place and grid cell activity simultaneously, in designated walking areas in Second Life (SL)
• The simulations should map cell activity related to the walking areas the user avatar is navigating in to a static 2D representation. This should be updated dependent on the avatar’s position and present the information to the user in a short and understandable manner
Based on the requirements, an implementation of the human navigation system, ”Human navigation centre” (HNC), was made in Second Life. It includes three sequential stages: an introduction stage, a guided brain tour stage and a simulation of cell activity stage. Neuroscientists have been consulted at different stages of the development process, however it was not possible to accommodate all their recommendations due to limited resources and technological limitations.
can lead to breakthrough research on neurological diseases, such the Alzheimer’s disease.
The brain model in SL is based on different models found on the Internet [16]-[18]. The models represent the different layers of the brain model: the outer shell, the hippocampus and entorhinal cortex and the cell level. They were all edited in Blender (www.blender.org), an open-source 3D graphics software program before putting them together in SL to form the resulting brain model. Some functions were added to the brain model, such as rotation of the whole model and making internal components visible and invisible depending on the stage of the brain tour.
The guide vehicle for the brain model was made in SL for the brain tour consisting of two main components: the guide framework and the blackboard. The guide framework contains the platform where the user can be seated and static objects that connects the platform to the blackboard. The guided brain tour consist of fifteen sequentially stages, starting from the outer layers of the brain to the cell level of the brain. To go to the next stage in the tour, the user have to click on the blackboard to go from one stage to another. The tour starts with the user right-clicking the guide and selecting ”Brain Tour”. The SL guide then changes its position so it is located in front of the brain. Since the user is seated at the guide, the user also changes position (Figs. 1-4).
Fig. 1. 3D brain model with hippocampus and entorhinal cortex.
Fig. 2. One of the place cells in the hippocampus starts to blink. This indicates that the cell is active.
Fig. 3. 3D brain model focusing on hippocampus and entorhinal cortex (the remaining brain areas are not
shown).
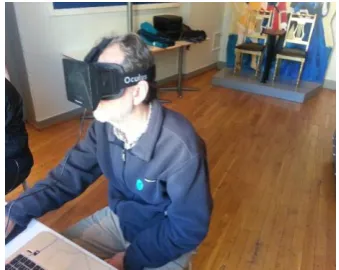
Fig. 4. A volunteer is wearing Oculus Rift while exploring the brain model at the Trondheim
Science Centre.
changing the view with rotating the avatar, the HUD will still remain at the same position on the screen. The purpose of the HUD in this case is to get a 2D representation of the area where the user moves. This representation will then be mapped with cell activity data from the simulations corresponding to that area.
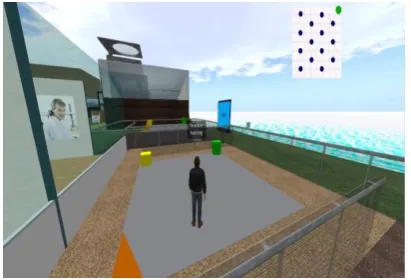
The HUD checks mainly two things in each iteration, the change of state and if the current position should be marked with a brain activity object at the HUD. The conditions that determine whether a position should be marked with a cell activity is based on grid and place cells activity. For the check of the place cell activity, the only thing needed to be checked is whether the avatar is close to the green box or not (Fig. 5). The checking of grid cell activity consist of checking the position with some hardcoded coordinates, based on a hexagonal grid cell pattern. If the position of the avatar matches one of these coordinate conditions, a message to the related subcomponent is sent through a linked message and blue markers appear at the HUD with even distance to each of its neighbours. After navigating through the whole plane, the markers of grid cell activity form a hexagonal pattern (Fig. 6).
Fig. 5. A volunteer is exploring grid and place cell visualization in Second Life with a HUD (Heads-Up
Display).
Fig. 6. A HUD (Heads-Up Display) in Second Life providing a simplified visualization of grid and
place cell activity.
3.
3D Visualization of Human Positioning System for General Public: Evaluation
The evaluation with the general public was done to investigate if the virtual Human Navigation Centre (HNC) was suitable for giving non-specialists an understanding of the human navigation/positioning system. The general public evaluation was divided into two parts, a quantitative evaluation and a quantitative one. The quantitative part of the evaluation consisted of a tour through the HNC, followed up by a short questionnaire. The qualitative part consisted of a tour through an extended version of the HNC, followed up by an interview.
3.1.
General Public, Quantitative Evaluation
The quantitative part of this evaluation was conducted by holding stands and recruiting people at the Trondheim Science Centre, and the local tourist office, ”Visit Trondheim”, on May 2 and 9, 2015. The quantitative part of the evaluation recruited 21 participants, who also were willing to conduct the questionnaire afterwards. At the Science Centre, 14 kids aged from 6-12 also conducted the tour through the HNC (Human Navigation Centre). Because not all of them could read and understand the questionnaire, a digital smiley survey was developed to see if the kids liked the tour through the HNC or not.
with the HMD glasses (Oculus Rift). After the participants got on the HMDs, almost all of them needed help to find the mouse for clicking on the blackboard to continue the trip (Fig. 4).
After the guided tour through the brain, four participants did not want to continue the tour in the HNC to the simulation of cell activity stage. The reasoning behind this was that some of them felt dizzy after using the HMD and some because of time issues. Those who continued the HNC tour to the simulation of cell activity stage, took off the HMD. The HUD popped automatically and an explanation of how it works was given orally to the participants. During the evaluation, it was noted that especially older people had problems with basic navigation in SL, done by using the arrows keys on the keyboard. After the tour through the HNC, the participants filled out a questionnaire. This questionnaire had several questions related to the learning potential of the HNC. A short presentation of the results of this questionnaire is given below:
Of the participants that filled out the questionnaire, 12 out of 21 were males and 9 were females. 62% of the participants were in the age range from 18-40 years. 29% of the participants were between 40 and 60 years old. 5% of the participants were younger than 18 and another 5% of the participants were older than 60 years old. Most of the participants did not have much previous knowledge about the human navigation system.
On the statement that the visualization was interesting, the majority of the participants (71%) answered ”strongly agree” (on a 5-point Likert scale, ranging from “strongly disagree” to “strongly agree”). The rest of the participants answered ”agree”. On the question concerning which visualization approach the participants preferred, slightly more preferred guided brain tour compared to the simulation of cell activity, partly because four of the participants did not conduct the simulation of cell activity.
On the statement that the visualization gave the participants an understanding of how human navigation system is built up, 86% of the participants answered ”agree” or ”strongly agree”, 5% being undecided on this claim, while 10% did not think that the HNC provided them with an understanding of the human navigation system. On the question whether that the HNC gave the users understanding of how grid and place cells work, 71% agreed on the claim related to the place cells. Here, 19% were undecided, while 10% answered ”disagree”. In the corresponding claim related to the grid cells, 67% answered ”agree” or ”strongly agree”. 24% of the participants were undecided, while 10% of the participants disagreed. 86% of the participants answered ”agree” or ”strongly agree” on the claim that the HMD provided presence and involvement in the virtual environment.
On the smiley survey for the kids that were not able to answer the regular questionnaire, 64% answered that they liked the HNC, by selecting one of the ”smiling” smileys, 21% were undecided about this, while 14% did not like the HNC.
3.2.
Qualitative Evaluation
For the qualitative part of the general public evaluation, the 6 volunteers (students aged 22-26) were asked to complete the tour through the HNC (Human Navigation Centre). After the tour, a group interview was conducted. This interview was taped by using a recording device for further use. The participants in this evaluation were 4 male and 2 females with no or low previous knowledge of the human navigation system and SL. The evaluation started with the participants getting an introduction to the human navigation system by the introduction video. The participants then, one by one, got logged into Second Life and placed in front of the entrance of the HNC. The participants then navigated themselves to the guided brain tour stage. Finally, the participants continued their tour through the HNC with the simulation of cell activity. After the tour through the HNC, all the participants participated in a semi-structured interview. A summary of their responses is presented below.
human navigation system is a complex and narrow subject. Therefore, a basic understanding of the human navigation system is more than enough for the general public. The participants believed that few would actually be motivated for further exploration
According to the students, the HNC explained the difference between grid and place cells in a good way and provided a good basis for understanding the underlying principles of the human navigation system. The participants also said that it was fun to get a basic insight into the research that received the Nobel Prize in medicine and physiology. The participants felt engaged by the interactive parts of both the guided brain tour and the simulation of cell activity.
The students liked the implementation of the introduction stage, which formed ”a basis for further understanding and learning of the human navigation system topic”, as one participant stated. They also pointed out that the structure of the HNC is comparable to a traditional school lesson, where they first have a passive learning session and then an active one. The introduction video also helped the students to understand visualizations at the later stages of the HNC better.
When discussing the guided brain tour stage vs. simulation of cell activity stage, the testers stated that the different visualizing methods were both helpful in their own way. The guided brain tour stage was easier to understand and more straight-forward, representing a “passive” learning method. On the other hand, the simulation of place & grid cell activity required active participation, was more exciting and gave the students more practical knowledge of how the cells worked.
According to the students, the brain tour was understandable, consisting of short and simple information pieces, although the professional terminology such as the hippocampus and entorhinal cortex was sometimes hard to process. The participants believed that it was a good solution to let the user decide when to go to the next stage of the simulation, by clicking on the blackboard. In that way, the users were able to stop the simulation on a stage that was interesting or hard to understand.
The respondents believed that the combination of a static brain model and a rotating brain model was a good way of seeing the brain from multiple views. At the same time, it was disturbing for the user when trying to read information from the blackboard. The technical solution in the guided brain tour, where the user shifts his/her point of view between the blackboard and the brain model, gave one of the participants pain in the neck. When using Oculus Rift, she forgot to rotate her body and only rotated her head, resulting in neck pain after the tour. The amount of information on the blackboard was deemed suitable for the general public. At the same time, the users missed the status on the blackboard, stating the current progression of the brain tour. The brain components in the brain model should also have arrows with descriptive text over them, showing the user what components the blackboard refers to. One participant stated that the visualization does not provide any indication of how the cell information is stored and sent through different components in the brain. She said that this information is vital for understanding the rest of the system.
According to the testers, the use of the HMD provides the users with an immersive and exciting experience. They stated that the combination with the rotating brain model and the use of HMD gave them a different 3D perspective of the brain model than they would have gotten without the HMD. At the same time, the students expressed concern that using this technology can take away the focus from the visualization content, i.e. the human navigation system.
their navigation inside the planes in the cubicles. The activation of the grid cells seemed almost random for some of the participants.
In general, according to the participants, the tour through the HNC gave them a basic understanding of the human navigation system. The participants thought initially that the human navigation system was a big and challenging topic to learn, but the visualization approaches in the Human Navigation Centre (HNC) made it easier to understand. Most of the participants stated that the simulation of cell activity stage gave them an understanding of how this system works in real life. They also stated that this understanding would be hard to get through standard reading in a book. One of the testers stated that he originally thought that the grid cells firing was related to objects we see and sense in real life. This simulation gave him a new perspective on how grid cells worked.
The testers also believed that the guided brain tour gave them a basic understanding of the relevant components belonging to the human navigation system inside the brain. One of the participants stated that he had an idea of how this system worked, but the guided tour gave him an understanding of where in the brain this system is located.
The participants believed that it was easy to relate the navigation done in SL to navigation done in the real world. They also stated that the transfer from the place cell firing at SL objects to place cells firing at locations in the real world was not so intuitive. A participant suggested that a future visualization should focus on how we as humans are using these cells in our daily life.
4.
Discussion
The evaluation results indicate that the brain tour stage of the implementation was able to provide the general public with an introduction to the major principles and the components of the human navigation system in the brain. The results from the qualitative part of the evaluation showed that most of the testers did not have any navigational issues and believed that the static guide and the rotating brain model provided a good solution for seeing the brain from multiple views. The use of HMD was introduced with an intent to increase the immersiveness of this stage. Results from both the qualitative and the quantitative part of the evaluation showed that the use of HMD increased the sense of presence in the virtual environment.
Results from the qualitative evaluation showed that two of six persons did not understand the purpose of the cell simulation stage. Nevertheless, the results from the same evaluation show that the main component of this stage, the static 2D representation of the 3D virtual environment (HUD), was easy to understand for the same participants. An explanation could be that the users did not relate their own movements in the virtual space to the action happening at the HUD (dots visualizing activation of grid and place cells). A better explanation prior to this stage might be useful to help the users connecting their navigation in SL, navigation in real world and the corresponding activation of the cells.
Limitations. We are aware that the presented visualization is an extremely simplified model of the brain architecture. It does not justify the intricate, yet ordered, networks, layers and pathways. According to the experts evaluating the model, the cell and anatomical models are too simple and stylized, not reflecting the various morphologies and communication patterns of cells, leaving the viewer with a simplified model where it appears that the cells are connected with one-to-one connections.
providing a more realistic picture.
According to the experts, the HUD should include more spots where the grid cell is active (Fig. 5-6). The size of these spots should also be reduced. The square pattern in the background of the HUD should be removed, because it confuses the user into seeing the hexagonal grid cell firing pattern as the user progresses through the simulation.
Finally, the appearance of the grid and place cells is more complex in reality than shown in the brain model. Still, these cells, and the simulation of the cell activity in general, are reasonably suitable for giving the general public an introduction to the structures of the human navigation system and an understanding of how the cells inside this system work together. Therefore, for neuroscience professionals, the HNC will have little to no value, because of its simplification caused by choosing the general public as a target group.
5.
Conclusions and Future Work
In this paper, we have discussed the possibilities for using 3D virtual worlds and virtual reality for visualizing neuroscience. We have looked at a particular example of the positioning system in the brain. Preliminary user testing of a prototype in Second Life shows that this approach can be more efficient and engaging compared to the traditional learning approaches of e.g. reading about the topic in a book. For future work, a combination of 3D visualization, immersive virtual reality and gaming elements should be explored [19].
At the same time, we need to take care when oversimplifying scientific results and models to make them understandable for the general public. In addition, certain concepts such as grid cell research might appear counterintuitive and require specific challenges when visualizing and presenting them for a non-professional audience. Therefore, we want to explore possibilities of merging visualization approaches for professionals and general public, with the use of 3D worlds, gaming elements and immersive virtual reality technologies, and at the same time create an interface with different levels where the user can choose his/her level of previous knowledge.
The proposed tool, a “metaverse”, should allow for a complete representation of available knowledge in the field of neuroscience that would incorporate knowledge based on research on genes, molecules and proteins, neuronal morphology and physiology, and anatomical connections and networks, up to the behaviour and cognition of multiple species, e.g. mice, rats, monkeys, and humans. This could be done by e.g. creating a modular open-source software framework, in which the knowledge brought by the Hippocampome, the Human Hippocampus 3D Model, the Temporal Lobe Connectome, and the Rodent Brain WorkBench [1]-[4] and other similar projects is combined into one clear, easy to understand and use web environment. However, this framework should be extensible, so that other groups can readily become content providers.
We aim to develop a visually appealing, scientifically accurate, and socially accessible digital universe, that will:
• stimulate collaboration, knowledge gathering and information sharing • be easy accessible to both scientists and non-scientists
• can be further contributed to by both scientists and laymen • increase common interest in scientific findings
• further stimulate scientific interest and research in the field of neuroscience
Linking the involved databases in an interactive, searchable, visual, 2D and 3D graphical environment will have many advantages for neuroscientists and general public:
• Stimulating creative thinking: visually designing experiments based on multilevel data, browsing a
hundreds of scientific reports, visualizing results of one’s own data together with that of multiple experiments, in the 3D region of interest within the brain and putting your own results in a wider context, which will inspire new interpretations of your results.
• Reporting and disseminating results: reporting and sharing results in a standardized 3D space to
allow comparisons between different studies, as well as supporting a journal publication or discussion with colleagues.
• Education: facilitating the study of brain anatomy in areas that are notoriously difficult to learn, other
than by seeing and interacting with the structures in 3D, perhaps limiting the need for real brains samples while maximising the learning outcome.
• Behavioural neuroscience: using the information in the common framework to formulate and
visualize how manipulation of particular brain region might generate a certain behaviour and relating experimentally measured behaviour to cell types and anatomical connectivity.
• Computational modelling: generating biologically plausible connectivity models and anatomically
plausible cell models, with accurate input.
• Functional neuroimaging: relating functional activation to connectivity and cells, and visualizing it in
3D.
• Neuroanatomy: visualizing the results of multiple anatomical tract-tracing studies in a single 3D
standard-space representation, as well as examining possible cell types that send projections to particular areas, and checking which cells are present in the brain area of termination.
• Open infrastructure: facilitating contributions in the same way that Wikipedia has succeeded with,
where every addition or deletion is accounted for and identified.
The end-result would be a ‘metaverse’/3D virtual world/’3D Wikipedia’, a place you could ‘visit’, immerse yourself in, perhaps together with students, peers, or friends, to explore knowledge, add your findings, or meet to discuss and explore data in social digital communities, with access points through well-known platforms such as Facebook. Combining the many anatomical databases that exist, with the latest technology in virtual reality interfaces, we propose to create the foundation for such a virtual world of brain knowledge, upon and inside which scientists and others may freely build, as well as presenting the results of their research to the general public.
Acknowledgment
The authors would like to thank employees at the Kavli Institute for Systems Neuroscience, NTNU, who provided valuable feedbacks during this project, as well as all the volunteers participating in the evaluation.
References
[1] Hippocampome project. Retrieved Dec. 9, 2015, from http://hippocampome.org/php/index.php [2] Adler, D. H., Liu, A. Y., Pluta, J., Kadivar, S., Orozco, S., et al. (2012). Reconstruction of the human
hippocampus in 3D from histology and high-resolution ex-vivo MRI. Proceedings of 9th IEEE
International Symposium on Biomedical Imaging (pp. 294-297).
[3] Temporal Lobe Connectome. Retrieved Dec. 9, 2015, http://temporal-lobe.com/background/connectome
[4] The Rodent Brain Workbench. Retrieved Dec. 9, 2015, from: http://rbwb.org/
[5] McKerlich, R., Riis, M., Anderson, T., & Eastman, B. (2011). Student perceptions of teaching presence, social presence, and cognitive presence in a virtual world. Journal of Online Learning and Teaching, 7(3), 324–336.
visualize anatomy, Proceedings of 32nd Annual Conference of the Cognitive Science Society (pp. 2326– 2331). Portland, OR.
[7] Kiehn, O., & Forssberg, H. (2014). The 2014 Nobel Prize in Physiology or Medicine-Advanced Information. Nobelprize.org. Nobel Media AB 2014.
[8] Moser, M.-B., Rowland, D. C., & Moser E. I. (2015). Place cells, grid cells, and memory. Cold Spring Harb
Perspect Biol 7: a021808.
[9] O'Keefe, J. (1976). Place units in the hippocampus of the freely moving rat. Experimental Neurology,51,
78-109.
[10] Hafting, T., Fyhn, M., Molden, S., Moser, M. B., & Moser, E. I. (2005). Microstructure of spatial map in the entorhinal cortex. Nature, 436, 801-806.
[11] Fyhn, M., Molden, S., Witter, M. P., Moser, E. I., & Moser, M. B. (2004) Spatial representation in the entorhinal cortex. Science, 305, 1258-1264.
[12] Sargolini, F., Fyhn, M., Hafting, T., McNaughton, B. L., Witter, M. P., Moser, M. B., & Moser, E. I. (2006). Conjunctive representation of position, direction, and velocity in the entorhinal cortex. Science, 312, 758-762.
[13] Ekstrom, A. D., Kahana, M. J., Caplan, J. B., Fields, T. A., Isham, E. A., Newman, E. L., & Fried, I. (2003). Cellular networks underlying human spatial navigation. Nature, 425, 184-188.
[14] Jacobs, J., Weidemann, C. T., Miller, J. F., Solway, A., Burke, J. F., Wei, X. X., Suthana, N., Sperling, M. R., Sharan, A. D., Fried, I., & Kahana, M. J. (2013). Direct recordings of grid-like neuronal activity in human spatial navigation. Nature Neuroscience, 6, 1188-1190.
[15] Moser, M.-B., & Moser, E. (2011). A journey into entorhinal cortex. Retrieved Dec. 9, 2015, from https://www.youtube.com/watch?v=jYCR0pQLd_U
[16] 3DExtras. (Mar. 14, 2015). Brain Collection 2009.
[17] Animium. Neuron cell 3d model. Retrieved March 27, 2015, from http://animium.com/2011/09/neuron-cell-3d-model
[18] Threeding. Limbic system of brain. Retrieved April 3, 2015, from https://www.threeding.com/product.php?id=2703
[19] A-Mazing-Race (game developed for Kavli Institute). Retrieved Jan. 3, 2016, from http://labyrinten.vm.ntnu.no/spill
Ekaterina Prasolova-Førland is an associate professor at the Department of Education and Lifelong Learning at the Norwegian University of Science and Technology (NTNU). She received her master’s degree in technical cybernetics in 2000 and PhD in computer science in 2004 from the same university. Her research interests include innovative technologies for learning, educational virtual reality, educational simulations and serious games. She has authored and co-authored more than 80 peer-reviewed publications in journals and conference-proceedings. Dr. Ekaterina Prasolova-Førland is currently working on a number of projects on educational applications of Virtual Reality in medicine, sports, tourism and other areas.
Hege Tunstad is the head of Communications at the National Centre for Science Recruitment at the Norwegian University of Science and Technology (NTNU). She holds a master degree in neuroscience, and has more than eight years of experience in science communication and science writing. From 2006 to 2014, she worked at the Communication Division at NTNU as an advisor and science writer. She joined the team of the 2014 Nobel prize winners in medicine and physiology, May-Britt and Edvard Mosers. at the Kavli Institute for Systems Neuroscience (NTNU) in April 2014. Hege Tunstad’s interests lie in disseminating and visualizing neuroscience.