Abstract—The paper presents the basic results of cyclical analysis of the Serbian economic activity in the period from January 2001 to September 2013. The time series used as the indicator of the dynamics of the national economic activity is monthly gross domestic product (GDP). For dating turning points two approaches are applied: classical and growth cycle, i.e. deviations from trend. According to the classical approach the cycles are defined by trend-cycle component as the changes on the absolute level of economic activity. Growth cycle approach anticipates the fluctuations in absolute level of economic activity level, as well as the fluctuations in relative level of economic activity. For identifying long-term trends applied was the Hodric-Prescott filter, while the turning points (peaks and troughs) were determined in accordance with the Bry-Boschan criteria.
Index Terms—Business cycle, monthly GDP, turning points, Serbia.
I. INTRODUCTION
All market-oriented economies are exposed to significant fluctuations of aggregate economic activity that result in business cycles being repeated, however not periodic, since they do no occur in predictable time intervals. In addition, different is the intensity, time extension, as well as the cause of each individual cycle. It is hard to find any other issue in the history of economics that gave rise to such doubtful considerations as it did the issue of business cycles. For the case of Serbia, it should be stressed that business cycles were analyzed for the first time in the late sixties of the last century. The analysis of business cycles was resumed also in the following decades, until the mid-nineties when the last paper on this topic was published. However recently, starting from 2000, the issue of cycle analysis received no special attention for various reasons and with a few exceptions [1]. But, the recent global recession highlighted once again importance of cyclical analysis of the economic activity. Therefore, the objective of this paper is to analyze the Serbian economic activity in the context of business cycles, as well as to determine whether interdependence among the business cycles of Serbia and the selected countries is existent.
Manuscript received November 9, 2013; revised January 9, 2014. The authors are with the Statistical Office of the Republic of Serbia, Senior Advisers, Belgrade, Serbia (e-mail: dragan.vukmirovic@stat.gov.rs,
rade.ciric@stat.gov.rs, mirjana.smolcic@stat.gov.rs,
svetlana.jelic@stat.gov.rs, suzana.karamarkovic@stat.gov.rs).
II. APPROACHES TO BUSINESS CYCLE ANALYSIS
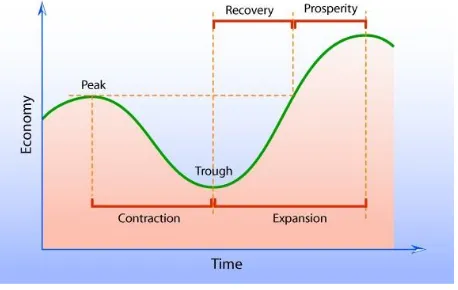
Two approaches [2] are identified in the theory and practice of empiric research of business cycles: classical approach and approach of growth cycle, i.e. deviations from trends. The classical approach to cycle analysis anticipates fluctuations in the absolute level of economic activity, while the stages of classical cycles are defined as contraction (recession), trough, recovery and prosperity.
Fig. 1. Classical cycles.
In difference to the classical approach, the approach of growth cycle, i.e. deviations from trends, anticipates the fluctuations in absolute level of economic activity level, as well as the fluctuations in relative level of economic activity, i.e. the changes in growth rate dynamics. According to this approach, business cycles are defined as oscillations upwards and downwards in relation to the long-term trend, and they present the periods of expansion economic activity, i.e. economic slowdown. In practice, this means that growth rate decrease does not anticipate recession in classical terms; however, it presents the change in the series of deviations from trends and the start of slowdown in economic activity. This approach became especially significant in the period after the World War II since it enabled analysis of business cycles, although market-oriented economies noted growth of economic activity without classical long-term recession and therefore it was not possible to implement the classical approach.
In the figures here below, it is possible to note the differences in cycles that resulted from the implementation of the two approaches. In Fig. 2 presented are classical cycles in the OECD countries, where aggregate economic activity is regarded by the indices of industrial production. In the period observed, only four turning points are notable: peak in December 2000, trough in December 2001, peak in February
Dating the Serbian Business Cycles
Dragan Vukmirovic, Rade Ciric, Mirjana Smolcic, Svetlana Jelic, and Suzana Karamarkovic
In order to meet this objective, this paper was conceived so to include three chapters, apart from the introduction and conclusion. In the Section II studied is the theoretical approach to business cycle analysis. The Section III includes the methodological aspects of the analysis of the Serbian business cycle. The results and comparisons with the selected
2008 and trough in May 2009. In difference to classical approach, in the approach of growth cycle (Fig. 3) notable is a considerably larger number of turning points. From the chronological point of view, turning points are the following: peak in June 1990, trough in August 1993, peak in January 1995, trough in May 1996, peak in November 1997, trough in January 1999, peak in August 2000, trough in January 2002, peak in February 2008 and trough in May 2009. There from, the number of phases, i.e. business cycles is larger in relation to the classical approach. This is to be expected, taking into account the fact that as business cycle registered is not only the changes in the absolute level of economic activity, but in the relative level as well.
60 70 80 90 100 110 120
1990 1991 1992 1993 1994 1995 1996 1997 1998 1999 2000 2001 2002 2003 2004 2005 2006 2007 2008 2009 2010
Fig. 2. Classical cycles in OECD area, Ø2005=100.
85 90 95 100 105 110
1990 1991 1992 1993 1994 1995 1996 1997 1998 1999 2000 2001 2002 2003 2004 2005 2006 2007 2008 2009 2010
Fig. 3. Growth cycles in OECD area, long-term trend=100.
III. METHODOLOGY
The analysis of the Serbian business cycle was carried out according to the statistical, descriptive model. This model is very suitable for the case of Serbia in this stage of analysis, since it is not obligatory regarding the interpretations in business cycle theoretical context. Applied are both approaches – classical and growth cycle, i.e. deviations from trends.
A. Reference Series
Reference series anticipates the economic variable that is used as the indicator of the aggregate economic activity. In the ideal case, gross domestic product (GDP) shall be selected as the reference series, since GDP represents the total value of the final goods and services produced in a national economy [3]. However, in many countries GDP data are published with considerable lag, and the data are usually available in annual and quarterly dynamics. Therefore, the
OECD anticipates monthly index of industrial production (IIP) as the reference series. We ought to stress that in OECD countries empiric researches determined that industrial production generates the largest part of the cycle component of the total economic activity, and that there is a high correlation of industrial production cycles and GDP cycles. Therefore, the cycle indicators of industrial production can be applied as the indicators of the GDP cycle movements, i.e. of the aggregate economic activity. In addition, in the final procedure of dating turning points, analyzed are the turning points in monthly series of industrial production with quarterly GDP movements, when upon certain corrections are made in accordance with the GDP movements.
Composite index of economic activity represents the estimate of monthly dynamics of aggregate economic activity and it is derived as weighted monthly dynamics of the respective indicators of economic activity in the sections that create a national economy. The annual index of physical volume of agricultural production, monthly index of physical volume of forest exploitation and the monthly index of number of employees are used as indicators of the economic activity of section A - Agriculture, forestry and fishing (NACE Rev. 2). The issue of measuring the agricultural output in quarterly and especially monthly dynamics is rather specific, since the major indicator of production is sales and purchase of agricultural products. The majority of these sales is recorded in the third or the forth quarter, while agricultural production is performed throughout the whole year. In the calculation of composite index starting point is distribution of annual value of agricultural production over quarters. This distribution is carried out according to monthly dynamics of the sales at constant prices and fixed proportions of production costs, by quarters (20%, 25%, 30%, 25%). The same index, obtained in this way for particular quarter, is used for each month of that quarter. This solution is acceptable because it is neutral on the monthly level, but takes into account quarterly pattern of agricultural production.
these sections are monthly indices of physical volume of industrial production at division level. These indices are available 30 days after the end of the reference month.
Monthly index of number of employees are used as indicators of the economic activity of the section E - Water supply and waste management.
The quarterly value of construction works done and the quarterly index of hours worked are used as the indicators of the economic activity of section F- Construction. The data are available 45 days after the end of the reference quarter. Monthly indicator for composite index calculation is obtained by disaggregation of quarterly index with monthly number of employees as related series, using ECOTRIM. Since the official quarterly index of construction is available 45 days after the end of reference quarter it has to be estimated using econometric models.
The monthly data on retail and wholesale trade turnover value are used as indicators of the economic activity of the section G - Wholesale and retail trade. The data on retail trade are available 30 days after the end of the reference month. Since the monthly data on wholesale trade are available 75 days after the end of the reference quarter it has to be estimated using econometric models.
The monthly physical volume indices of transportation services are used as the indicators of the economic activity of section H - Transportation and storage. Since the monthly data are available 75 days after the end of the reference quarter it has to be estimated using econometric models.
Monthly data on catering turnover value and index of number of overnight stays are used as indicators of the economic activity of the section I - Accommodation and food service activities. These data are available 30 days after the end of the reference month.
The monthly physical volume index of telecommunication services and monthly index of number of employees are used as indicators of the economic activity of the section J - Information and communication. Since the monthly data are available 75 days after the end of the reference quarter it has to be estimated using econometric models.
The monthly stocks of deposits and credits at commercial bank and monthly index of number of employees are used as indicators of the economic activity of the section K - Financial and insurance activities. These data are available 30 days after the end of the reference month. The same indicators are used for financial intermediation services indirectly measured (FISIM).
In the calculation of indicator for section L - Real estate activities starting point is disaggregation of annual data on imputed rent to quarterly data, using quarterly dynamics of the GVA sum of all sections except section L. Monthly indicator for composite index calculation is obtained by disaggregation of quarterly index with monthly number of employees as related series, using ECOTRIM.
Monthly indices of number of employees are used as indicators of the economic activity of the sections Professional, scientific and technical activities (section М), Administrative and support service activities (section N), Public administration and defense; compulsory social security (section O), Education (section P), Human health and social work activities (section Q), Arts, entertainment
and recreation (section R), Other services activities (section S), Activities of households as employers (section T). These data are available 30 days after the end of the reference month.
Indicator for Net taxes is weighted average of indicators of all sections.
In order to link the economic movements in the selected sections to make a whole, it is necessary to make adequate aggregations. Therefore, it is rather important to implement adequate weighting, so that the share of individual components corresponds to their relative significance. With this regard, weight selection was carried out in accordance with the share of the gross value added (GVA) of each of the mentioned individual components in the total GDP. In order to follow the national economy structure to the extent possible, applied is the method of changed weights. That means that for a current year the weights of the previous year are used. Practically, the chain-linking method is used as for the officially quarterly GDP calculations, however with monthly indicators.
The calculated monthly composite index of economic activity is used as indicator for disaggregating annual GDP data by applying the procedure of benchmarking. The Eurostat’s software – Ecotrim was used for this purpose. The benchmarking procedure provides the corrected monthly dynamics of aggregated economic activity under the limitations of annual data on GDP. The monthly GDP movement is shown in Fig. 4.
80000 90000 100000 110000 120000 130000 140000 150000 160000 170000 180000
Ja
n
-01
S
e
p
-01
M
a
y
-02
Ja
n
-03
S
e
p
-03
M
a
y
-04
Ja
n
-05
S
e
p
-05
M
a
y
-06
Ja
n
-07
S
e
p
-07
M
a
y
-08
Ja
n
-09
S
e
p
-09
M
a
y
-10
Ja
n
-11
S
e
p
-11
M
a
y
-12
Ja
n
-13
S
e
p
-13
Fig. 4. Monthly GDP in the Republic of Serbia, mill. RSD.
B. Seasonal Adjustment and De-Trending
1 2 2 * 1 * * * 1 1 2 * T t t t t t T t tt Y Y Y Y Y
Y (1)
where λ is the weighting factor that controls how smooth the resulting trend is. Lower λ values will in the trend values that are closer to the seasonally-adjusted series, while in the case of higher λ values, the short-term fluctuations of the seasonally-adjusted series will not be taken into account. In this paper HP filter was applied within DEMETRA software, by setting λ value of 1291119.77 for monthly data, which correspond to λ value of 1600 for quarterly data. This λ value was originally selected by Hodric and Prescott, and also it is the value used by OECD in their analyses.
C. Dating Turning Points
By the classical approach cycles are defined by trend-cycle component as the changes on the absolute level. General criteria envisage the minimum cycle duration of 18 months and the duration of 6 to 9 months for a phase.
Cycle determination by growth cycle approach is much more demanding. Since the time series of monthly GDP, which is used as the reference series, has been multiplicative, growth cycles are obtained by dividing seasonally-adjusted data by long-term trend. Turning point is defined as the point that in the series of deviations from trend has the local maximum (peak), i.e. the local minimum (trough). The cycle peak denotes the end of expansion and appears when economic activity is on the highest level above the trend line. The cycle trough denotes the end of recession and then economic activity is on the lowest level below the trend line. For identifying turning points, the Bry-Boschan [8] criteria are used:
Cycle duration is minimum 15 months;
Phase duration is minimum 5 months;
Eliminated are turning points within the six-month intervals at the beginning and at the end of series;
Eliminated are peaks (troughs) at the beginning and at the end of series that are lower (higher) than the end-values;
In the case of double peak or double trough, the more recent value is anticipated as turning point [9].
IV. RESULTS
As can be seen from the Fig. 5, in the Serbian monthly GDP, four turning points are registered: peaks in March 2008 and July 2011 and troughs in July 2009 and October 2012. That implies that by classical approach, in the observed period, the expansion lasted as long as until March 2008, when the Serbian economy entered recession. The recession lasted as long as until July 2009. From July 2009 a phase of recovery has started but stopped by another recession in July 2011. The second wave of classical recession lasted until October 2012 when phase of recovery started once again. However, the recovery is rather moderate, so that still not achievement of the economic activity level before the first wave of recession has been made.
The growth cycles in the Serbian monthly GDP are presented in the Fig. 6. The number of phases, i.e. business cycles is larger in relation to the classical approach. This is to
be expected, taking into account the fact that as business cycle registered is not only the changes in the absolute level of economic activity, but in the relative level as well. Four troughs (June 2004, April 2006, December 2009 and October 2012) and three peaks (September 2005, March 2008 and July 2011) were registered. Practically, it means that the Serbian economy was in a phase of expansion from June 2004 to September 2005, followed by the phase of moderate slowdown until April 2006. Expansion phase started again and lasted until March 2008, which denotes the start of significant slowdown. In December 2009 economy once again started its expansion phase. Another slowdown started in July 2011 and lasted until October 2012.
P T P T 70 75 80 85 90 95 100 105 Ja n -01 Ju l-01 Ja n -02 Ju l-02 Ja n -03 Ju l-03 Ja n -04 Ju l-04 Ja n -05 Ju l-05 Ja n -06 Ju l-06 Ja n -07 Ju l-07 Ja n -08 Ju l-08 Ja n -09 Ju l-09 Ja n -10 Ju l-10 Ja n -11 Ju l-11 Ja n -12 Ju l-12 Ja n -13 Ju l-13
Fig. 5. Classical cycles in Serbian GDP, Ø2012=100.
T P T P T P T 94 96 98 100 102 104 106 108 Ja n -01 Ju l-01 Ja n -02 Ju l-02 Ja n -03 Ju l-03 Ja n -04 Ju l-04 Ja n -05 Ju l-05 Ja n -06 Ju l-06 Ja n -07 Ju l-07 Ja n -08 Ju l-08 Ja n -09 Ju l-09 Ja n -10 Ju l-10 Ja n -11 Ju l-11 Ja n -12 Ju l-12 Ja n -13 Ju l-13 Fig. 6. Growth cycles in Serbian GDP, long-term trend=100.
Regarding this three full cycles are notable (presented in Table I): the first, from June 2004 to April 2006, the second, from April 2006 to December 2009 and third from December 2009 to October 2012.
TABLEI:CHARACTERISTICS OF GROWTH CYCLES IN SERBIAN GDP
Phase/ Cycle
Turning Points Duration
(Dates) (Months)
Trough Peak Trough Phase Cycle
Expansion Jun-04 Sep-05 15
Slowdown Sep-05 Apr-06 7
Cycle 1 Jun-04 Apr-06 22
Expansion Apr-06 Mar-08 23
Slowdown Mar-08 Dec-09 21
Cycle 2 Apr-06 Dec-09 44
Expansion Dec-09 Jul-11 19
Slowdown Jul-11 Oct-12 15
V. CONCLUSION
Two approaches are identified in the theory and practice of empiric research of business cycles: classical approach and approach of growth cycle. The classical approach to cycle analysis anticipates fluctuations in the absolute level of economic activity, while the approach of growth cycle anticipates the fluctuations in absolute level of economic activity level, as well as the fluctuations in relative level of economic activity. Cyclical analysis of economic activity by classical approach showed that in the observed period the expansion lasted as long as until March 2008, when the Serbian economy entered recession, which lasted as long as until July 2009. From July 2009 a phase of recovery has started but stopped by another recession in July 2011. The second wave of classical recession lasted until October 2012 when phase of recovery started once again. According to growth cycle approach two full business cycles could be identified in the Serbian economy: the first, from March 2002 to October 2003 and the second, from October 2003 to December 2009. Regarding growth cycle approach three full cycles are notable: the first, from June 2004 to April 2006, the second, from April 2006 to December 2009 and third from December 2009 to October 2012.
REFERENCES
[1] J. R. Stojanović, “A cyclical analysis of economic activity in Serbia,”
Journal on Business Cycle Measurement and Analysis, OECD, no. 4, vol. 2, pp. 5-28, 2011.
[2] M. Artis, M. Marcellino, and T. Proietti. Dating the Euro Area business
cycle. European University Institute and CEPR. [Online]. Available: http://ideas.repec.org/p/cpr/ceprdp/3696.html
[3] Measuring Economic Performance: the Case of Serbia, Statistical Office of the Republic of Serbia, Belgrade, 2008.
[4] D. Vukmirovic, R. Ciric, and S. Karamarkovic “Serbian composite
index – indicator of monthly GDP,” presented at NTTS 2013, Brussels, 5-7 March 2013.
[5] D. Vukmirovic, A. Milojic, R. Ciric, and J. Vukmirovic, “Serbian
composite index as an instrument for the measuring of short term trends
of the economic acitivity,” Statistics Journal, National statistical
Institute, Bulgaria, vol. 1-4/2009, 2010.
[6] Cycle Extraction - A comparison of the Phase-Average Trend method, the Hodrick-Prescott and Christiano-Fitzgerald filters, OECD, Paris, 2008.
[7] Composite leading indicators for major non- members economies and recently new OECD member countries, OECD, Paris, 2006.
[8] OECD system of composite leading indicator, OECD, Paris, 2008.
[9] G. Bruno and E. Otranto. (2004). Dating the Italian Business Cycle: A
Comparison of Procedures. Working paper No. 41. ISAE. [Online]. Available: http://ideas.repec.org/p/isa/wpaper/41.html
Dragan Vukmirovicwas born in Otocac, Republic of
Croatia, on March 1, 1962. He received the doctor’s
degree in Faculty of Organizational Sciences,
University of Belgrade in 1999 and master degree in Faculty of Economics, University of Belgrade in 1993. He has been the director of Statistical Office of the Republic of Serbia since 2004. From April 2001 to September 2002, he was an assistant dean for Organization of the Faculty of Organizational Sciences, the manager of the Center for Market Research of the Faculty of
Organizational Sciences in October 2001, an assistant dean for
scientific-research work of the Faculty of Organizational Sciences in October 2002. He has more than hundred of published scientific and research papers
from the field of IT Technology, Statistics, Marketing, Market Research, Electronic Management and Internet Marketing. He was a Ph.D. Vukmirović is member of professional bodies: Statistics Society of Serbia, Informations Society of Serbia, ISI institute. He was awarded several times for his work and contributions individually and institutionally, by domestic and international organizations and associations.
Rade Ciricwas born on May 22, 1979 in Kraljevo,
Republic of Serbia. He holds a master of Science in economics (branch fiscal and monetary management) from the Faculty of Economics, University of Belgrade in 2008. Previously, he graduated at the same faculty on finance, banking and insurance in 2005. Since 2005 he works in the Statistical Office of the Republic of Serbia first as a trainee and then as statistician analysts. His main activities and responsibilities are flash estimates of quarterly GDP, compilation of national accounts aggregates and macroeconomic analysis. He worked in various team projects such as: Supply and Use Tables, Satellite Accounts of Cooperatives and Mutuals and Tourism Satellite Accounts. Some of the most important paper are: Serbian Composite Index – Indicator of Monthly GDP, Brussels, Belgium, 2013; Tax Burden in Serbia, Radenci, Slovenia, 2012; Measuring Economic Performance: The Case of Serbia, Belgrade, Serbia, 2007.
Mirjana Smolcicwas born in Ivanjica, Republic of
Serbia on September 29, 1967. She received her master degree in Faculty of Economics, University of Belgrade in 1991. Since 2003 she has been the head of the quarterly national accounts divisions in Statistical Office of the Republic of Serbia. Previously she worked as a statistician methodologist in the Federal Statistical Office. She has large number of published scientific and research papers in the field of National Accounts. Some of the most important paper are: Material Flow Indicators of the Republic of Serbia 2001-2011, Belgrade, Serbia, 2013; Satellite accounts for cooperative economy of the Republic of Serbia 2009, Belgrade, Serbia 2011; Measuring Economic Performance: The Case of Serbia, Belgrade, Serbia, 2007.
Svetlana Jelicwas born in Bajina Basta, Republic of Serbia on June 23, 1971. She received her master degree in Faculty of Economics, University of Belgrade in 1997. Since 2006 she works as statistician analysts in Statistical Office of the Republic of Serbia. Previously she worked in the Federal Statistical Office. She has large number of published scientific and research papers in the field of National Accounts. Some of the most important paper are: Material Flow Indicators of the Republic of Serbia 2001-2011, Belgrade, Serbia, 2013; Structure of Income and Expenditure of Economic Subjects, 2011, Belgrade, Serbia, 2013; Investments of the Republic of Serbia, Belgrade, Serbia, 2010.
Suzana Karamarkovicwas born in Belgrade, Republic