Additional file 1: Supplemental Methods, Figures S1-S4 and Table S2
“Shared functions of plant and mammalian StAR-related lipid transfer (START) domains in
modulating transcription factor activity” by Kathrin Schrick et al.
Supplemental Methods
Flow cytometry
GFP levels in live yeast cells were quantified by flow cytometry as in [1]. Yeast cells
transformed with GSV:yEGFP3 constructs were grown to exponential phase (OD
600of ~0.500)
in selection media containing low-flow fluorescence yeast nitrogen base without riboflavin and
folic acid [2]. GFP positive and negative controls were pUG35 and pNF-1, respectively. For each
sample, 2 x 10
6cells were washed in 0.5 ml PBS, resuspended in 0.1 ml PBS for sonication, and
another 0.9 ml was added prior to sample processing. Flow cytometry was performed using a BD
Biosciences FACSAria Flow Cytometer Cell Sorter. Illumination was with a 200 mW 488 nm
argon laser. Emission was detected through a 530/30 nm filter (FL1-H filter). 500,000 particles
(yeast cells) were gated per sample.
Supplemental References
1.
Niedenthal RK, Riles L, Johnston M, Hegemann JH: Green fluorescent protein as a
marker for gene expression and subcellular localization in budding yeast. Yeast
1996, 12(8):773-786.
2.
Sheff MA, Thorn KS: Optimized cassettes for fluorescent protein tagging in
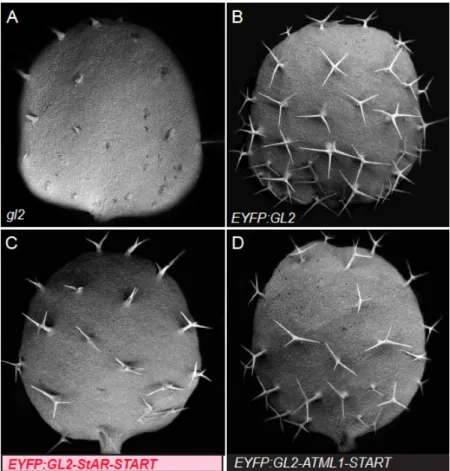
Figure S1. Trichomes on first leaves of gl2 mutants transformed with GL2 constructs.
(A-D) Scanning electron micrographs (SEM) of first leaves. (A) gl2 mutants exhibit a defect in
differentiation of trichome cells as indicated by short unbranched trichomes that barely emerge
from the epidermis. gl2 mutants transformed with (B) ProGL2:EYP:GL2 exhibit branched
trichomes, indicating a rescue of the mutant phenotype, while gl2 mutants transformed with (C)
ProGL2:EYFP:GL2-StAR-START or (D) EYFP:GL2-ATML1-START display a partial rescue of
the trichome differentiation defect.
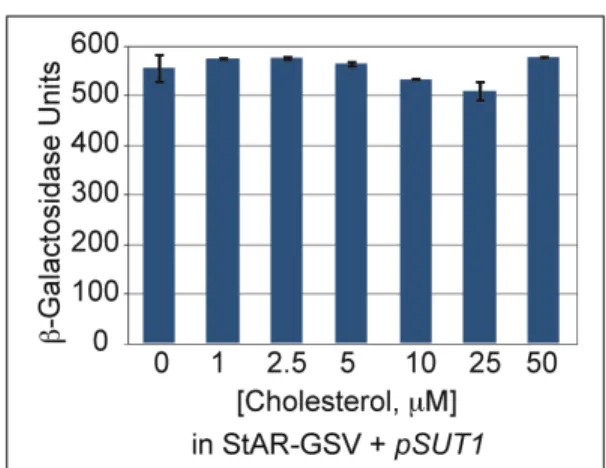
Figure S2. Exogenously supplied cholesterol does not alter activity levels of StAR-GSV.
The addition of cholesterol in the range from 0-50 µM had no effect on the activity levels of
yeast cells expressing the GSV construct containing the mouse StAR START domain together
with the pSUT1 plasmid. Error bars indicate standard deviations for two independent
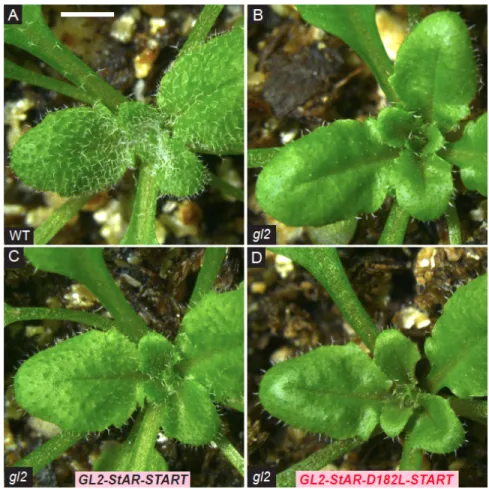
Figure S3. Rosette phenotypes of StAR-START versus the D182L missense mutant
expressed in the GL2 transcription factor.
(A-D) Rosettes exhibiting leaf trichomes. (A) Wild-type (WT) level of trichomes in comparison
to (B) gl2 null mutant which displays a reduction in leaf trichomes.
(C-D) Representative gl2 lines expressing (C) ProGL2:EYFP:GL2-StAR-START or (D)
ProGL2:EYFP:GL2-StAR-D182L-START. While mouse StAR-START can partially replace the
GL2-START domain, the missense mutation D182L results in a reduction in trichome cell
differentiation. Scale bar = 2 mm. This figure is supplemental to Figure 4.
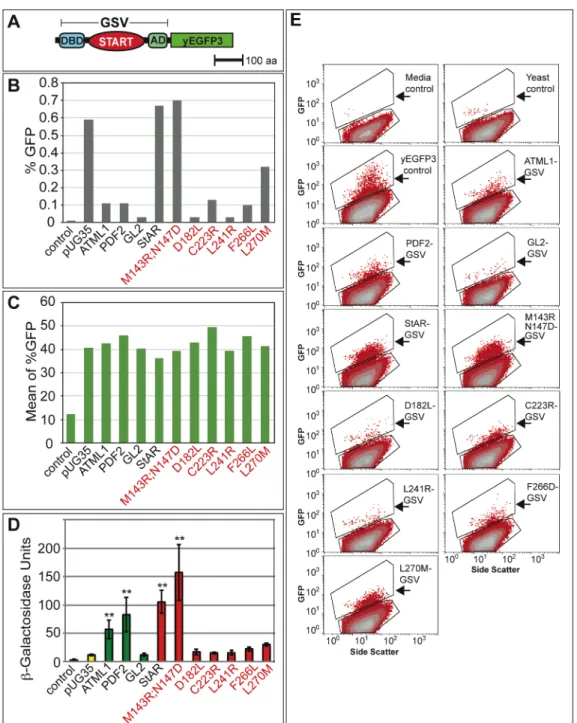
Figure S4. In vivo expression of GSV constructs as yEGFP3 fusions in yeast.
(A) Schematic of GSV translational fusion to yEGFP3.
(B) Flow cytometry data for the % GFP cells. The negative control which does not contain GFP
corresponds to 0.01% GFP positive cells and the positive control which contains yEGFP3 alone
(pUG35) corresponds to 0.59% GFP. The GFP-expressing cells exhibit % GFP values ranging
from 0.03-0.70%.
(C) Mean values for % GFP from side scatter plots. The negative control shows a mean value of
12 while the positive control (pUG35) exhibits a mean value of 41. The GFP-expressing cells
show mean values in the range from 36-47.
(D) Activity levels of the corresponding GSV-yEYFP3 constructs containing START domains
from Arabidopsis ATML1, PDF2, and GL2 (green), and mammalian StAR and corresponding
mutants (red) are indicated. Error bars show standard deviations for two independent
transformants in three trials, and double asterisks indicate a significant increase in activity over
the pUG35 control (Two-tiered t-test, P < 0.05).
(E) Flow cytometry side scatter plots of GFP positive yeast cells expressing yEGFP3. The top
polygon from each plot indicates the population of cells that were gated as GFP positive
(arrows). Side scatter is indicated on the X-axis and GFP signal is indicated on the Y-axis.
“Media control” lacks yeast cells, while the “Yeast control” contains yeast cells that carry the
same selectable marker (URA3) as the remaining samples albeit no GFP expression. The
yEGFP3 control exhibits strong expression of yEGFP3 from the pUG35 plasmid. The sample
order of the GSV-yEGFP3 constructs from top to bottom, right to left, corresponds to that in
A-D. Each of the GSV samples indicates the presence of GFP positive cells in comparison to the
negative controls.
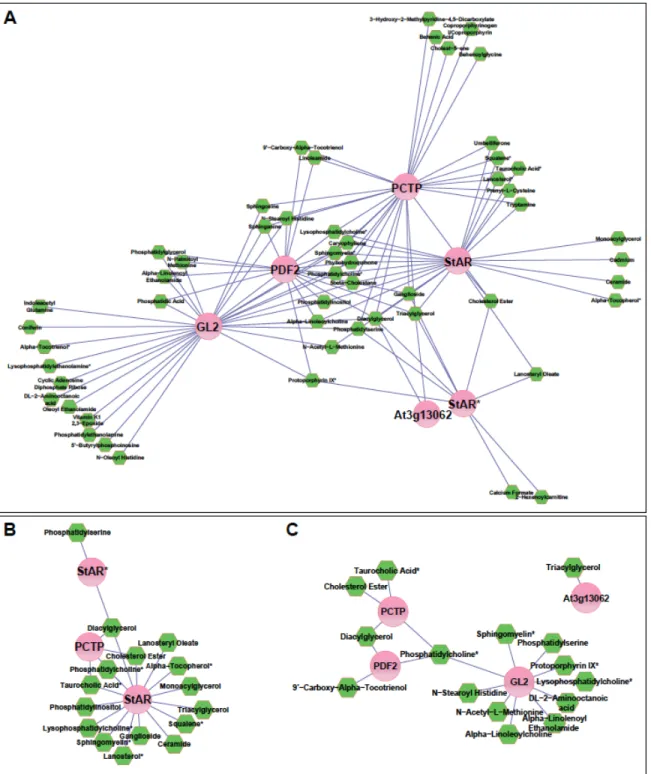
Figure S5. Protein-metabolite interaction network for mammalian and Arabidopsis START
domains.
(A) Normalized protein-metabolite enrichment data expressed as the fold-change of
domain-bound metabolite relative to the GV control greater than 4 were processed using Cytoscape to
produce an edge-weighted interaction network in which larger elliptical nodes represent the
Distances between protein and metabolite nodes reflect the interaction strengths based upon the
magnitude of fold-change – the shorter the edge the more enriched the metabolite.
(B) A sub-network was generated to compare and contrast the nature of protein-bound
metabolites between the mammalian START domains, PCTP (human), StAR (mouse) and
StAR
D182L* (mouse).
(C) A network comparing the Arabidopsis and human PCTP START domains. The
sub-networks (B, C) were filtered for interactions with a greater than 10-fold change in enrichment
relative to the GV control and only high confidence metabolite assignments were included.
For all networks (A-C), in cases where a node had multiple interactions with the same chemical
sub-class of metabolite, e.g. PtCho, these interactions were combined and weighted to give one
interaction. Metabolite names designated by asterisks were further validated by mass
spectrometry, matching exact mass and retention time to a known standard analyzed under the
same experimental conditions.
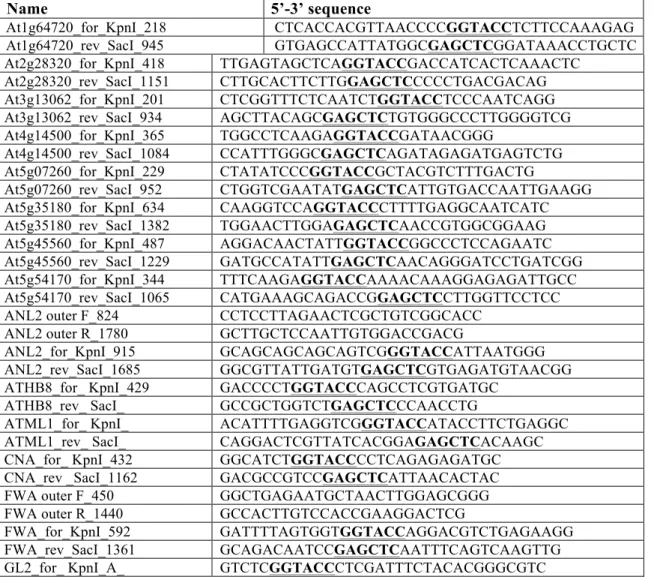
Table S2. Oligonucleotides used in this study.
Nucleotide bases shown in bold denote restriction
sites used for cloning or changed bases from site-directed mutagenesis unless otherwise indicated.
I. Primers for GL2 START domain deletion construct and GL2 START domain swaps. Homologous sequences for domain swap in-fusion cloning are indicated in bold.
Name
5’-3’ sequence
GL2_START_ Δ _F [Phos] GTC TTC TTC ATG GCT ACC AAC GTC CCC ACC
GL2_START_ Δ _R [Phos] GAG GGC AAA GAC GCC CGT GTA GAA ATC G
GL2_START_flank_right_F GTC TTC TTC ATG GCT ACC AAC GTC
GL2_START flank_left_R GAG GGC AAA GAC GCC CGT GTA
GL2_ATML1_START_F GGC GTC TTT GCC CTC GAG GCT GAT AAG CCT ATG ATT G
GL2_ATML1_START_R AGC CAT GAA GAA GAC GAG CCG CTC ACA TTG GCG GTC
GL2_EDR2_START_F GGC GTC TTT GCC CTC AAC CAA GCA TTT TCC AGG AA
GL2_EDR2_START_R AGC CAT GAA GAA GAC CCA CCC TTT TAG ATC AAT TTG
GL2_REV_START_F GGC GTC TTT GCC CTC GAG GAG ACT TTG GCA GAG TTC
GL2_REV_START_R AGC CAT GAA GAA GAC CCG CAA CGC GGA AAT GGT CA
GL2_mStAR_START_F GGC GTC TTT GCC CTC GAC CAG GAG CTG TCC TAC ATC C
GL2_mStAR_START_R AGC CAT GAA GAA GAC GCT GGC TTC CAG GCG CTT GC
II. Gene specific primers for PCR amplification and cloning of START domain coding regions in GSV plasmids.
Name
5’-3’ sequence
At1g64720_for_KpnI_218 CTCACCACGTTAACCCCGGTACCTCTTCCAAAGAG At1g64720_rev_SacI_945 GTGAGCCATTATGGCGAGCTCGGATAAACCTGCTC At2g28320_for_KpnI_418 TTGAGTAGCTCAGGTACCGACCATCACTCAAACTC At2g28320_rev_SacI_1151 CTTGCACTTCTTGGAGCTCCCCCTGACGACAG At3g13062_for_KpnI_201 CTCGGTTTCTCAATCTGGTACCTCCCAATCAGG At3g13062_rev_SacI_934 AGCTTACAGCGAGCTCTGTGGGCCCTTGGGGTCG At4g14500_for_KpnI_365 TGGCCTCAAGAGGTACCGATAACGGG At4g14500_rev_SacI_1084 CCATTTGGGCGAGCTCAGATAGAGATGAGTCTG At5g07260_for_KpnI_229 CTATATCCCGGTACCGCTACGTCTTTGACTG At5g07260_rev_SacI_952 CTGGTCGAATATGAGCTCATTGTGACCAATTGAAGG At5g35180_for_KpnI_634 CAAGGTCCAGGTACCCTTTTGAGGCAATCATC At5g35180_rev_SacI_1382 TGGAACTTGGAGAGCTCAACCGTGGCGGAAG At5g45560_for_KpnI_487 AGGACAACTATTGGTACCGGCCCTCCAGAATC At5g45560_rev_SacI_1229 GATGCCATATTGAGCTCAACAGGGATCCTGATCGG At5g54170_for_KpnI_344 TTTCAAGAGGTACCAAAACAAAGGAGAGATTGCC At5g54170_rev_SacI_1065 CATGAAAGCAGACCGGAGCTCCTTGGTTCCTCCANL2 outer F_824 CCTCCTTAGAACTCGCTGTCGGCACC
ANL2 outer R_1780 GCTTGCTCCAATTGTGGACCGACG
ANL2_for_KpnI_915 GCAGCAGCAGCAGTCGGGTACCATTAATGGG
ANL2_rev_SacI_1685 GGCGTTATTGATGTGAGCTCGTGAGATGTAACGG
ATHB8_for_ KpnI_429 GACCCCTGGTACCCAGCCTCGTGATGC
ATHB8_rev_ SacI_ GCCGCTGGTCTGAGCTCCCAACCTG
ATML1_for_ KpnI_ ACATTTTGAGGTCGGGTACCATACCTTCTGAGGC
ATML1_rev_ SacI_ CAGGACTCGTTATCACGGAGAGCTCACAAGC
CNA_for_ KpnI_432 GGCATCTGGTACCCCTCAGAGAGATGC
CNA_rev _SacI_1162 GACGCCGTCCGAGCTCATTAACACTAC
FWA outer F_450 GGCTGAGAATGCTAACTTGGAGCGGG
FWA outer R_1440 GCCACTTGTCCACCGAAGGACTCG
GL2_rev_ SacI_A_ CTTTGGTGAGCTCGTTGGTAGCCATGAAGAAGAC
GL2_for_ KpnI_B_ TCGGCTCTCTCGGTACCTACACGGGCGTC
GL2_rev_ SacI_B_ TGTAACTCCGAGCTCGTCTTTGGTGGGGACG
GL2_for_KpnI _728 TCTACACGGGTACCTTTGCCCTCGAGAAGTCCCG GL2_rev_SacI_1500 TCCGAGAGAGAGCTCGGTGGGGACGTTGGTAG HDG1_for_KpnI_910 CAACCGGGTACCGTTAGTGATTTTGATC HDG1_rev_SacI_1674 GCAGTTTATAGGGGATGGGAGCTCGGAAGTGG HDG2_for_deltaSacI_759 CGTGGCTGCAATGGAAGAACTCATGAGGATGGT HDG2_rev_deltaSacI_791 ACCATCCTCATGAGTTCTTCCATTGCAGCCACG HDG2_for_deltaSacI_1038 AGGAAACTATAATGGAGCCCTTCAAGTGATGAGTGC HDG2_rev_deltaSacI_1073 GCACTCATCACTTGAAGGGCTCCATTATAGTTTCCT HDG2_for_KpnI_712 ATCACTGCAGGTACCGAATCTGACAAACC HDG2_rev_SacI_1415 GTAGCCATGACGAGCTCTAACCGCTCGC HDG3 outer F (625-650) CATCCCCGTGTGTCTCCTCCTAATCC HDG3 outer R (1511-1537) TGGTCATTCCAGCAAAGAAGGTTCTCG HDG3_for_KpnI CCACTCGAGGGAAACCGGTACCCCTGCAGATGC HDG3_rev_SacI TCTTTCCATGGTTAGTTAGCGCGAGCTCGACAG HDG4 outer F (539-562) CTTGTGGCCACAATCTCCGCCTCG HDG4 outer R (1447-1475) TGTGACAGCTTCATCAAGTTCTTCCTCGC
HDG4_for_ KpnI AAGAACAACAACGATGGTACCTTGATTGCGG
HDG4_rev_SacI AGGTATGAGCTCAAGGTCAGTGATGTTTGTAGC
HDG5 outer F (808-836) GACATGAGTGTATACGCTGGGAACTTTCC
HDG5 outer R (1766-1791) GGTCCAAGACTGTCCATATGCAGTGC
HDG5_for_KpnI CAACAACGGTACCTTACTTGCGGATGAAGAAAAGG
HDG5_rev_ SacI GCAGATGAAATTACGAGCTCATCAGTTATGTTTCTAGC
HDG8_for_deltaSacI_649 AGTGCGGTTGAAGAGCTGAAGCGGCTGTTTTTGGC HDG8_rev_deltaSacI_683 GCCAAAAACAGCCGCTTCAGCTCTTCAACCGCACT HDG8_for_KpnI_597 ACCACGACCAGGTACCGAAACGGATATGAGCC HDG8_rev_SacI_1322 ATGGAGGAGAGCTCCATCCTCTCACAC HDG9_outer_F_571 TTCTAACCGTCTCCCCGAGCCTTCAAGC HDG9_outer_R_1547 GACTGTGGCGAGAAGTCGAGTTTGTTAACC HDG9_deltaSacI_F_1329 CTTTGGCTACGGAGCCCGACGTTGGACCG HDG9_deltaSacI_R_1357 CGGTCCAACGTCGGGCTCCGTAGCCAAAG HDG9_for_KpnI_669 GGAAATGCAGAATGGTACCCCACTATCTCAACTGG HDG9_rev_SacI_1437 AACTCCGGGATTGAGCTCGTTGGGCAAGGC HDG11_for_deltaKpnI_1000 CAGGAATGGGAGGTACGCATGAGGGTGC HDG11_rev_deltaKpnI_1028 GCACCCTCATGCGTACCTCCCATTCCTG HDG11_for_KpnI_663 GCCTAACTTGGCTGGTACCGACATGGATAAGCC HDG11_rev_SacI_1400 GAAGACGCTGGTACGGATAGGAGCTCAAATCTTTCACAC
HDG12_for_ KpnI_592 CCATCTCAGCCAGGTACCGTTTTATCAGAGATGG
HDG12_rev SacI_1361 ACTCCTCCGAGCTCAAGGGATGATG
MLN64_deltaSacI_F_867 GCCCTGTCCTGCGGAGCTTGTGTACCAGG
MLN64_deltaSacI_R_867 CCTGGTACACAAGCTCCGCAGGACAGGGC
MLN64_for_ KpnI_ TCCTTTGCAGGTACCGACAATGAATCAGATGAAGAAG
MLN64_rev_ SacI_ TATCAGAGCTCCGCCCGGGCCCCC
PCTP_for_ KpnI_ GACTGCGGTACCATGGAGCTGGCCGCCG
PCTP_rev_ SacI_ TCAACCCATGGATGCAATGTTCCGAGCTCTCTTTCATAGG
mStAR_for_ KpnI_ GTCAGTCCTTGGTACCCAACTGGAAGCAACACTC
mStAR_rev_ SacI_ TTAACACTGGAGCTCAGAGGCAGGGCTGGC
III. Primers for sequencing plasmid inserts, construction of GV plasmid, or cloning of the yEGFP3 expression vector (pUG35) and protein expression vector BG1805
Name 5’-3’ sequence GSV_seq_for TCCCAAAACCAAAAGGTCTCCGCTG GSV_seq_rev CCCCAACATGTCCAGATCGAAATCG Gal4DBD_for_1 ATGAAGCTACTGTCTTCTATCGAAC Gal4DBD_rev_276 CAATGCTTTTATATCCTGTAAAGAATCC Gal4_NruI_for_282 TACCCCTGCAGCTGCGTCGCGACTAGAGGATCC Gal4_NruI_rev_314 GGATCCTCTAGTCGCGACGCAGCTGCAGGGGTA VP16_NruI_for_1182 TGCGGGCTCTACTTCATCGTCGCGACACTTAGACGGCG VP16_NruI_rev_1219 CGCCGTCTAAGTGTCGCGACGATGAAGTAGAGCCCGCA pUG35_seq_3117R_MET25p TTCCTTCGTGTAATACAGGGTCG pUG35_seq_2964F_yEGFP ACCAAAATTGGGACAACACCAGTG pUG35_MET25p_for_207 GCACCTTGTCCAATTGAACACGC pUG35_yEGFP_rev_730 ACCTTCTGGCATGGCAGACTTG pUG35_for_ATG CATCCATACTCTAGAATGAGTGGATCCCCCGGGC pUG35_rev_ATG GCCCGGGGGATCCACTCATTCTAGAGTATGGATG pGSV_for_BamHI AAGCAAGGATCCTGAAAGATGAAGCTACTGTC pGSV_rev_EcoRI TCGCGCGAATTCCCCACCGTACTCG pGS_rev_EcoRI ACTATAGGGCGAATTCGAGCTCCACC pG_rev_EcoRI GTCTAAGTGGAATTCGGTACCTAACAATGC
GSV_for_pENTR TOPO CACCATGAAGCTACTGTCTTCTATCGAAC
GSV_rev_pENTR TOPO TGCCCCACCGTACTCGTCAATTCCAAG
IV. Primers for site-directed mutagenesis of mouse StAR START domain
Name 5’-3’ sequence
StAR M143R;N147D_for (atg->agg;aac->gac)
GC ATG GAG GCC AGG GGA GAG TGG GAC CCA AAT GTC
StAR M143R;N147D_rev GAC ATT TGG GTC CCA CTC TCC CCT GGC CTC CAT GC
StAR R181L;D182L_for (cga->cta;gac->ctc)
CTG GTG GGG CCT CTA CTC TTC GTG AGC GTG CGC
StAR R181L;D182L_rev GCG CAC GCT CAC GAA GAG TAG AGG CCC CAC CAG
StAR R181L_for (cga->cta) G GGG CCT CTA GAC TTC GTG AGC GTG CG
StAR R181L_rev CG CAC GCT CAC GAA GTC TAG AGG CCC C
StAR D182L_for (gac->ctc) CTG GTG GGG CCT CGA CTC TTC GTG AGC GTG CGC
StAR D182L_rev GCG CAC GCT CAC GAA GAG TCG AGG CCC CAC CAG
StAR C224R_for (tgc->cgc) GAA CAC GGC CCC ACC CGC ATG GTG CTT CAT CC
StAR C224R_rev GG ATG AAG CAC CAT GCG GGT GGG GCC GTG TTC
StAR L241R_for (ctg->cgg) CC AAG ACT AAA CTC ACT TGG CGG CTC AGT ATT GAC C
StAR L241R_rev G GTC AAT ACT GAG CCG CCA AGT GAG TTT AGT CTT GG
StAR F266D_for (ttc->gac) CC TA TCG CAG ACC CAG ATA GAG GAC GCC AAC CAC C
StAR F266D_rev G GTG GTT GGC GTC CTC TAT CTG GGT CTG CGA TA GG
StAR L270M_for (ctg->atg) GAG TTC GCC AAC CAC ATG CGC AAG CGC CTG G