R E S E A R C H A R T I C L E
Open Access
Whole human genome proteogenomic mapping
for ENCODE cell line data: identifying
protein-coding regions
Jainab Khatun
1*, Yanbao Yu
2, John A Wrobel
2, Brian A Risk
1, Harsha P Gunawardena
2,3, Ashley Secrest
1,
Wendy J Spitzer
1, Ling Xie
2, Li Wang
2, Xian Chen
2,3and Morgan C Giddings
1,2Abstract
Background: Proteogenomic mapping is an approach that uses mass spectrometry data from proteins to directly map protein-coding genes and could aid in locating translational regions in the human genome. In concert with the ENcyclopedia of DNA Elements (ENCODE) project, we applied proteogenomic mapping to produce
proteogenomic tracks for the UCSC Genome Browser, to explore which putative translational regions may be missing from the human genome.
Results: We generated ~1 million high-resolution tandem mass (MS/MS) spectra for Tier 1 ENCODE cell lines K562 and GM12878 and mapped them against the UCSC hg19 human genome, and the GENCODE V7 annotated protein and transcript sets. We then compared the results from the three searches to identify the best-matching peptide for each MS/MS spectrum, thereby increasing the confidence of the putative new protein-coding regions found via the whole genome search. At a 1% false discovery rate, we identified 26,472, 24,406, and 13,128 peptides from the protein, transcript, and whole genome searches, respectively; of these, 481 were found solely via the whole genome search. The proteogenomic mapping data are available on the UCSC Genome Browser at http://genome. ucsc.edu/cgi-bin/hgTrackUi?db=hg19&g=wgEncodeUncBsuProt.
Conclusions: The whole genome search revealed that ~4% of the uniquely mapping identified peptides were located outside GENCODE V7 annotated exons. The comparison of the results from the disparate searches also identified 15% more spectra than would have been found solely from a protein database search. Therefore, whole genome proteogenomic mapping is a complementary method for genome annotation when performed in conjunction with other searches.
Keywords: Proteogenomic mapping, MS/MS spectra, Genome annotation, Proteomics, Genomics Background
The human genome holds many secrets – the deeper
we peer, the more we uncover. In 2003, the National Human Genome Research Institute (NHGRI) launched a pilot project called the ENCyclopedia Of DNA Ele-ments (ENCODE) to analyze 44 euchromatic regions of the human genome. The pilot project revealed surpris-ing results, such as pervasive intragenic and intergenic transcription, new intronic and intergenic exons, over-lapping transcripts, and distant transcriptional start
sites, challenging the conventional model of genes and their transcription [1].
Following these successes, the NHGRI expanded ENCODE to study the entire human genome, to pro-vide the scientific community with a comprehensive list of functional elements including protein-coding and non-coding transcripts, transcriptional regulatory regions, histone marks, and more. In the production phase, the ENCODE Consortium produced deep data via extensive high-throughput experiments in combin-ation with both novel and existing computcombin-ational techniques [2,3].
* Correspondence:[email protected]
1College of Arts and Sciences, Boise State University, Boise, ID, USA
Full list of author information is available at the end of the article
© 2013 Khatun et al.; licensee BioMed Central Ltd. This is an Open Access article distributed under the terms of the Creative Commons Attribution License (http://creativecommons.org/licenses/by/2.0), which permits unrestricted use, distribution, and reproduction in any medium, provided the original work is properly cited.
Despite these efforts, the transcribed regions of the genome that are translated into proteins, versus those that serve some other role, remain elusive. GENCODE, a sub-project of ENCODE, has performed an exhaustive manual annotation of the human genome to identify protein-coding transcripts, and though this is likely the most comprehensive human genome annotation to date, the evidence for protein-coding capacity has come mostly from indirect sources, not from the measure-ment of proteins themselves. About 50% of human tran-scripts are classified as non-protein-coding [2]. While many do not resemble known protein-coding tran-scripts, some do not appear to be non-coding functional RNAs either, hence their roles remain unclear.
Proteogenomic mapping is a process that has been used for various organisms to help identify protein-coding regions and transcripts, by mapping mass spectrometry (MS) data from biologically-derived proteins directly to genomic and/or transcript sequences [4-8]. This approach has been used to identify new genes, new alternative splice variants, new translational start sites, new upstream open reading frames (ORFs), and has also been used to classify pseudogenes as protein-coding [4-6,8-17]. For instance, Menon et al. conducted a large-scale analysis of MS data from the plasma proteome of a mouse model of human
pancreatic cancer. The study employed a non-redundant database containing a 3-frame translation of Ensembl transcripts and gene models from the ECgene database, which identified 92 novel protein variants [14]. Recently, Brosch et al. performed proteogenomic mapping using Augustus-predicted transcripts from the mouse genome. They discovered 10 novel protein-coding genes, novel alternative splice forms for 53 genes, and classified 9 pseudogenes as protein-coding [9].
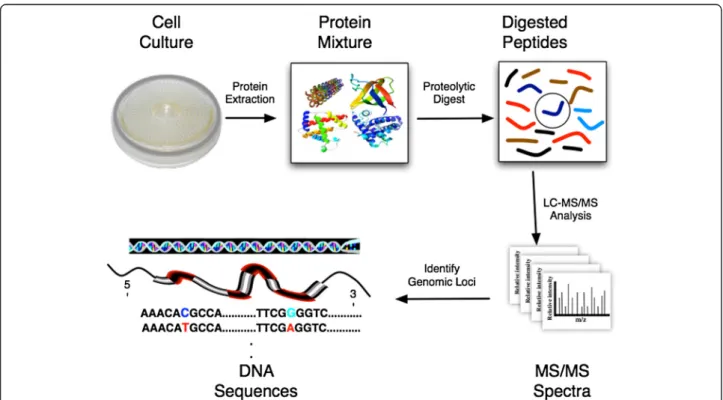
Bottom-up proteomics is the most widespread means of proteogenomic mapping. Briefly, cells are collected or cul-tured then lysed, often followed by subcellular fraction-ation. Proteins are extracted then cleaved proteolytically into peptides, either by direct in-solution digestion, or after gel-based separation followed by in-gel digestion. The proteolytic peptides are separated to reduce sample complexity before introduction into the mass spectrom-eter [18]. In tandem MS (MS/MS), the mass spectromspectrom-eter measures the mass-over-charge (m/z) of each peptide ion, sequentially breaks it along the peptide backbone, then measures the m/z of the resulting pieces. The series of fragment masses provides a signature that can then be used to identify the peptide from a database search [19-25] or by de novo sequencing [26,27]. When the reference database used to identify peptides (and
Figure 1 Overview of bottom-up proteomics and proteogenomic mapping. After cell lysis, proteins are extracted from a biological sample and are proteolytically digested into peptides. The peptide mixture is commonly separated by liquid chromatography and introduced into a tandem mass spectrometer, which produces MS/MS spectra. The resulting spectra are matched against an in silico translation and proteolytic digestion of genomic DNA sequences in all six reading frames to identify peptides. The matched peptides are then mapped back to the DNA sequences to identify the genomic loci for the analyzed proteins.
therefore proteins) contains DNA sequences (genome, transcripts, predicted transcripts, etc.), the process is termed proteogenomic mapping [8] (Figure 1).
Prior proteogenomic mapping efforts of the human gen-ome relied primarily on databases of putative ORFs, full-length cDNAs, or a combination of various predicted transcripts [11,16,17,28]. However, our ability to correctly predict protein-coding transcripts is limited, and hence the approaches that rely on predictions may also be lim-ited. To our knowledge, the most recent human gen-ome proteogenomic work was done by Bitton et al., which identified 346 novel peptides at a 5% FDR [29]. However, they first performed a series of pre-screening searches which dramatically reduced the database size before beginning the human genome proteogenomic mapping process.
Whole genome proteogenomic mapping is an alter-native approach that does not rely on transcript or gene prediction. It has the drawback that the larger genome database reduces sensitivity, yet it has one significant strength: its ability to find putative protein-coding exons outside of known or predicted genic regions. As such, it can be seen as a complementary method to protein or transcript database searches: the methods performed in conjunction with one other will likely yield maximal coverage of the proteo-genome. The ap-plications and challenges of proteogenomic mapping have been reviewed in a recent publication [30].
In this manuscript, we describe an effort to perform proteogenomic mapping of the human genome as part of the ENCODE project. We produced proteomic data using the ENCODE Tier 1 cell lines K562 and GM12878. Pro-teins from each cell line were derived via front-end sample preparation protocols including subcellular fractionation, GELFREE fractionation [31], filter-aided sample prep-aration (FASP) [32], and microwave-assisted tryptic digestion [33]. Peptides were analyzed on an LTQ Orbitrap Velos mass spectrometer (Thermo Scientific) to produce ~1 million high-resolution MS/MS spectra. We mapped these spectra against the UCSC hg19 whole hu-man genome, and against GENCODE V7 protein and tran-script databases, and then compared the results from all three searches to identify the best-matching peptide for each spectrum. This comparison increased the confidence of the identification of the putative new protein-coding exons found from the whole genome search and also aug-mented the total number of spectral identifications.
Results
We performed shotgun proteomic analyses for two ENCODE Tier 1 cell lines and mapped the resulting 998,570 MS/MS spectra against the GENCODE V7 protein and transcript databases, as well as the whole human genomic sequence (UCSC hg19). We then
compared the results from all three searches to iden-tify the best-matching peptide for each spectrum. The complementary nature of this comparative analysis provided confidence for the identification of non-exonic peptides located outside the GENCODE V7 an-notation, in addition to identifying 15% more spectra than would have been identified solely from a protein database search.
GENCODE V7 protein and transcript search results
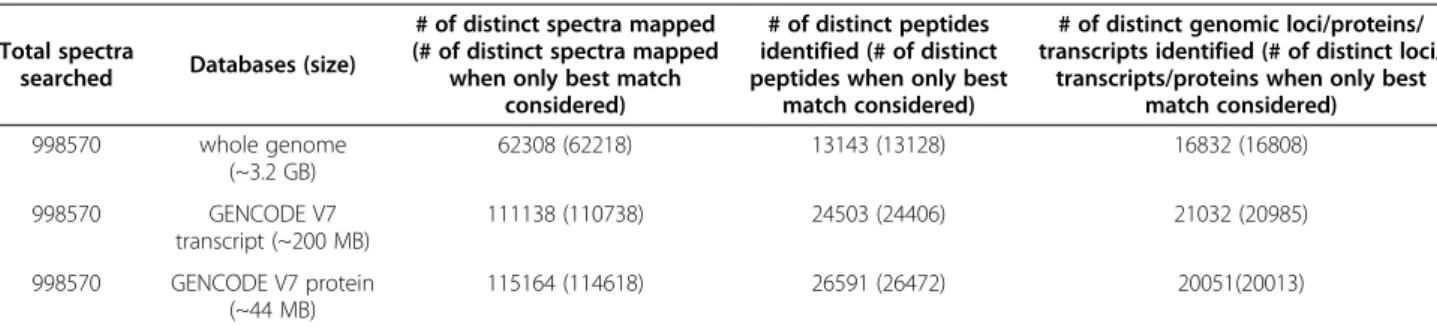
We searched the 998,570 MS/MS spectra against the GENCODE V7 annotated protein set. We enzymatically digested each of these proteins in silico and scored the resulting peptides against each MS/MS spectrum using the HMM_Score algorithm [22]. The search resulted in identifying 20,051 proteins from 26,591 distinct peptides matching to 115,164 MS/MS spectra, at a 1% false dis-covery rate (FDR) (Table 1). The distribution of peptide identifications for these proteins is shown in Figure 2.
We also performed proteogenomic mapping against GENCODE V7 annotated transcripts using the same set of spectra. We performed a 3-frame translation of 84,408 GENCODE V7 transcripts (which only included mRNAs) and constructed a protein database where each stop codon represented the end of one protein and the be-ginning of another. We then enzymatically digested those proteins in silico and scored the resulting peptides against each MS/MS spectrum. The search resulted in finding translational evidence for 21,032 transcripts, by identifying 24,503 distinct peptides from 111,138 MS/MS spectra, at a 1% FDR (Table 1 and Figure 2).
Whole human genome search results
In whole genome proteogenomic mapping, spectra are matched to peptides produced from an in silico transla-tion and proteolytic digestransla-tion of genomic sequences in all six reading frames [7]. The matched peptides are then mapped back to the DNA sequences to identify the gen-omic loci for the analyzed proteins. The whole genome search identified 13,143 distinct peptide sequences, matching to 62,308 MS/MS spectra, at an estimated 1% FDR. These peptides corresponded to 16,832 distinct genomic loci. Because many different spectra can match to a single peptide, and because a given peptide se-quence can reside in different places in the genome, the number of peptides and the number of genomic loci dif-fer from the number of spectra.
Comparison of GENCODE V7 protein, transcript, and hg19 whole genome search results
One of the goals of this study was to explore what per-centage of proteins may be missing from the current protein database annotation, and therefore how many additional MS/MS spectra could be identified from an
unbiased, whole human genome proteogenomic map-ping effort. To increase the confidence of all identifica-tions, we compared the results from the three different searches and identified the best-matching peptide for each MS/MS spectrum, regardless of which search yielded that best peptide-spectrum match (PSM). For a given spectrum, if two different best-ranking pep-tides from two different databases were identified, then the PSM with the highest HMM_Score was taken as the ‘correct’ identification, and the others were re-moved from the results.
This comparison resulted in finding 1,036 spectra that matched to different top-ranking peptides in the differ-ent databases. Scrutiny of these results revealed that 546 spectra identified from the protein database search had better matches from either the genome or the transcript searches, and 400 spectra from the transcript search had better matches from either the genome or the protein
database searches. Similarly, 90 spectra identified from the genome search had better matches in the protein or transcript database searches.
We considered only the best-matching peptides from all three searches, i.e., those retained after removing the 546, the 400 and the 90 spectral hits from the protein, transcript and genome searches, respectively. After removal, the GENCODE V7 protein search identified 26,472 distinct peptides belonging to 20,013 proteins from 114,618 MS/ MS spectra; the transcript search identified 24,406 distinct peptides belonging to 20,985 transcripts from 110,738 MS/ MS spectra; and the whole genome proteogenomic search identified 13,128 peptides from 62,218 MS/MS spectra cor-responding to 16,808 distinct loci (Table 1). The combin-ation of the results of all three searches identified 28,530 peptides from a total of 131,586 MS/MS spectra, at a 1% FDR. The combination and comparison of results identi-fied 16,968 additional MS/MS spectra and 2,058 additional
Table 1 Total spectra searched and identified from whole genome, GENCODE V7 transcript and protein searches
Total spectra
searched Databases (size)
# of distinct spectra mapped (# of distinct spectra mapped
when only best match considered)
# of distinct peptides identified (# of distinct peptides when only best
match considered)
# of distinct genomic loci/proteins/ transcripts identified (# of distinct loci/
transcripts/proteins when only best match considered) 998570 whole genome (~3.2 GB) 62308 (62218) 13143 (13128) 16832 (16808) 998570 GENCODE V7 transcript (~200 MB) 111138 (110738) 24503 (24406) 21032 (20985) 998570 GENCODE V7 protein (~44 MB) 115164 (114618) 26591 (26472) 20051(20013)
Results presented are at a 1% FDR. The bracketed numbers represent the number of identifications after comparing the results from the three searches and keeping only the best match.
Figure 2 The distribution of the number of peptide hits per protein/transcript. The x-axis represents the number of protein/transcripts and the y-axis represents the number of peptides that matched to that number of protein/transcripts. Only proteins/transcripts matched to 2 or more peptides are considered in the distribution. The points in blue represent the peptide hits from the GENCODE V7 annotated proteins, while the red points represent those from the GENCODE V7 annotated transcripts.
peptides which would not have been found from a protein database search alone.
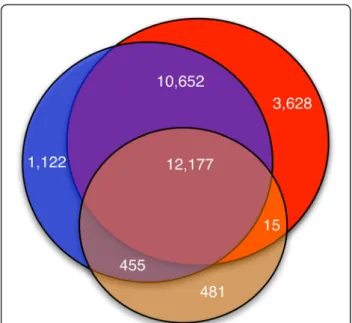
When we performed a cross comparison, the same 12,177 unique peptides were identified from all three searches. There were 3,628 best-matching peptides iden-tified solely from the protein database search, 1,122 identified solely from the transcript search, and 481 identified solely from the whole genome search. A Venn diagram of these peptide identifications is shown in Figure 3, which shows that 1,577 peptides were identi-fied from the transcript search but were not identiidenti-fied from protein database search. We closely examined these 1,577 identified peptides to ascertain whether they were due to frame shift or non-coding transcript transla-tion. We found that 77 of 1,577 (~5%) identified pep-tides were products of frame shifting, while 313 (~20%) were due to the translation of non-coding transcripts. The remaining 1,187 (~75%) peptides belong to novel alternative spliced forms of known protein-coding tran-scripts, and were located in untranslated regions (UTRs) or in UTR-exon boundary regions.
For the purpose of this investigation, we believed the best-matching peptide should be taking as the ‘correct’ identification, though within the 1% FDR, occasionally the peptide identified by the algorithm as the second- or third-best match may actually represent the ‘correct’
match. To mitigate this possibility, we kept the FDR ap-propriately conservative (1%); however, we acknowledge the fact that the peptide ranked highest by the algorithm may not always represent the‘correct’ identification.
Analysis of unique proteogenomic matches against wgEncodeGencodeCompV7
To provide a more precise picture of what can be gained from a proteogenomic search, we focused on our unique matches – matches for which the identified peptide ap-pears at only one site in the genome. The subset of unique matches was composed of 48,012 distinct MS/ MS spectra, which matched to 11,540 unique peptide se-quences, hence 11,540 genomic loci. Several spectra matching to the same peptide lends extra support for the validity of the match, and can be used as an approxi-mate relative quantitative measure of protein abundance [34]. We uploaded our uniquely mapping proteogenomic results from the whole genome search as a custom track to the UCSC Table Browser to compare them against GENCODE V7 annotated genes.
When these 11,540 unique peptides were compared against the GENCODE V7 annotation, 11,120 were found to be exonic and the remaining 420 were non-exonic. In this paper, we take the terms‘exonic’ and ‘non-exonic’ to mean exonic/non-exonic according to the GENCODE V7 annotation. We performed an analysis and found that of those 420 non-exonic matches, 72 corresponded to in-tronic regions and 348 corresponded to intergenic regions. Figure 4 shows unique proteogenomic mapping matches outside the GENCODE V7 annotation. The lo-cation was identified from multiple MS/MS spectra from two distinct precursor m/z sets. The same location has RNA-Seq evidence from ENCODE/Caltech.
Other evidence related to unique, non-exonic matches
The 420 unique, non-exonic matches could represent new genic regions, new isoforms of known genes, or false dis-coveries that fall within the 1% FDR. We attempted to de-termine whether there was other supporting evidence for these matches by searching for expression data and pre-dicted exons.
Using the UCSC Table Browser, we examined all unique, non-exonic matches for evidence of transcrip-tional activity and/or predicted exons, using: HAIB RNA-Seq data (wgEncodeHaibRnaSeqA549Dex100nm RawRep1); GENSCAN gene predictions (genscan); Hu-man ESTs (all_est); Burge RNA-Seq data (burgeRnaSeq GemMapperAlignBT474); Ensembl exons (acembly); UW Affy Exon Array data (wgEncodeUwAffyExonArray Gm12878SimpleSignalRep1v2); and Duke Affy Exon Array data (wgEncodeDukeAffyExonGm12878SimpleSig nalRep1). Information about each of these datasets can be found with their individual tracks on the UCSC Figure 3 Venn diagram of distinct peptide identifications from
the protein, transcript, and whole genome searches. The deep red segment in the center represents the 12,177 peptides identified from all three searches. The segment in red represents the 3,628 peptides identified solely from the GENCODE V7 protein search; the blue segment represents the 1,122 peptides identified solely from the GENCODE V7 transcript search; and the brown segment represents the 481 peptides identified solely from the whole genome search.
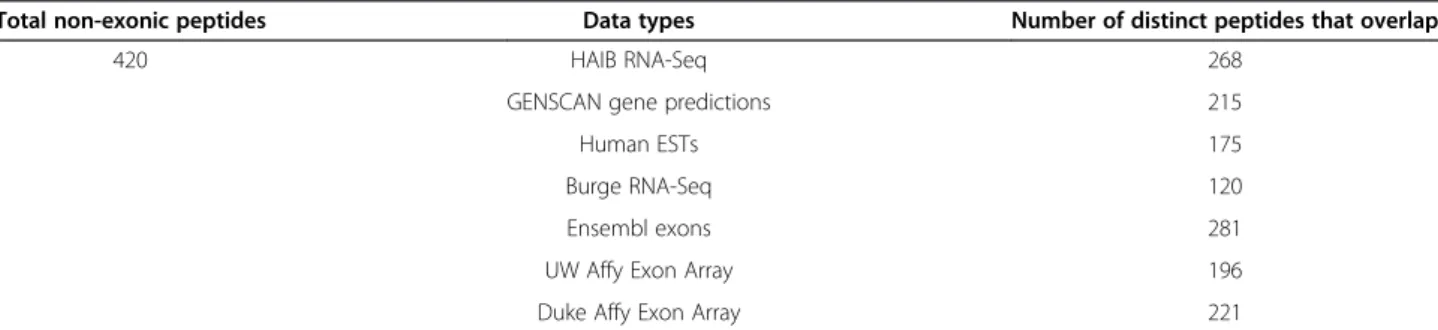
Genome Browser. Of the 420 unique, non-exonic matches, 268 overlapped with the HAIB RNA-Seq data; 215 overlapped with GENSCAN predicted exons; 175 overlapped with human ESTs; 120 overlapped with Burge RNA-Seq data; 281 overlapped with Ensembl exons; 196 overlapped with WU Affy Exon Array data; and 221 over-lapped with the Duke Affy Exon array data (Table 2).
The union of intersection between our unique non-exonic matches and all seven datasets is 368, i.e., each of these 368 unique hits had at least one other piece of sup-portive evidence, either transcriptional evidence or pre-dicted exons. Similarly, the central intersection from all seven datasets, i.e. the matches for which all seven datasets overlapped, was 14. The results indicate that ~88% (368/ Figure 4 An example of unique GENCODE V7 intergenic proteogenomic matches. Panel A shows that these unique proteogenomic matches overlap with a protein-coding exon predicted by NScan. Blue boxes represent proteogenomic matches, green boxes represent predicted protein-coding exons, and black lines represent introns. Panel B summarizes the total MS/MS spectral support for each of the two matches in this region, where each vertical dark blue bar represents a distinct spectral match for the same peptide, with the height of the bar showing the E-value for the identification (E-E-values ranging from 1.0×10⁻¹to 1.0×10⁻⁴). More and/or taller bars indicate stronger support. Panel C shows ENCODE/Caltech RNA-Seq evidence and other transcriptional data for the same region. Both matches are identified from multiple spectra, indicating relatively strong support.
Table 2 Unique GENCODE V7 non-exonic peptides and their overlap with different expression data and predicted exons
Total non-exonic peptides Data types Number of distinct peptides that overlap
420 HAIB RNA-Seq 268
GENSCAN gene predictions 215
Human ESTs 175
Burge RNA-Seq 120
Ensembl exons 281
UW Affy Exon Array 196
Duke Affy Exon Array 221
420) of our unique proteogenomic matches were sup-ported by either predicted exons or by the presence of transcriptional activity. When we examined the remaining 52 matches for which there was no corroborating evidence, we found that 3 were intronic and 49 were intergenic.
Proteogenomic tracks to UCSC genome browser
To facilitate the interpretation of proteogenomic data within a genomic context, we produced UCSC bed tracks. The ENCODE proteogenomic tracks were submitted to the ENCODE Data Coordination Center (DCC) at UCSC in accordance with ENCODE data standards. Though only the best-matching peptides at a 1% FDR are presented in this manuscript, the uploaded results include first-, second- and third-ranked peptides at a 5% FDR, to con-form to ENCODE standards. The tracks can be browsed to see where and how proteogenomic data line up with other types of evidence, such as human ESTs, RNA-Seq, etc. (Figures 4 and 5), and can be accessed at http://gen-ome.ucsc.edu/cgi-bin/hgTrackUi?db=hg19&g=wgEncode UncBsuProt. Figure 5 shows a UCSC Genome Browser screen shot illustrating the alignment between our proteogenomic mapping loci and several other annota-tion sets for chromosome 1.
Discussion
We produced MS/MS spectra from two ENCODE Tier 1 cell lines and searched them against GENCODE V7 anno-tated protein and transcript sets, as well as against the standard human genome sequence (UCSC hg19). To achieve as complete proteomic coverage as possible, we used spectra from two cell lines, rather than from a single line: this approach provided us with ~1 million high-quality
spectra to facilitate large-scale proteogenomic analysis. We also employed a combination of strategies to increase the coverage of the analyzed proteins, such as filter-aided sam-ple preparation, microwave-assisted in-filter digestion, and subcellular fractionation. We also used a state-of-the-art Eksigent Ultra-LTQ Orbitrap mass spectrometer which im-proved the accuracy of mass measurements and provided a more complete fragmentation pattern.
In addition, we compared the results from the three different database searches to identify which PSM from which search was scored highest by the HMM_Score al-gorithm. We found that though whole genome mapping is a less sensitive method, it identified 481 putative novel peptides because they do not belong in annotated exons. These peptides could come from protein isoforms whose corresponding mRNAs have either not yet been captured in an expression database, or whose mRNAs are not cur-rently annotated as protein-coding. These results indicate that a search using a set of annotated transcripts or a standard protein database may miss crucial supporting evi-dence for new alternative splices and possibly for un-annotated genes. Performing proteogenomic mapping using both transcript and whole genome sequences identi-fied ~15% more MS/MS spectra than would have been found solely by the protein database search. These searches are complementary: when performed in conjunction with one another, they improve the total coverage of proteomic identifications.
We uploaded browsable bed files to the UCSC Genome Browser, which offers a unique opportunity to inspect proteomic data within the context of other genomic data. From the alignment between our proteogenomic mapping results and different annotation sets, researchers can now
Figure 5 A UCSC Genome Browser screenshot showing proteogenomic coverage across chromosome 1, with several annotation sets. The red line at the top represents our proteogenomic matches. The annotation sets shown here include GENCODE V7, Ensembl, RefSeq, and the UCSC annotation. The black line at the bottom shows the human mRNAs from GenBank.
identify which annotated protein-coding transcripts have confirmatory protein evidence, or if any sequences anno-tated as introns act as protein-coding exons in some dis-ease states. These new proteogenomic mapping tracks could help researchers answer many other questions that could not otherwise be addressed without direct protein evidence.
Future applications of human genome proteogenomic mapping work
Proteogenomic mapping has been used previously to aid in human genome annotation [11,16,17,28]. Whole gen-ome mapping could also be used to further explore many of the unexpected results that have been found using large transcriptional databases. For example, there is evidence that a large number of human cDNAs have an upstream start codon (ATG) preceding the start codon of the longest known ORF [35-37]. A serial ana-lysis of gene expression tags revealed that antisense tran-scripts are far more widespread than previously known [38]. In addition, the ENCODE Consortium found many intergenic, antisense, and chimeric transcripts [1,3].
These novel transcripts require further study to deter-mine whether they encode proteins. Performing an un-biased whole genome proteogenomic mapping could provide support for the translation of small ORFs, anti-sense transcripts, non-coding RNAs, or sites annotated as introns [39]. Whole genome proteogenomic mapping could also aid in biomarker discovery as aberrant splice isoforms and amplicons are known to be associated with many cancers [40-42].
Limitations of whole genome proteogenomic mapping
Whole genome proteogenomic mapping can offer new insights about the translational regions of the human genome; however, the method has some limitations. First, a whole human genome search reduces sensitivity and specificity due to the increased size of the database. Furthermore, incorporating every splice site in an un-biased manner (i.e. between every GT-AG) and consider-ing post-translationally modified peptides would create an unmanageably large database, ultimately increasing false positive assignments.
Moreover, protein expression depends on different cel-lular and developmental conditions, as well as different cell types [43]. We used only one standard genomic se-quence (UCSC hg19) and two different cell cultures not directly related to that genome. Single nucleotide poly-morphisms, copy number variants, and other genetic differences exist between individuals, which produce dif-ferent proteomic profiles. Minor sequencing errors could produce different theoretical proteomic profiles, affect-ing the correctness of the PSMs identified. Both Tier 1 cell lines are cancer-derived, which may present
additional somatic mutations, further complicating pro-tein expression. Therefore, additional proteomic analyses are needed which consider different cellular, develop-mental and genetic variations, as well as different cell types.
Conclusions
In summary, we mapped proteomic data against three dif-ferent databases (protein, transcript, and whole human genome) to confidently identify putative new translational regions of the human genome, and thereby increase the total proteomic coverage. We used a very tight precursor mass tolerance (0.02 Da) and an FDR of 1% to reduce the chance of false positive identifications. The comparison of search results found that ~4% of the peptides identified from the whole genome search were outside GENCODE annotated exons; the approach also identified ~15% more spectra than would have been identified solely from a pro-tein database search.
At present, whole genome proteogenomic mapping of-fers the opportunity to identify peptides that would not be found solely from a protein database search. However, whole human genome proteogenomic mapping is still in its infancy and its current value is only in pinpointing new genomic areas of focus. As improvements are made in mass spectrometry and computer technologies, and once different cellular/developmental conditions and genetic variations are considered, we speculate that proteogenomic mapping, performed in conjunction with other database searches, could significantly increase knowledge about the translational regions of the human genome.
Methods
Mass spectrometry data generation
Cell culture, subcellular fractionation, and sample preparation
Human ENCODE cell lines K562 and GM12878 were cultured in Roswell Park Memorial Institute Medium 1640, supplemented with 10% fetal bovine serum, peni-cillin (100 units/ml), and streptomycin (100 mg/ml). Cells were maintained in a humidified incubator with 5% carbon dioxide at 37°C.
Subcellular fractionation was performed on both cell lines following a common protocol, producing nuclear, mitochondrial, cytosolic, and membrane fractions [44]. For SDS-PAGE separation and in-gel digestion, a standard procedure was followed [45]. For GELFrEE separation, a GELFREE 8100 Fractionation System (Protein Discovery, Knoxville, TN) was used according to the manufacturer’s protocol. The collected protein fractions were further processed using filter-aided sample preparation (FASP) [32] or the GOFAST method [33].
RPLC-MS/MS analysis
Reversed Phase Liquid Chromatography (RPLC) MS/ MS analysis was performed on a nanoLC-Ultra system (Eksigent, Dublin, CA) coupled with an LTQ Orbitrap Velos mass spectrometer (Thermo Scientific, San Jose, CA). ProteoPep™II C18 column (75μm × 15 cm, 300 Å, 5 μm, New Objective, MA) and linear gradient was run from 100% buffer A (0.1% formic acid in H2O) to 40%
buffer B (0.1% formic acid in ACN) in 150 minutes, and then to 80% buffer B for another 30 minutes. Eluted pep-tides were ionized and analyzed in a data-dependent manner using XCalibur software (version 2.1, Thermo Scientific). The top five most abundant precursor ions were selected for further MS/MS analysis. Collision-induced dissociation (CID) was used to fragment pep-tides and then each fragment’s m/z was measured.
Data sets produced
We produced MS/MS spectra for four fractions (nuclear, mitochondrial, cytosolic, and membrane) of both cell lines K562 and GM12878 using SDS-PAGE and GELFrEE. The spectra from the GM12878 cytosolic fraction did not meet quality control standards, so we omitted that fraction from our searches. MS/MS spectra from a duplicate membrane fraction of cell line K562 was also generated using the GOFAST method. Therefore, we obtained eight different sets of data totaling 998,570 MS/MS spectra. All MS/MS spectra in dta format and the proteogenomic mapping re-sults were uploaded to Proteome Commons, accessible via http://giddingslab.org/data/encode/proteome-commons.
Proteogenomic mapping Databases used
We performed proteomic searches against the GENCODE V7 translated protein set, consisting of 84,408 annotated protein sequences . We also used a 3-frame translation and proteolytic digestion of the GENCODE V7 annotated tran-scripts (mRNA of 84,408 annotated protein sequences). Both of these sequences were annotated by the Wellcome Trust Sanger Institute and are available at http://www. gencodegenes.org/releases/7.html. The database sizes for the protein and transcript databases were ~44 MB and ~200 MB, respectively.
We also used a 6-frame translation and proteolytic di-gestion of the whole human genome for our proteo-genomic mapping (UCSC hg19, 2009, available at http:// hgdownload.cse.ucsc.edu/goldenPath/hg19/chromosomes/), resulting in a database size of ~3.2 GB.
Mapping procedure
We used the newly developed Peppy to perform all sear-ches. Peppy is an integrated software capable of processing the whole human genomic sequence in a single run, as well as protein and transcript databases [Risk B and Giddings
MC: Peppy: an all-in-one tool for proteogneomic searching of MS/MS spectra. Manuscript in preparation]. For the whole genome search, Peppy performed an in silico 6-frame translation and proteolytic digestion of DNA se-quences to create a database‘on the fly’. For all searches, we used the HMM_Score algorithm to match and score peptides to spectra [22]. A common proteomic search en-gine such as Mascot or Sequest could have been used to match and score peptides to spectra; however neither pro-gram was designed to easily handle a six-frame translation/ digestion and search of a whole human genome.
For all searches, we used a precursor mass tolerance of 0.02 Da, a fragment mass tolerance of 0.5 Da, allowed one missed cleavage for tryptic digestion, chose mono-isotopic masses for amino acids, and did not consider modifica-tions. The E-value was calculated for each PSM using the method described by Fenyö et al. [46]. The decoy data-bases were derived from the original datadata-bases (target da-tabases) by reversing the target sequences for each of the three databases. The E-value threshold for each search was calculated for a 1% FDR using the decoy database search according to Kall et al. [47].
The thresholds for a specific FDR were calculated for each database individually; these separate calculations were necessary to create FDRs that were meaningful for the varying sizes of each database. For example, the database resulting from the 6-frame translation and di-gestion of the human genome was more than 1000 times as large as that of the protein database, therefore the FDR threshold for the human genome search was higher than that of the protein database. It is important to note that though the thresholds differed based on database size, the resulting FDR was 1% for all three searches. Abbreviations
PSM: Peptide-spectrum match; ORF: Open reading frame; UTR: Untranslated region; MS: Mass spectrometry; MS/MS: Tandem mass spectrometry; m/ z: Mass-over-charge; FDR: False discovery rate; ENCODE: Encyclopedia of DNA elements; UCSC DCC: University of California Santa Cruz data coordination center; FASP: Filter-aided sample preparation; RPLC: Reversed-phase liquid chromatography; CID: Collision-induced dissociation.
Competing interests
The authors declare that they have no competing interests. Authors’ contributions
JK conceived the project, conducted all analyses, and drafted the manuscript. YU, HPG, LW, and LX performed the MS/MS analysis and were advised by XC. JAW ran the MS/MS spectral data using Peppy, the software developed by BAR. WJS was the primary editor of the manuscript (with minor assistance by AS), and MCG directed the project. All authors read and approved the final manuscript.
Acknowledgements
We thank the following funding resources: ARRA stimulus grant 1RC2HG005591 from the National Human Genome Research Institute (NHGRI) to Morgan C. Giddings and Xian Chen, and R01HG003700 from the National Institutes of Health (NIH) to Morgan C. Giddings. We would like to thank David Thomas and Christopher Maier for software and analysis assistance, and the ENCODE Consortium members for their invaluable input.
Author details
1
College of Arts and Sciences, Boise State University, Boise, ID, USA.
2Department of Biochemistry & Biophysics, UNC School of Medicine, Chapel
Hill, NC, USA.3Program in Molecular Biology & Biotechnology, UNC School of Medicine, Chapel Hill, NC, USA.
Received: 10 August 2012 Accepted: 22 February 2013 Published: 28 February 2013
References
1. Birney E, Stamatoyannopoulos JA, Dutta A, Guigo R, Gingeras TR, Margulies EH, Weng Z, Snyder M, Dermitzakis ET, Thurman RE, et al: Identification and analysis of functional elements in 1% of the human genome by the ENCODE pilot project. Nature 2007, 447:799–816.
2. Myers RM, Stamatoyannopoulos J, Snyder M, Dunham I, Hardison RC, Bernstein BE, Gingeras TR, Kent WJ, Birney E, Wold B, Crawford GE: A user’s guide to the encyclopedia of DNA elements (ENCODE). PLoS Biol 2011, 9. 10.1371/journal.pbio.1001046.
3. Bernstein BE, Birney E, Dunham I, Green ED, Gunter C, Snyder M: An Encyclopedia of Human DNA Elements (NCP000). Nature 2012, 489(7414):57–74.
4. Arthur JW, Wilkins MR: Using proteomics to mine genome sequences. J Proteome Res 2004, 3:393–402.
5. Chaerkady R, Kelkar DS, Muthusamy B, Kandasamy K, Dwivedi SB, Sahasrabuddhe NA, Kim MS, Renuse S, Pinto SM, Sharma R, et al: A proteogenomic analysis of Anopheles gambiae using high-resolution Fourier transform mass spectrometry. Genome Res 2011, 21(11):1872–1881. 6. Choudhary JS, Blackstock WP, Creasy DM, Cottrell JS: Interrogating the
human genome using uninterpreted mass spectrometry data. Proteomics 2001, 1:651–667.
7. Giddings MC, Shah AA, Gesteland R, Moore B: Genome-based peptide fingerprint scanning. Proc Natl Acad Sci USA 2003, 100:20–25. 8. Jaffe JD, Berg HC, Church GM: Proteogenomic mapping as a
complementary method to perform genome annotation. Proteomics 2004, 4:59–77.
9. Brosch M, Saunders GI, Frankish A, Collins MO, Yu L, Wright J, Verstraten R, Adams DJ, Harrow J, Choudhary JS, Hubbard T: Shotgun proteomics aids discovery of novel protein-coding genes, alternative splicing, and “resurrected” pseudogenes in the mouse genome. Genome Res 2011, 21:756–767.
10. Castellana NE, Payne SH, Shen Z, Stanke M, Bafna V, Briggs SP: Discovery and revision of Arabidopsis genes by proteogenomics. ProcNat Acad Sci U S A 2008, 105:21034–21038.
11. Fermin D, Allen BB, Blackwell TW, Menon R, Adamski M, Xu Y, Ulintz P, Omenn GS, States DJ: Novel gene and gene model detection using a whole genome open reading frame analysis in proteomics. Genome Biol 2006, 7:R35.
12. Kelkar DS, Kumar D, Kumar P, Balakrishnan L, Muthusamy B, Yadav AK, Shrivastava P, Marimuthu A, Anand S, Sundaram H, et al: Proteogenomic analysis of Mycobacterium tuberculosis by high resolution mass spectrometry. Mol Cell Proteomics 2011, MCP 10(12):M111 011627. 13. Kuster B, Mortensen P, Andersen JS, Mann M: Mass spectrometry allows direct
identification of proteins in large genomes. Proteomics 2001, 1:641–650. 14. Menon R, Zhang Q, Zhang Y, Fermin D, Bardeesy N, DePinho RA, Lu C,
Hanash SM, Omenn GS, States DJ: Identification of novel alternative splice isoforms of circulating proteins in a mouse model of human pancreatic cancer. Cancer Res 2009, 69:300–309.
15. Merrihew GE, Davis C, Ewing B, Williams G, Kall L, Frewen BE, Noble WS, Green P, Thomas JH, MacCoss MJ: Use of shotgun proteomics for the identification, confirmation, and correction of C. elegans gene annotations. Genome Res 2008, 18:1660–1669.
16. Oyama M, Kozuka-Hata H, Suzuki Y, Semba K, Yamamoto T, Sugano S: Diversity of translation start sites may define increased complexity of the human short ORFeome. Mol Cell Proteomics 2007, 6:1000–1006. 17. Tanner S, Shen Z, Ng J, Florea L, Guigo R, Briggs SP, Bafna V: Improving gene
annotation using peptide mass spectrometry. Genome Res 2007, 17:231–239. 18. Washburn MP, Wolters D, Yates JR 3rd: Large-scale analysis of the yeast
proteome by multidimensional protein identification technology. Nat Biotechnol 2001, 19:242–247.
19. Bafna V, Edwards N: SCOPE: a probabilistic model for scoring tandem mass spectra against a peptide database. Bioinformatics 2001, 17(Suppl 1):S13–21.
20. Craig R, Beavis RC: A method for reducing the time required to match protein sequences with tandem mass spectra. Rapid Commun Mass Spectrom 2003, 17:2310–2316.
21. Eng JK, McCormack AL, Yates JRI: An Approach to Correlate Tandem Mass Spectral Data of Peptides with Amino Acid Sequences in a Protein Database. J Am Soc Mass Spectrom 1994, 5:976–989.
22. Khatun J, Hamlett E, Giddings MC: Incorporating sequence information into the scoring function: a hidden Markov model for improved peptide identification. Bioinformatics 2008, 24:674–681.
23. Tabb DL, Fernando CG, Chambers MC: MyriMatch: highly accurate tandem mass spectral peptide identification by multivariate hypergeometric analysis. J Proteome Res 2007, 6:654–661.
24. Wan YH, Yang A, Chen T: PepHMM: a hidden Markov model based scoring function for mass spectrometry database search. Anal Chem 2006, 78:432–437.
25. Zhang Z, Sun S, Zhu X, Chang S, Liu X, Yu C, Bu D, Chen R: A novel scoring schema for peptide identification by searching protein sequence databases using tandem mass spectrometry data. BMC Bioinformatics 2006, 7:222.
26. Fischer B, Roth V, Roos F, Grossmann J, Baginsky S, Widmayer P, Gruissem W, Buhmann JM: NovoHMM: a hidden Markov model for de novo peptide sequencing. Anal Chem 2005, 77:7265–7273.
27. Taylor JA, Johnson RS: Implementation and uses of automated de novo peptide sequencing by tandem mass spectrometry. Anal Chem 2001, 73:2594–2604.
28. Oyama M, Itagaki C, Hata H, Suzuki Y, Izumi T, Natsume T, Isobe T, Sugano S: Analysis of small human proteins reveals the translation of upstream open reading frames of mRNAs. Genome Res 2004, 14:2048–2052. 29. Bitton DA, Smith DL, Connolly Y, Scutt PJ, Miller CJ: An integrated
mass-spectrometry pipeline identifies novel protein coding-regions in the human genome. PLoS One 2010, 5:e8949.
30. Renuse S, Chaerkady R, Pandey A: Proteogenomics. Proteomics 2011, 11:620–630. 31. Tran JC, Doucette AA: Gel-eluted liquid fraction entrapment
electrophoresis: an electrophoretic method for broad molecular weight range proteome separation. Anal Chem 2008, 80:1568–1573.
32. Wisniewski JR, Zougman A, Nagaraj N, Mann M: Universal sample preparation method for proteome analysis. Nat Methods 2009, 6:359–362. 33. Yu Y, Xie L, Gunawardena PH, Khatun J, Maier C, Leerkes M, Giddings M, Chen
X: GOFAST: An integrated approach for efficient and comprehensive membrane proteome analysis. Anal Chem 2012, 84:9008–9014. 34. Vogel C, Marcotte EM: Calculating absolute and relative protein
abundance from mass spectrometry-based protein expression data. Nat Protocols 2008, 3:1444–1451.
35. Yamashita R, Suzuki Y, Nakai K, Sugano S: Small open reading frames in 5′ untranslated regions of mRnas. Comptes Rendus Biologies 2003, 326:987–991. 36. Morris DR, Geballe AP: Upstream open reading frames as regulators of
mRNA translation. Mol Cell Biol 2000, 20:8635–8642.
37. Kochetov AV, Ahmad S, Ivanisenko V, Volkova OA, Kolchanov NA, Sarai A: uORFs, reinitiation and alternative translation start sites in human mRNAs. FEBS Lett 2008, 582:1293–1297.
38. Ge X, Jung YC, Wu Q, Kibbe WA, Wang SM: Annotating nonspecific SAGE tags with microarray data. Genomics 2006, 87:173–180.
39. Balázs B, Hui J, Jainab K, Emily W, Brian R, Will G, Anshul K, Gunawardena HP, Yanbao Y, Ling X, et al: Long non-coding RNAs are rarely translated in two human cell lines. Genome research 2010, 22(9):646–1657.
40. Omenn GS, Yocum AK, Menon R: Alternative splice variants, a new class of protein cancer biomarker candidates: findings in pancreatic cancer and breast cancer with systems biology implications. Dis Markers 2010, 28:241–251. 41. Menon R, Omenn GS: Proteomic characterization of novel alternative
splice variant proteins in human epidermal growth factor receptor 2/ neu-induced breast cancers. Cancer Res 2010, 70:3440–3449.
42. Ding L, Ellis MJ, Li S, Larson DE, Chen K, Wallis JW, Harris CC, McLellan MD, Fulton RS, Fulton LL, et al: Genome remodelling in a basal-like breast cancer metastasis and xenograft. Nature 2010, 464:999–1005. 43. Song XC, Fu G, Yang X, Jiang Z, Wang Y, Zhou GW: Protein expression
profiling of breast cancer cells by dissociable antibody microarray (DAMA) staining. Mol Cell Proteomics 2008, 7:163–169.
44. Cox B, Emili A: Tissue subcellular fractionation and protein extraction for use in mass-spectrometry-based proteomics. Nat Protocols 2006, 1:1872–1878.
45. Shevchenko A, Tomas H, Havlis J, Olsen JV, Mann M: In-gel digestion for mass spectrometric characterization of proteins and proteomes. Nat Protocols 2006, 1:2856–2860.
46. Fenyo D, Beavis RC: A method for assessing the statistical significance of mass spectrometry-based protein identifications using general scoring schemes. Anal Chem 2003, 75:768–774.
47. Kall L, Storey JD, MacCoss MJ, Noble WS: Assigning significance to peptides identified by tandem mass spectrometry using decoy databases. J Proteome Res 2008, 7:29–34.
doi:10.1186/1471-2164-14-141
Cite this article as: Khatun et al.: Whole human genome proteogenomic mapping for ENCODE cell line data: identifying protein-coding regions. BMC Genomics 2013 14:141.
Submit your next manuscript to BioMed Central and take full advantage of:
• Convenient online submission • Thorough peer review
• No space constraints or color figure charges • Immediate publication on acceptance
• Inclusion in PubMed, CAS, Scopus and Google Scholar • Research which is freely available for redistribution
Submit your manuscript at www.biomedcentral.com/submit